Pathways analysis with the BrCa dataset.
Once targets are selected in the target ID section, we can proceed incorporating the pathways from Reactome database (Keggs and others would suit as well), in this case Reactome low level pathways.
Targets selected in the target ID section
When Reactome pathways are incorporated into our working targets data frame, each target is replicated as many times as the number of pathways to which it is connected. Tubulin marked in the plot below.

Here, we have the same plot with tubulin marked as well, but now labels displayed are those pathways in which tubulin plays a role
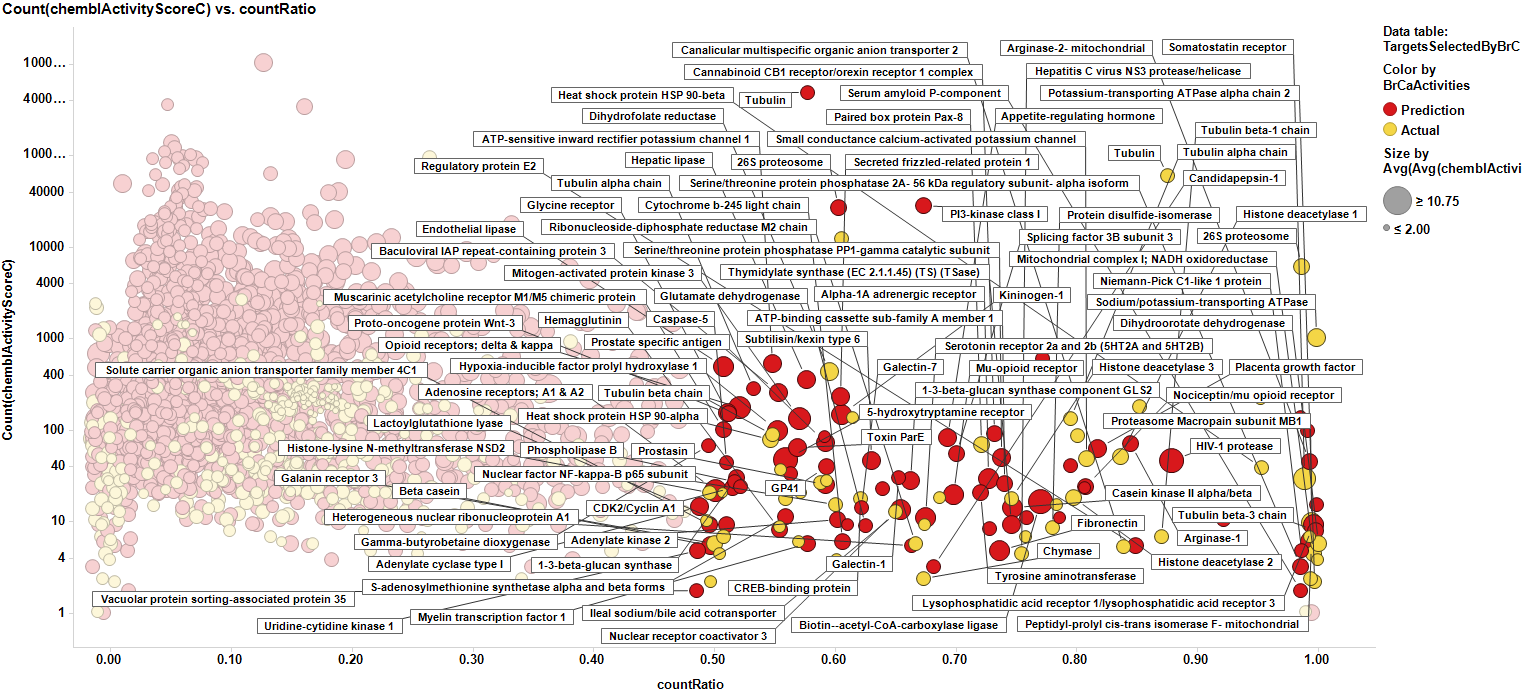
And here we mark the most relevant targets to show the pathways they are associated to.

Data can be then pivoted by pathway to also score pathways, With the same scores as the targets, but now, the count ratio is the average of the score of the proteins participating of each pathway, as is the case with the average chemblScore. The pathways count of scores is the sum of all protein events recorded for each pathway. Thus, we can visualize the potential of each involved pathway in plots similar to those employed for targets.
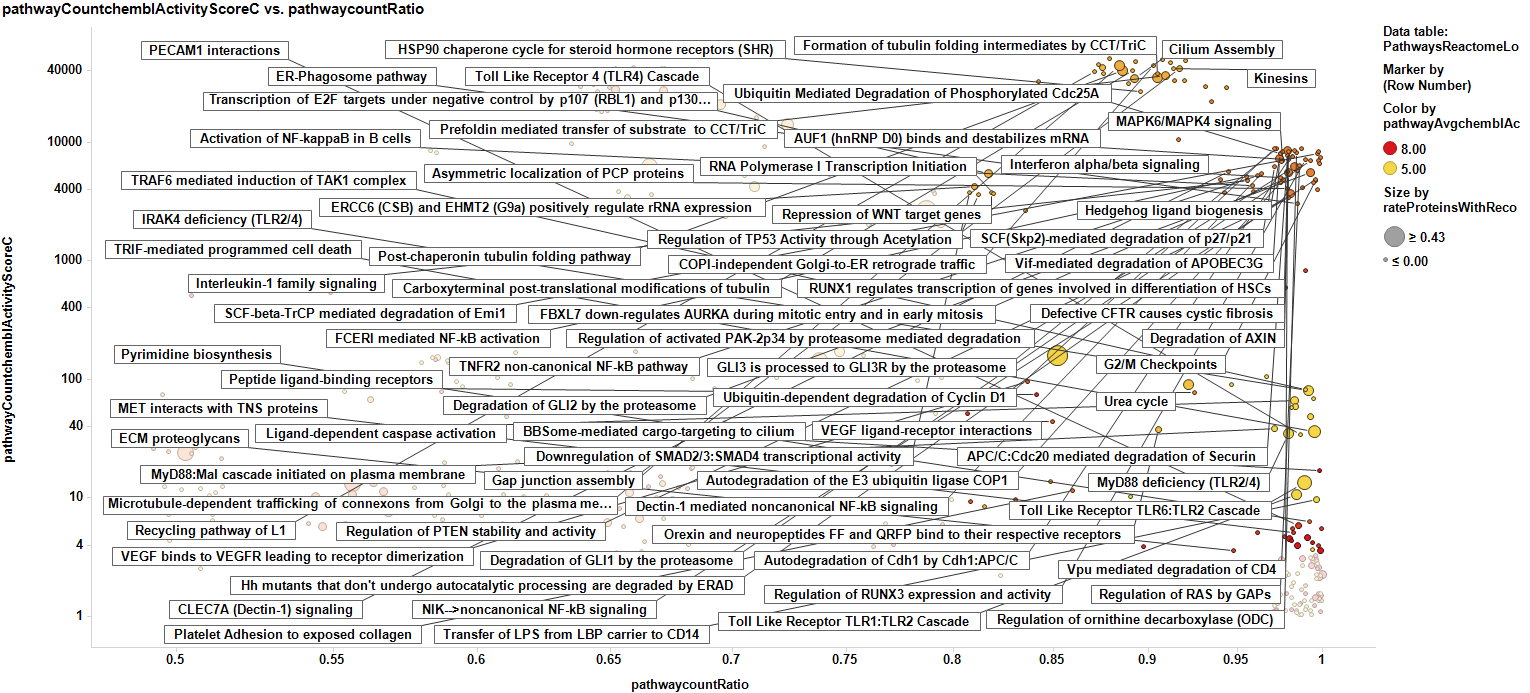
Pathways scoring plot
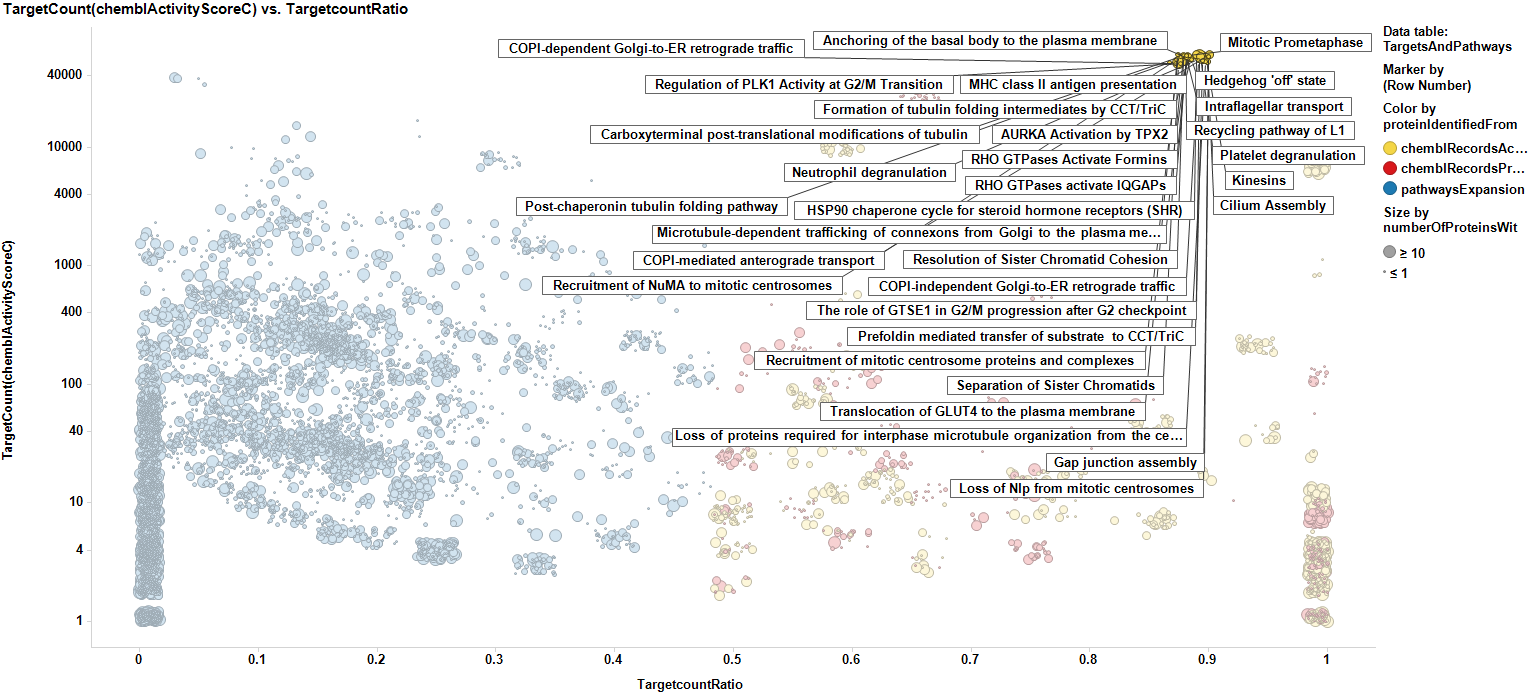
We can now expand pathways to the overall proteins they contain, no matter whether they are contained in our ChEMBL database or not, but we can consider them additionally for further studies according to the score of the pathway they belong to. Now we have a data frame with scores for pathways, targets with real annotations (yellow), targets with scores predicted by machine learning algorithms (red), and targets without annotation, but belonging to the pathways identified from association to selected targets (blue). For targets from pathways expansion, there is the option of selecting some with a high pathway score, to incorporate them to the target selection list.
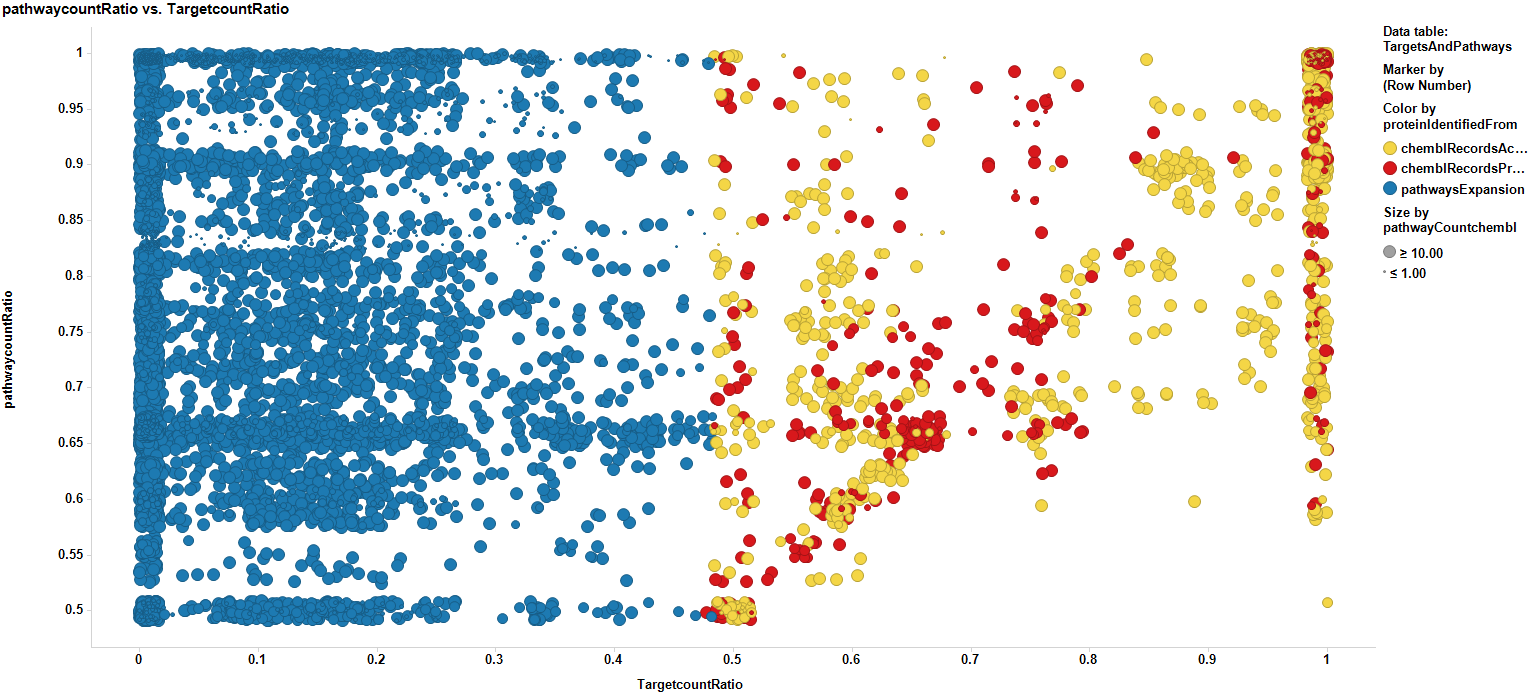
The link to table below contains the best records from target to pathways annotation. Basically CountRatio>0.7 for targets and 0.6 for pathways.
Pathways analysis. The use of graph databases.
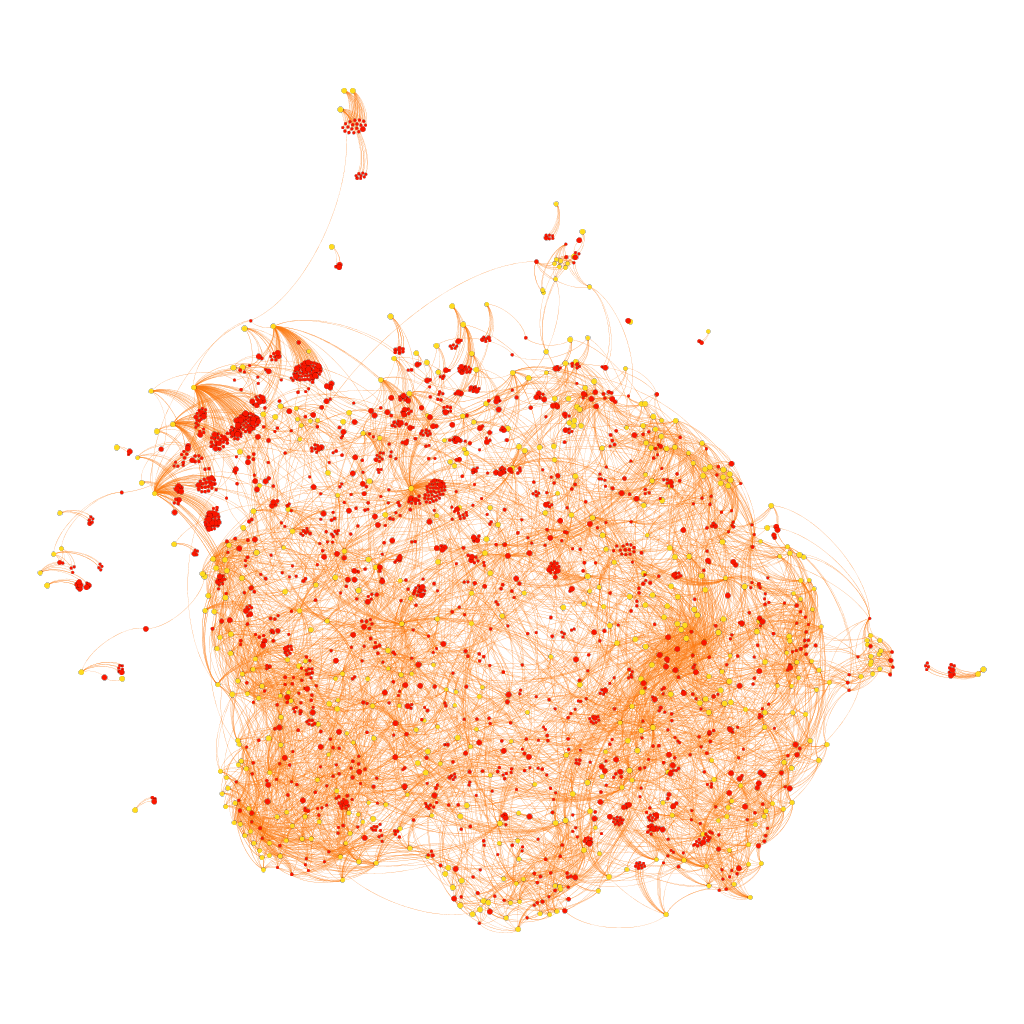
What we have now is a collection of target-pathway pairs accompanied by a series of numerical and class descriptors. We can track the relationships among all pair members and quantify and categorize them using the descriptors as weights and labels. This is what graph databases do, and we can always query the database for components and properties.
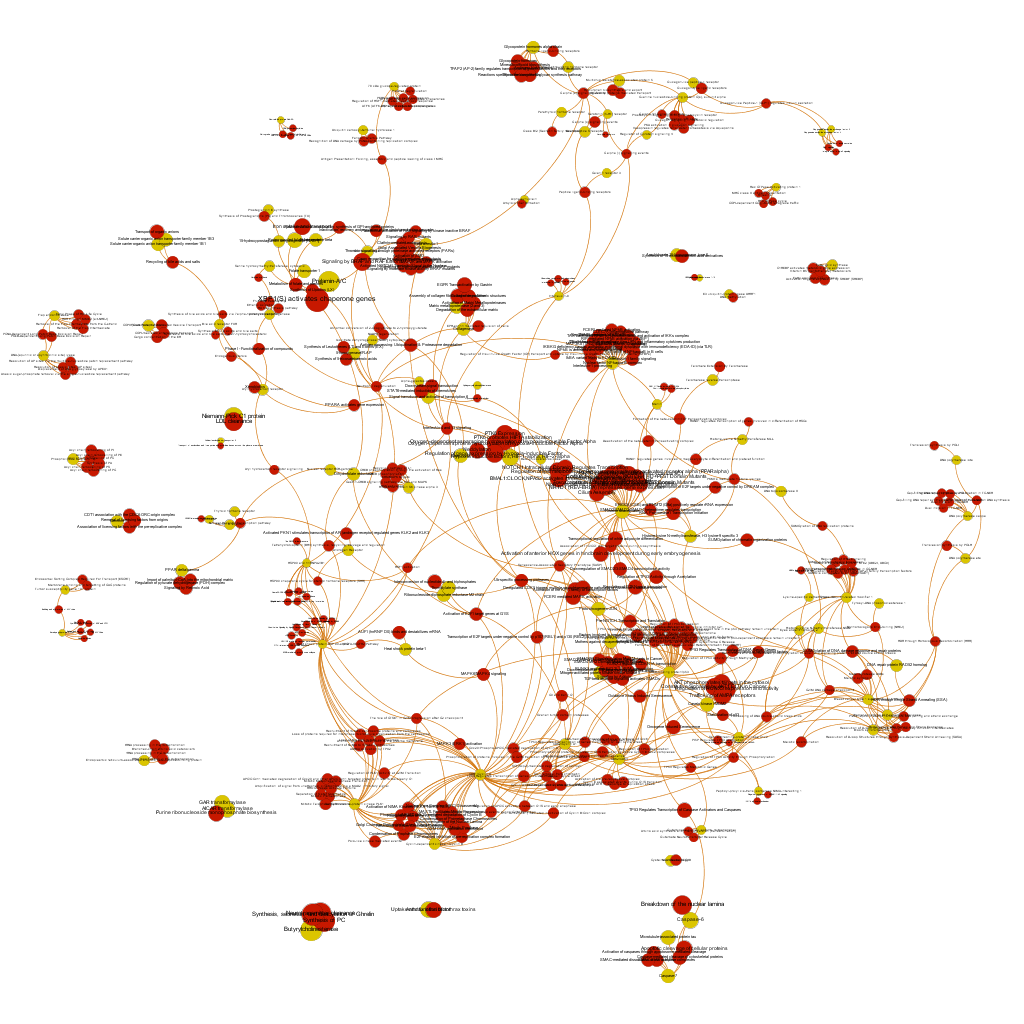
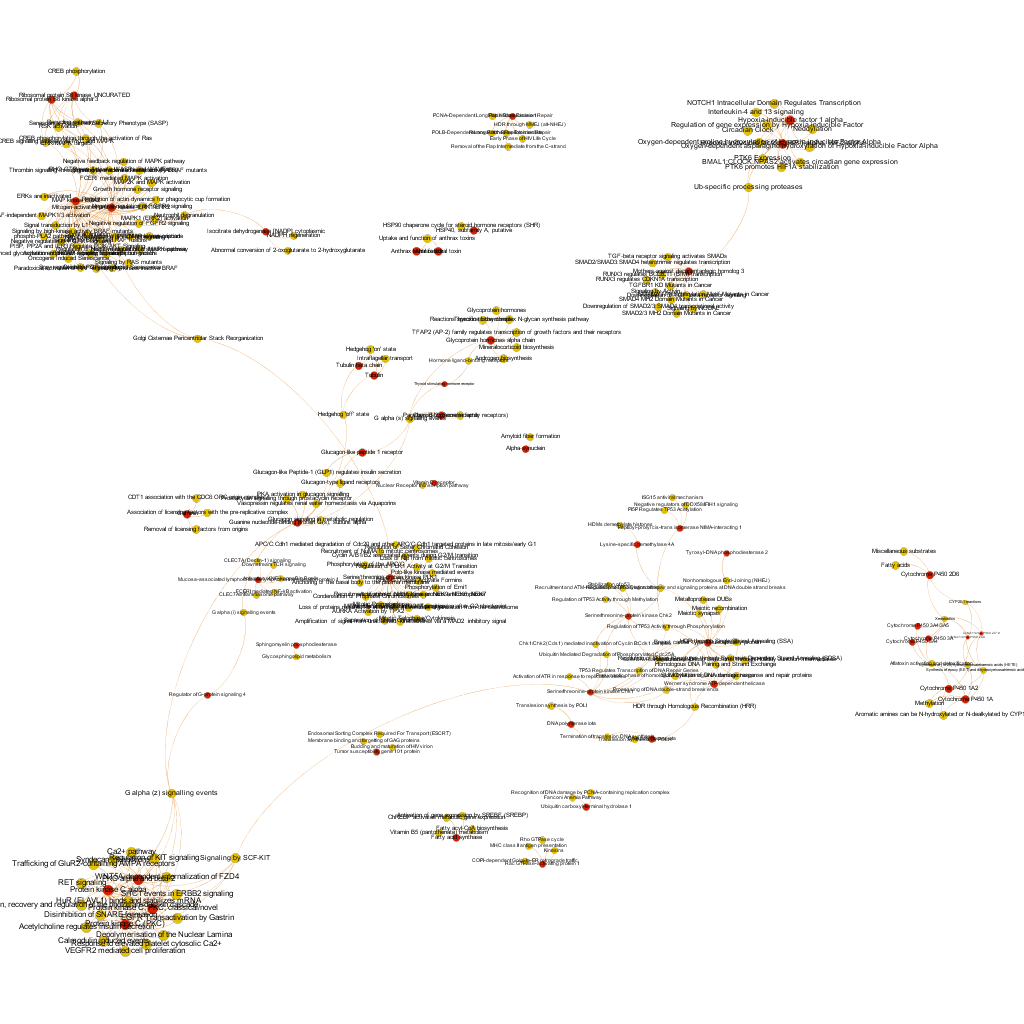
This is the aspect of the whole BrCa graph DB. Red nodes are targets and yellow nodes are pathways, both sized by their centrality (degree of connections). It is not easy to extract information with precision from this ,but we can appreciate that nodes group themselves in areas with different densities and different information traffic (edges).
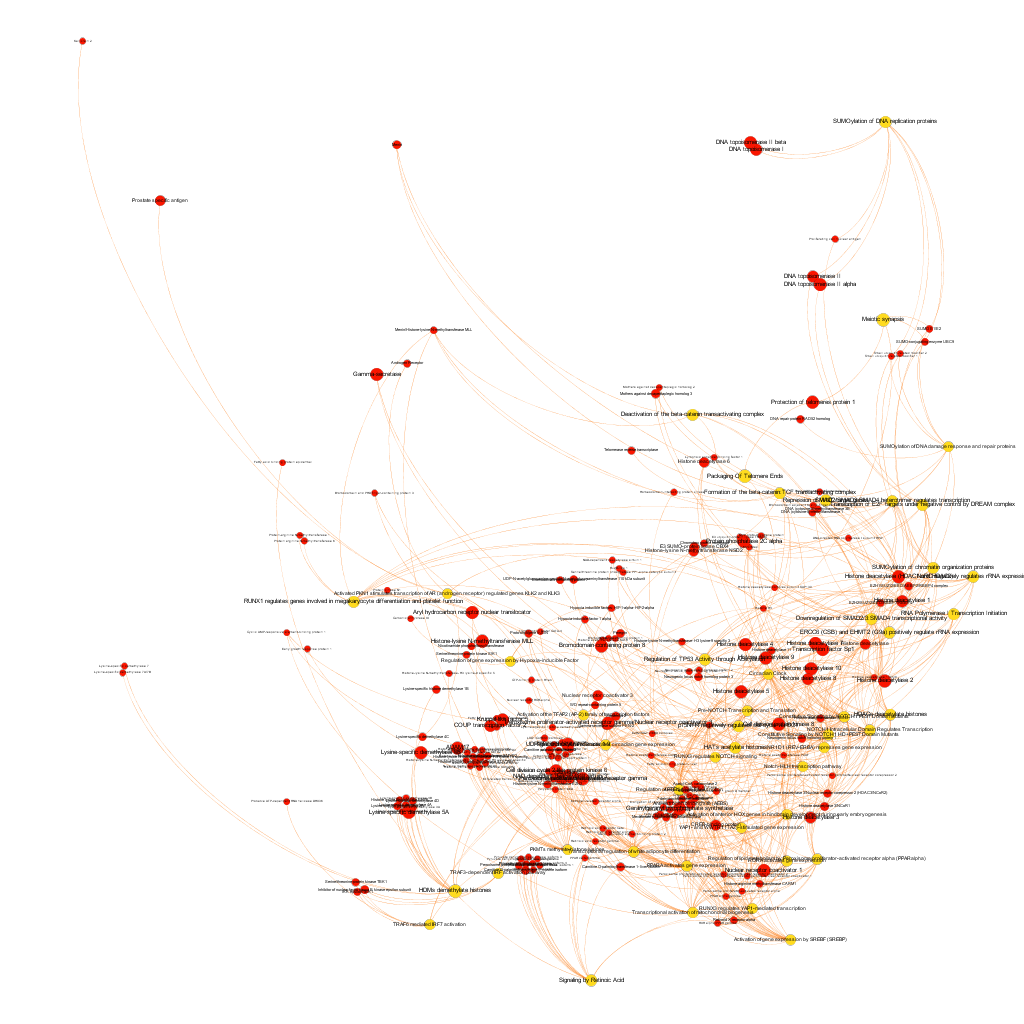
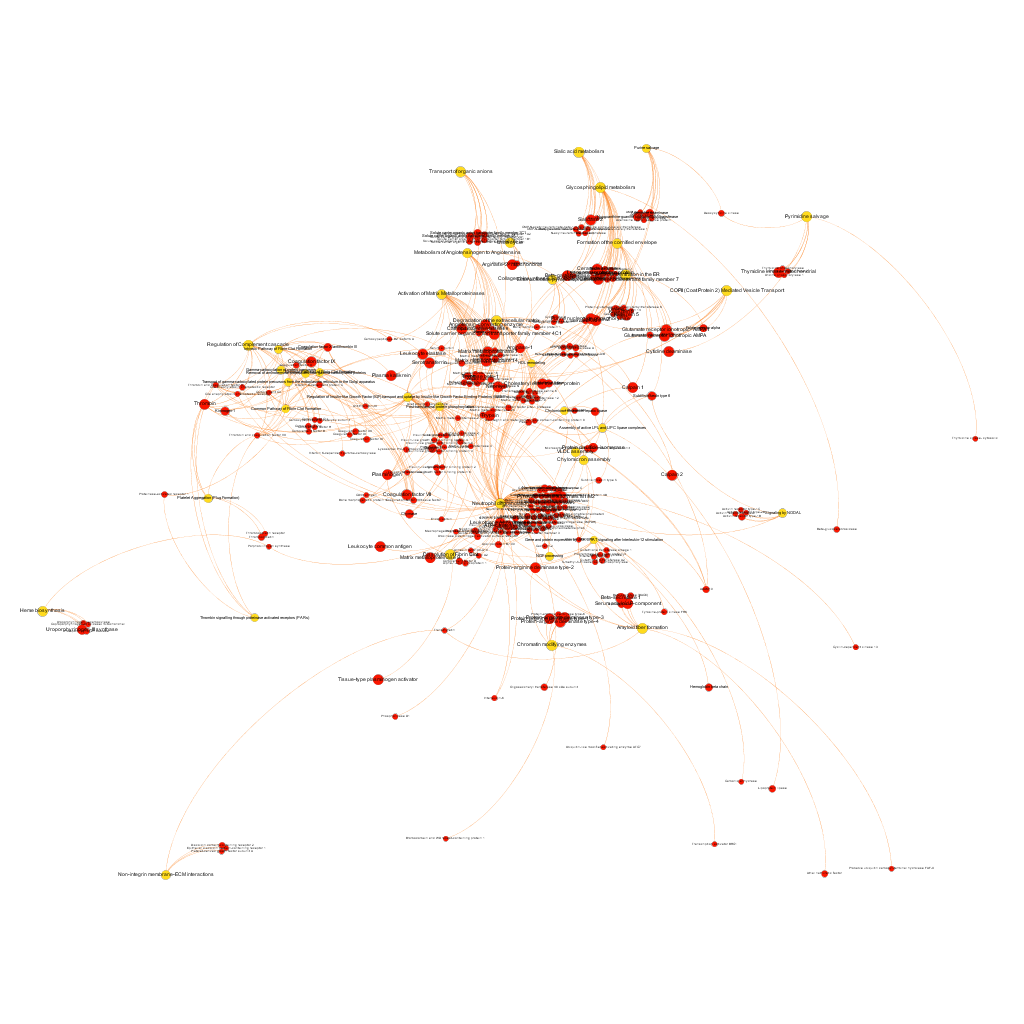
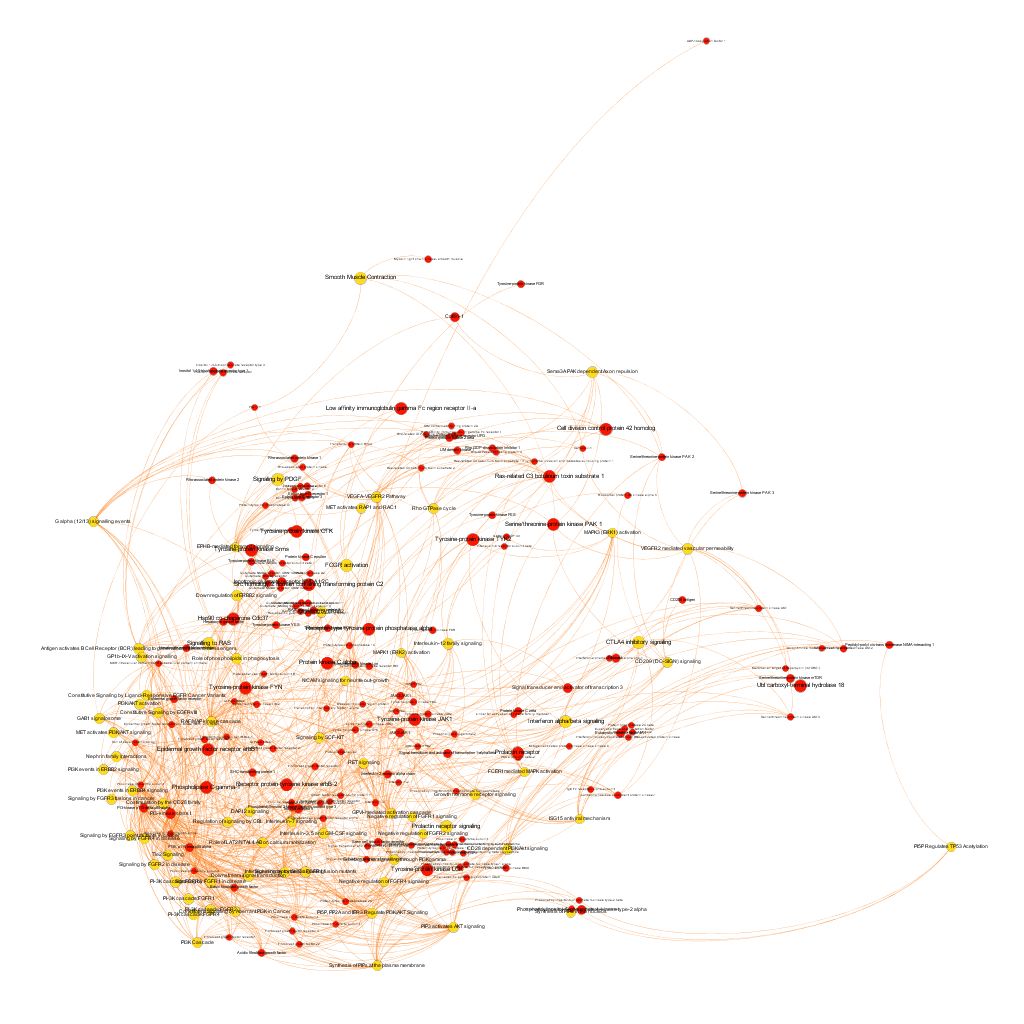
The dataset can be also grouped by the degree of the existing relationships, its strength and proximity. In this case, a community detection algorithm (modularity) has been applied to detect potential clusters within which the connections are more frequent. The algorithms provide several clusters, some of them with potentially relevant biological information. The graph below displays them coloured by cluster, summarizing the most frequent biological features for each.
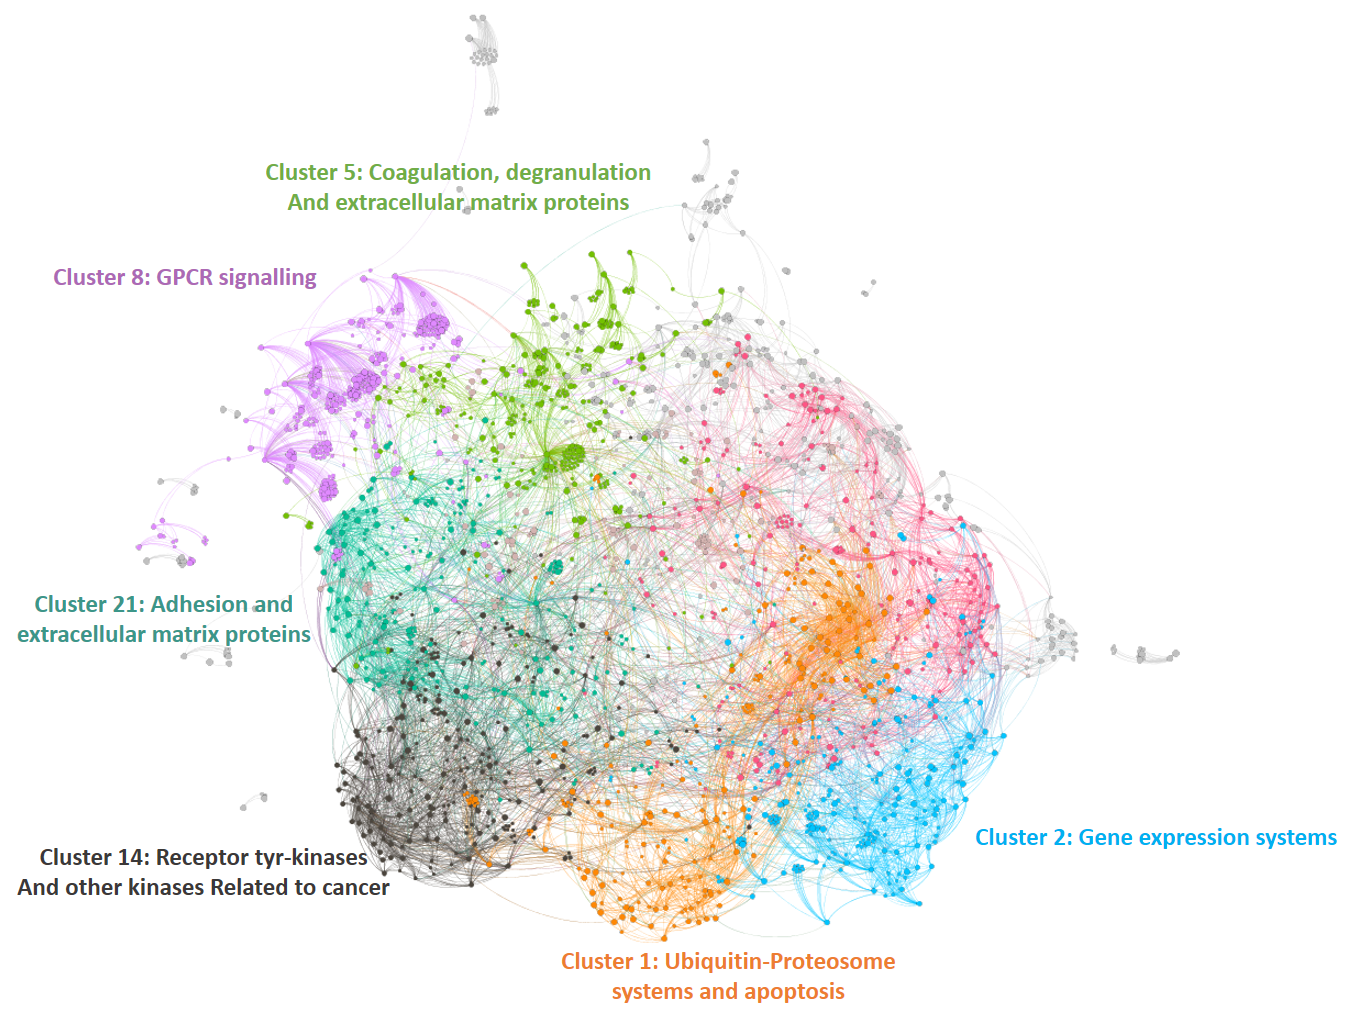
Cluster 1, groups targets involved in the ubiquitin proteasome system, alongside differentiation and apoptosis related pathways. Cluster 2 is mainly composed of biosystems associated with gene expression. Cluster 5 principally contains paths involved in coagulation, degranulation and extracellular matrix processes. Cluster 8 is almost exclusively composed of GPCR signalling pathways. In cluster 14 TyrR kinases and other kinases frequently related to cancer predominate. Cluster 21 has a strong representation of adhesion molecules and extracellular matrix proteins.
Below, the six clusters appear in six independent graphs. By clicking in the graph you can access to the png image while doing it in the link below each graph access is granted to the pdf, where you can zoom at t your convenience.
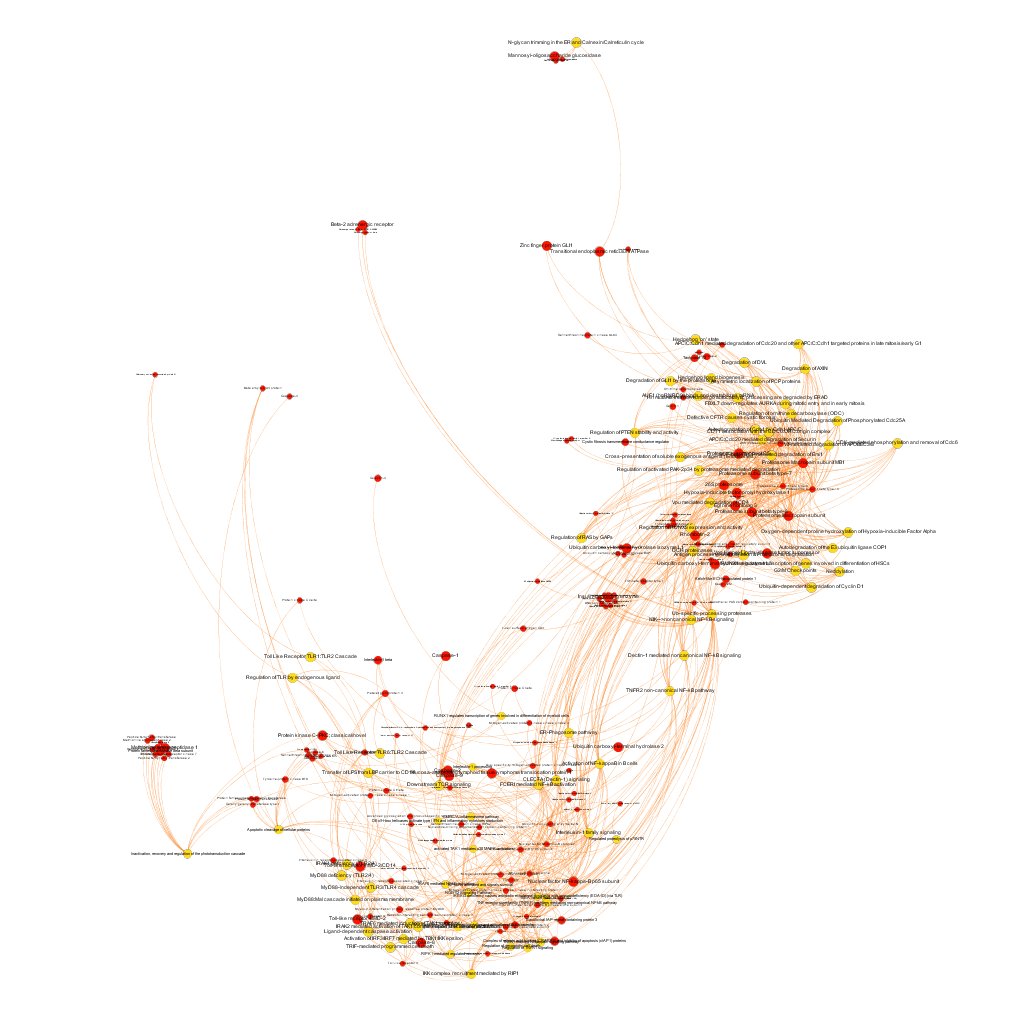

 Click to zoom into cluster 14 proteins and pathways.
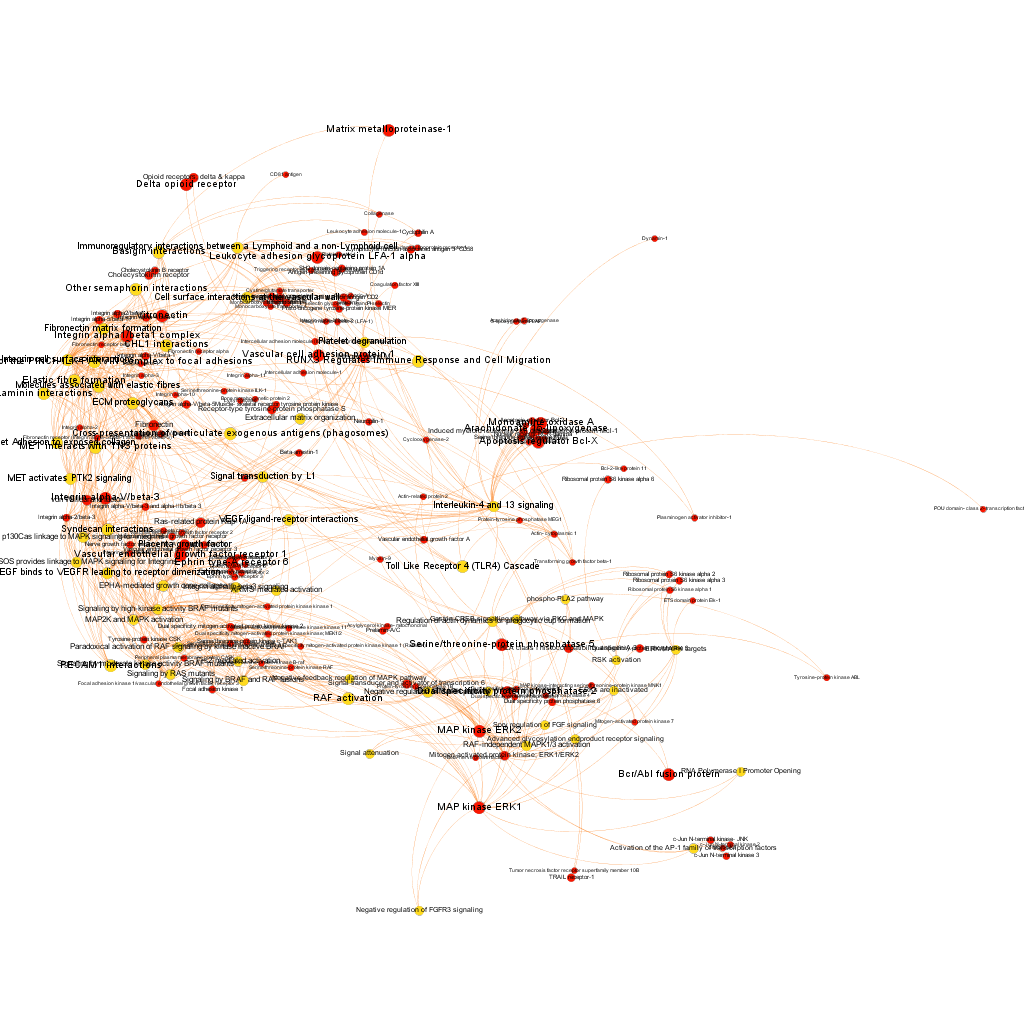
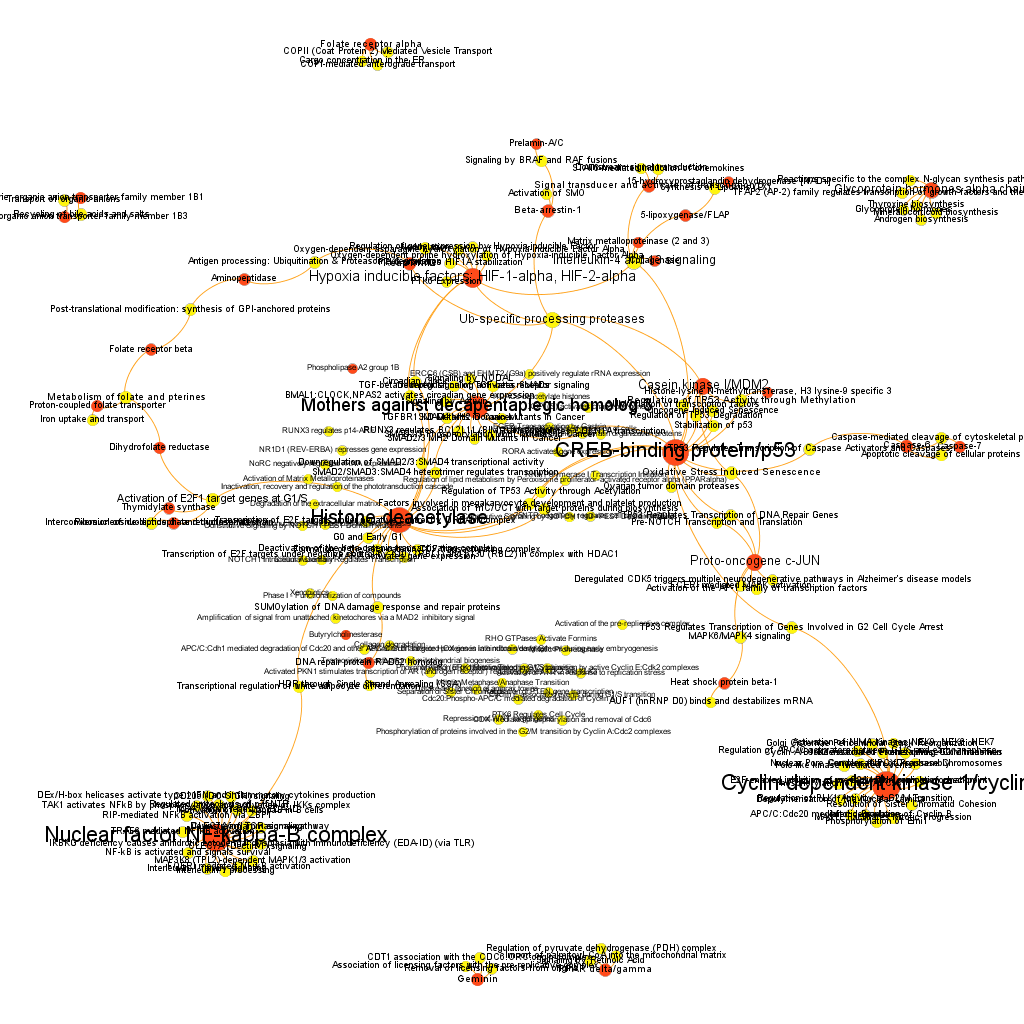
These are, so far, rough estimations of the social protein network, but we can go delve deeper into the most potent targets and pathways (by estimation of the scores of proteins involved in). Here we show two sorts of selections by potency. Red color nodes are protein targets, while in yellow are pathways (this will be a constant…). Both types of node are sized by their centrality measures.
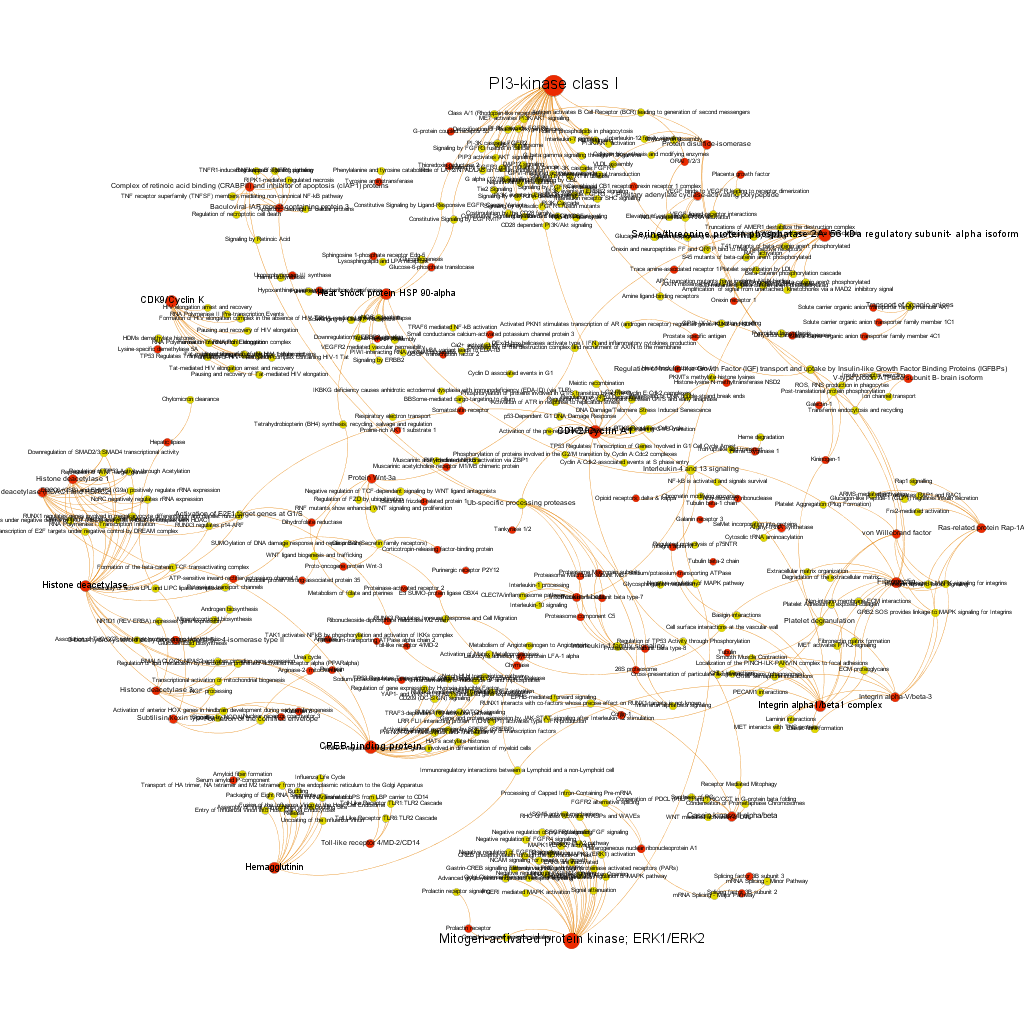
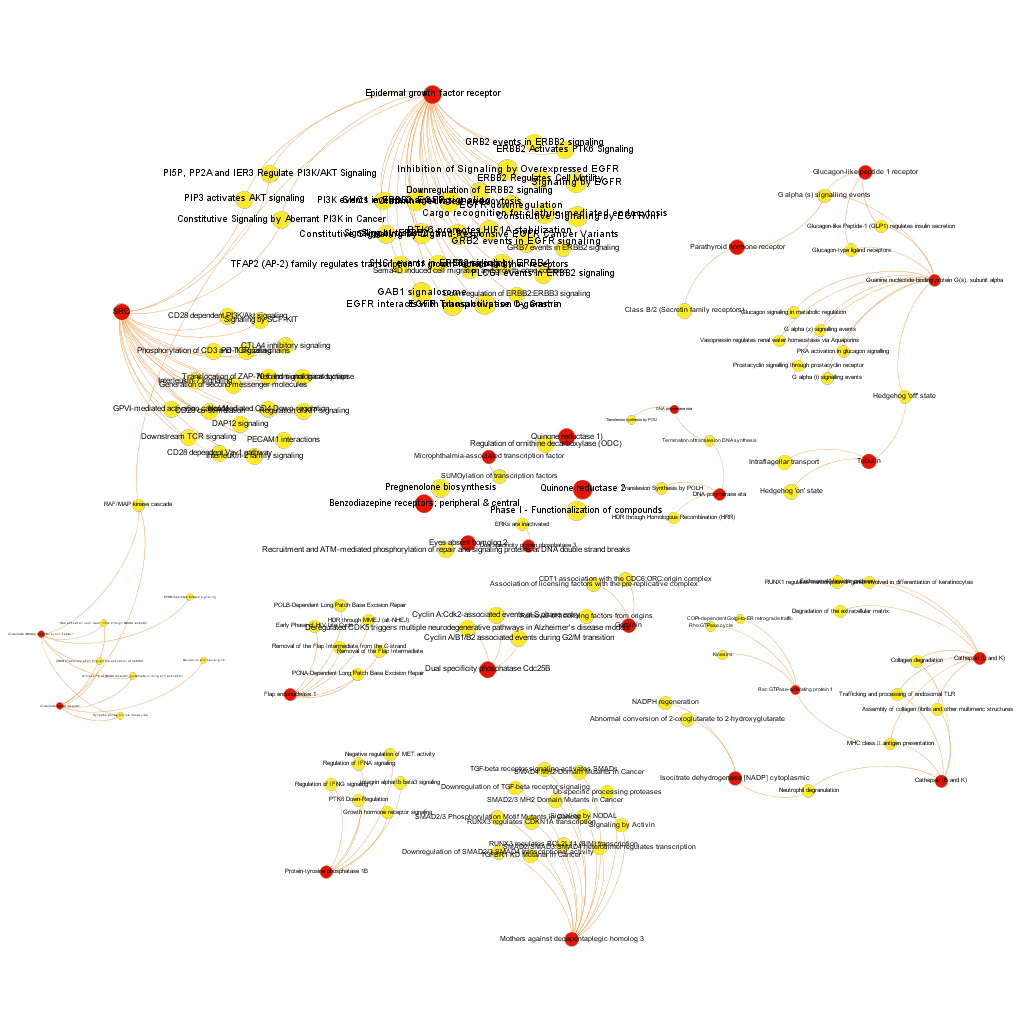
Low stringency selection. graph displays proteins where the averageScore of BrCa active compounds is >5. We see interesting and documented BrCa targets, PI3Kinase, Serine/threonin phosphatase2, CDK9, HSP90 alpha, histone deacetylase, CREB binding protein, hemaglutinin, ERKs, ERKs, among others. But we also see some pathways with high connectivity with active protein targets, like Ub-specific processing proteases. Click on the link below the graph to explore the pdf file and zoom.
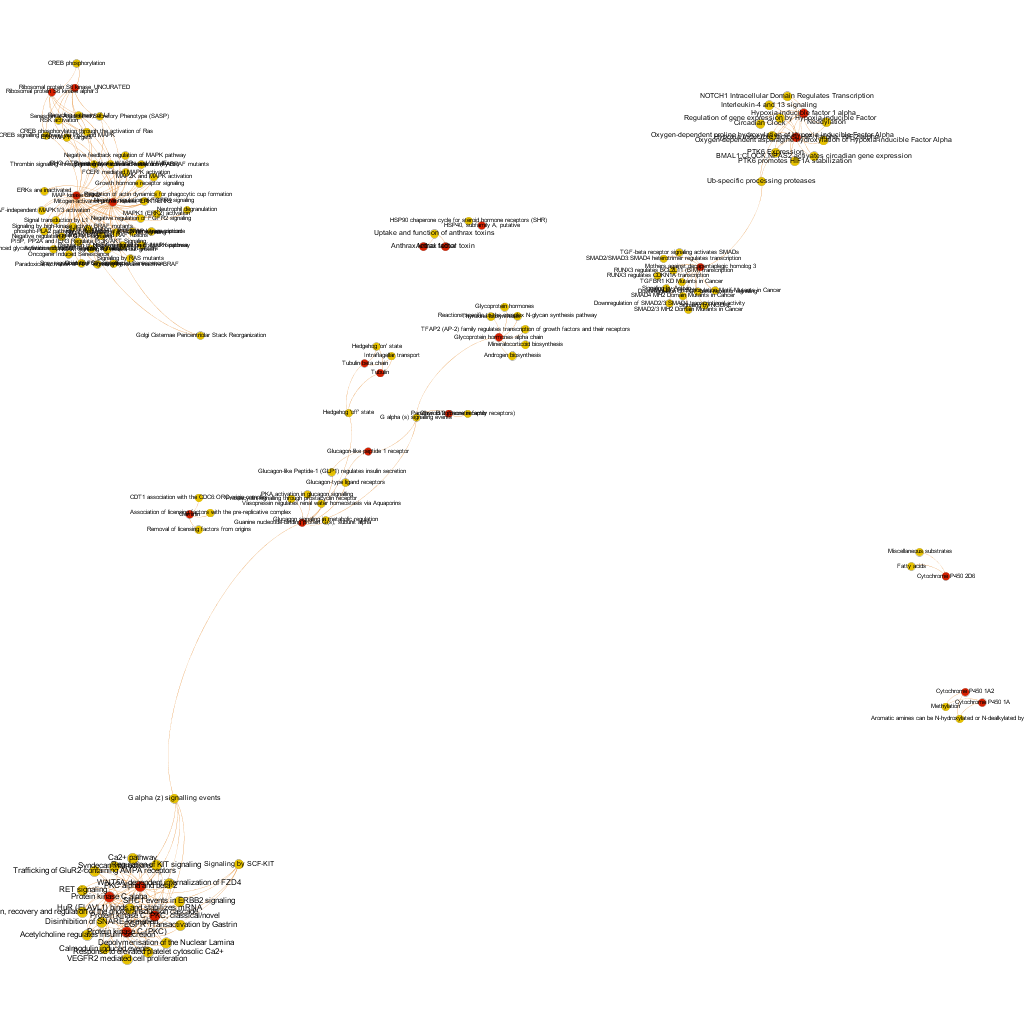
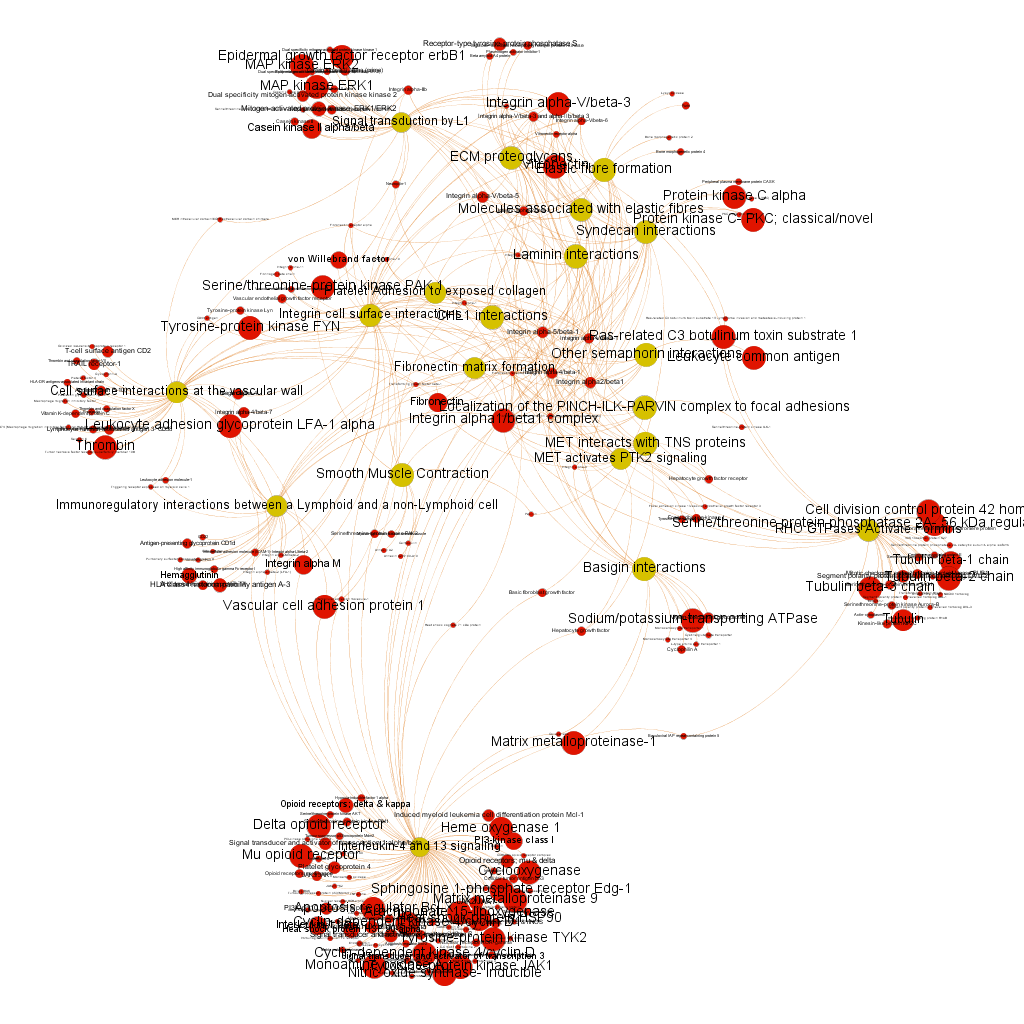
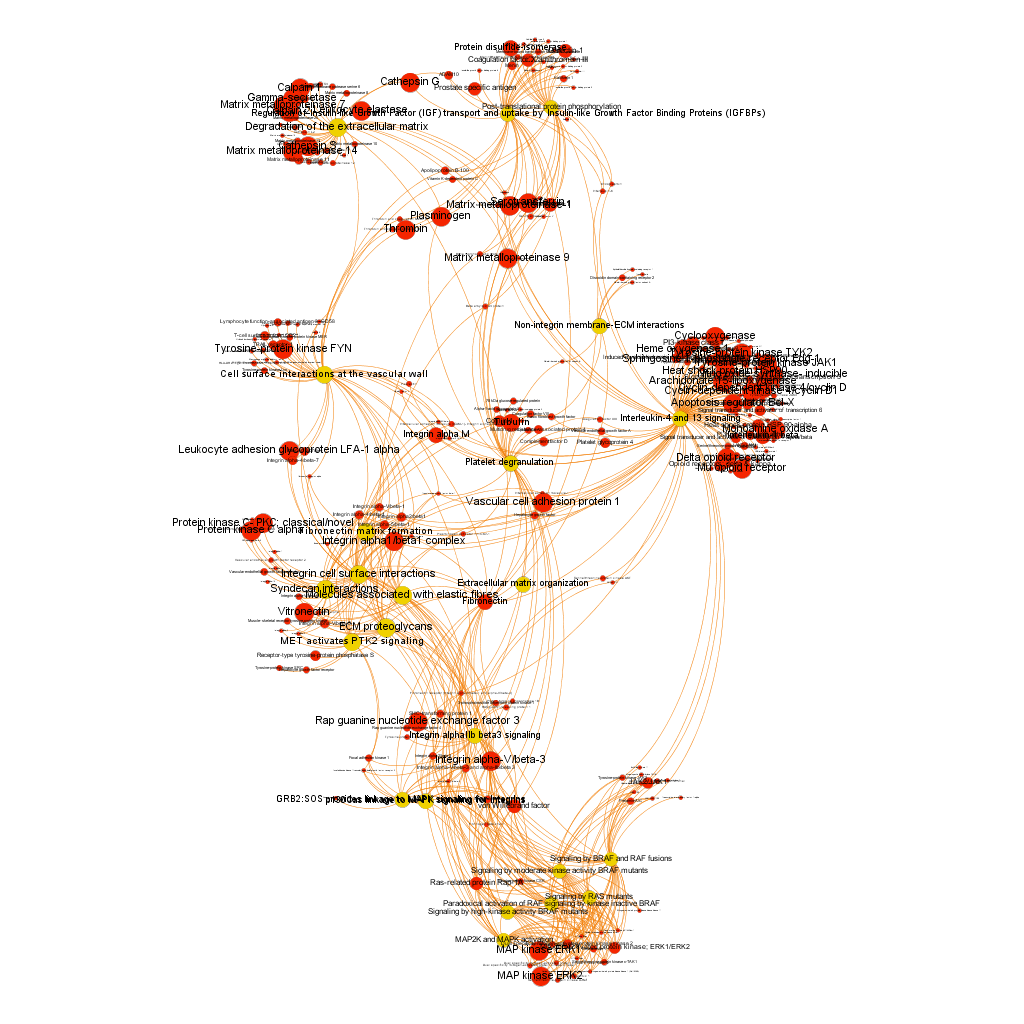
High stringency selection. graph displays proteins where the averageScore of BrCa active compounds is >6. We see now again Serine/threonin phosphatase2, but also integrins alpha1/beta1 complex and alpha5/beta3, fibronectin and others. Sizes may be different to the lower stringency selection because centrality measures are recalculated upon filtering. High connectivity pathways are now related to adhesion (laminin interactions, ECM proteoglycans and elastic fibre formation). Click on the link below the graph to explore the pdf file and zoom.
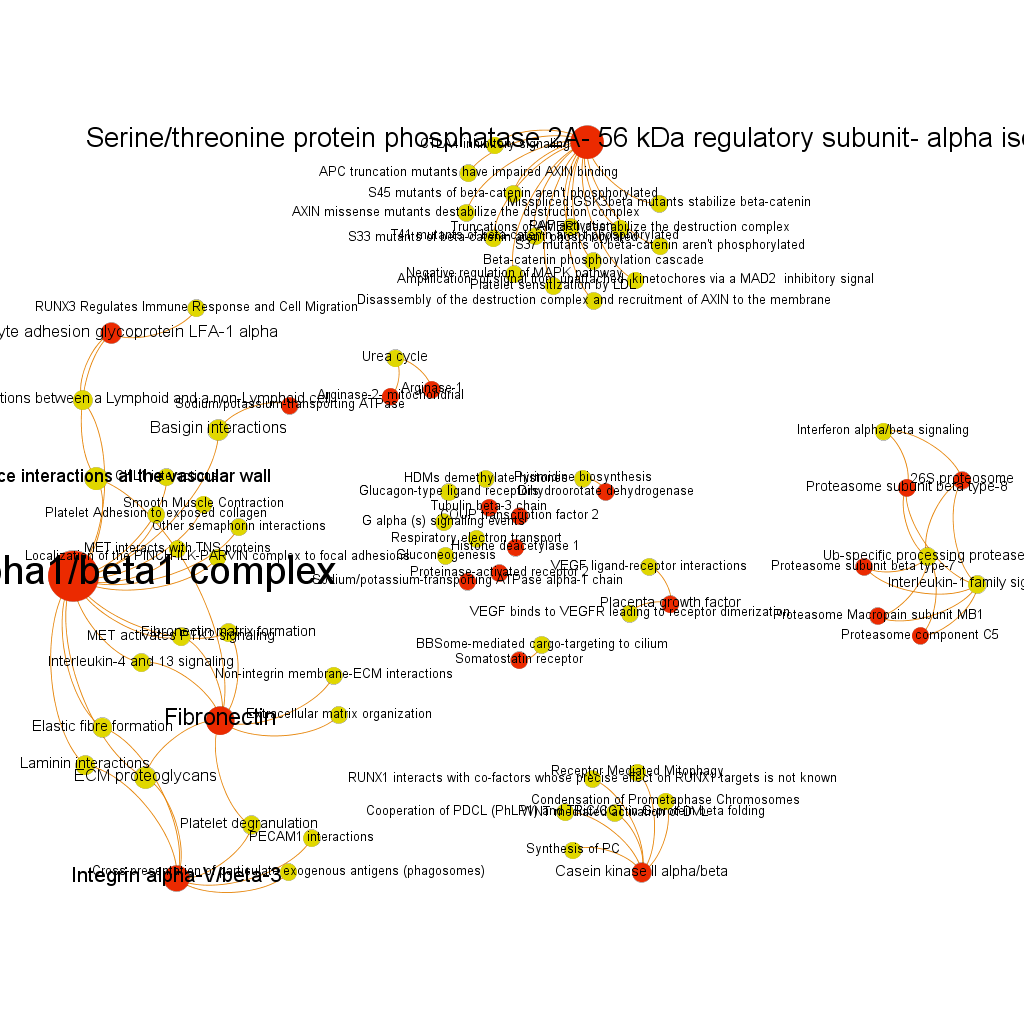
We have seen two examples of selection based on different metrics, but we could also be interested in the relationships of a particular protein. In which pathways does it participate? What additional proteins are also involved in these pathways? The graph below show 3 examples of 3 different proteins with outstanding potency and/or count ratio scores.
Integrin alpha1/beta1 complex
Serine/threonine protein phosphatase 2A, 56 kDa regulatory subunit, alpha isoform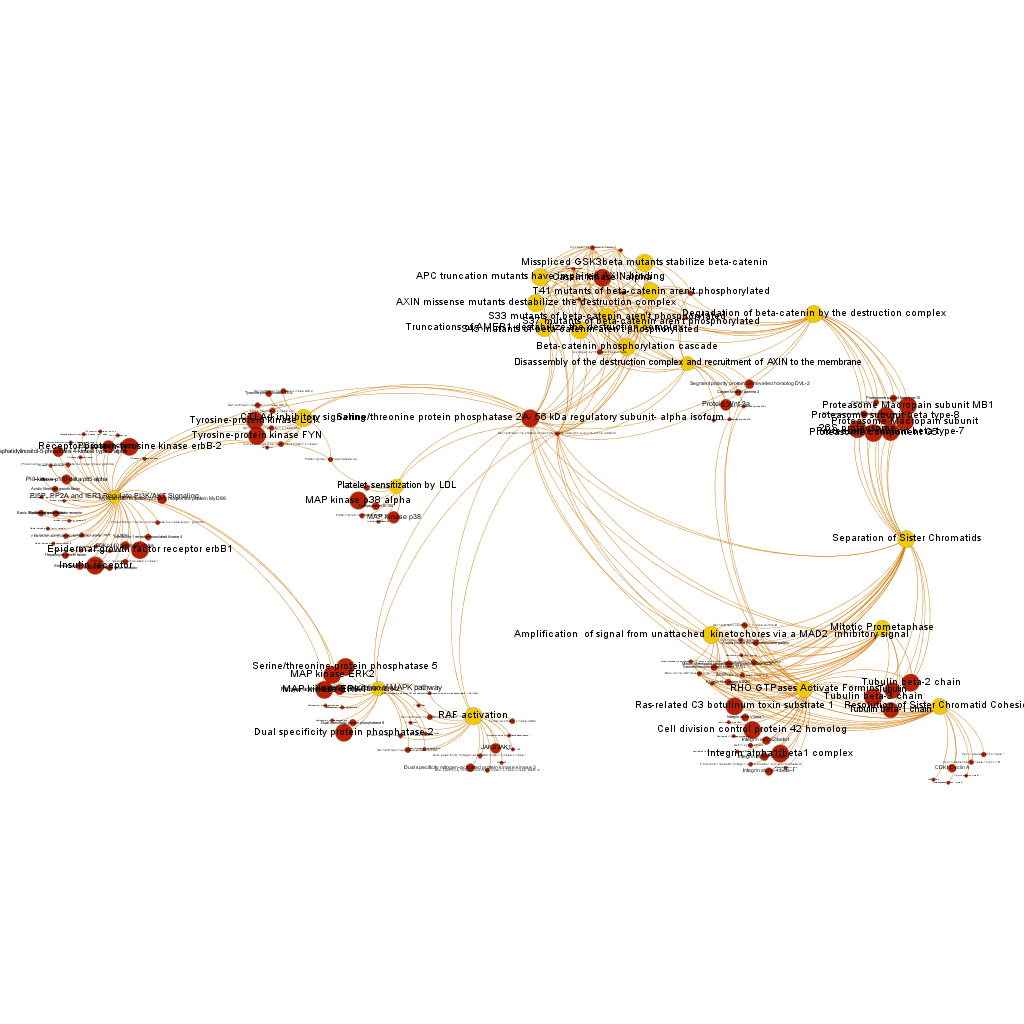 BrCaAllWithLabelsSerThre256
Fibronectin
Click on the button below to access the graph data
In the same manner as undertaken in the target selection section, we can perform the pathways analysis on proteins with activity in specific cell lines. Here, we add the corresponding graphs for the MCF7, DA-MB-231, MDA-MB-435.
And the selection of the best scoring targets and pathways.