ALR (Augmenter of liver regeneration)
ALR Data Description

By Jawahar Swaminathan and MSD staff at the European Bioinformatics Institute – http://www.ebi.ac.uk/pdbe-srv/view/images/entry/1oqc600.png, displayed on http://www.ebi.ac.uk/pdbe-srv/view/entry/1oqc/summary, Public Domain, https://commons.wikimedia.org/w/index.php?curid=5902148
‘Augmenter of liver regeneration’ (ALR) (also known as hepatic stimulatory substance or hepatopoietin) was originally found to promote growth of hepatocytes in the regenerating or injured liver. ALR is expressed ubiquitously in all organs, and exclusively in hepatocytes in the liver. ALR, a survival factor for hepatocytes, exhibits significant homology with ERV1 (essential for respiration and viability) protein that is essential for the survival of the yeast, Saccharomyces cerevisiae. ALR comprises 198 to 205 amino acids (approximately 22 kDa), but is post-translationally modified to three high molecular weight species (approximately 38 to 42 kDa) found in hepatocytes. ALR is present in mitochondria, cytosol, endoplasmic reticulum, and nucleus. Mitochondrial ALR may be involved in oxidative phosphorylation, but also functions as sulfhydryl oxidase and cytochrome c reductase, and causes Fe/S maturation of proteins. ALR, secreted by hepatocytes, stimulates synthesis of TNF-α, IL-6, and nitric oxide in Kupffer cells via a G-protein coupled receptor. While the 22 kDa rat recombinant ALR does not stimulate DNA synthesis in hepatocytes, the short form (15 kDa) of human recombinant ALR was reported to be equipotent as or even stronger than TGF-α or HGF as a mitogen for hepatocytes. Altered serum ALR levels in certain pathological conditions suggest that it may be a diagnostic marker for liver injury/disease. Although ALR appears to have multiple functions, the knowledge of its role in various organs, including the liver, is extremely inadequate, and it is not known whether different ALR species have distinct functions. Future research should provide better understanding of the expression and functions of this enigmatic molecule.
“Augmenter of liver regeneration”, Chandrashekhar R., Fibrogenesis Tissue Repair. 2012; 5: 10.).
ALR inhibitors for Cancer.
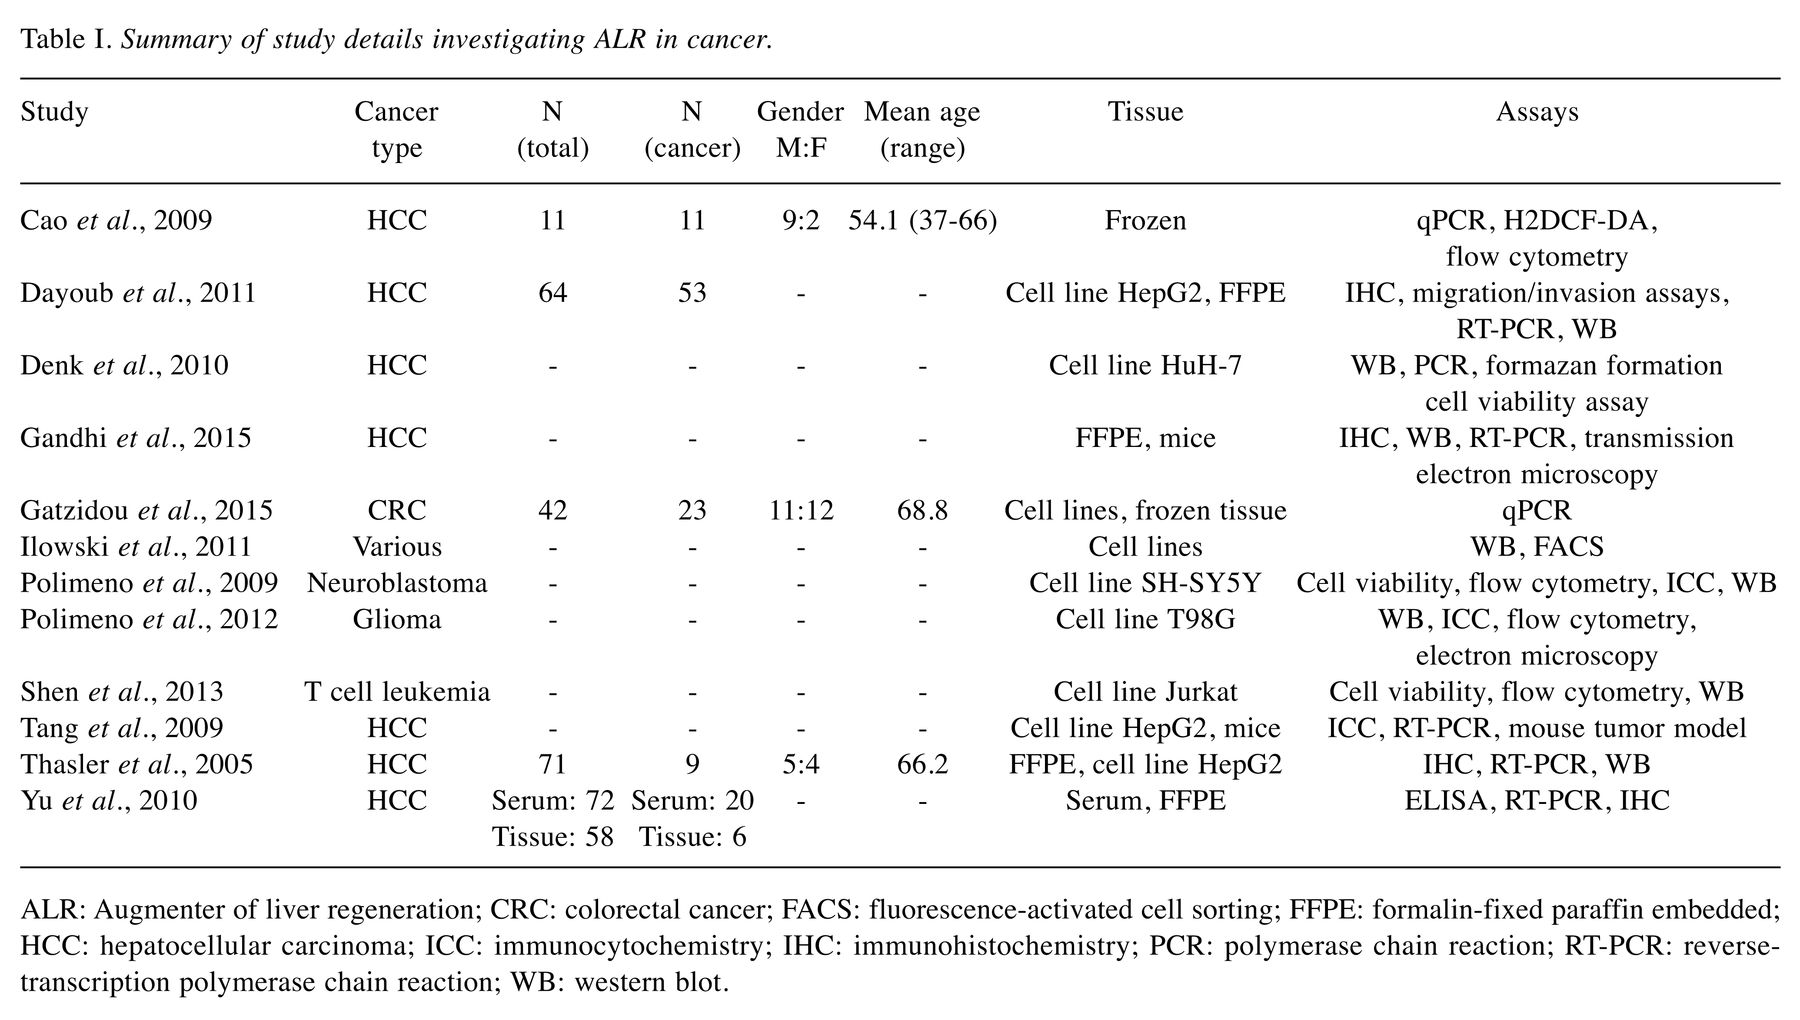
Hepatocellular carcinoma is a substantial healthcare burden with high prevalence and poor prognosis. As such, efforts are continually made to uncover molecules relevant in cancer biology, that are exploitable as targets for therapy. The mitochondrion is the powerhouse of the cell and exhibits altered functionality in the malignant state, including aberrant regulation of apoptosis and cellular respiration. Augmenter of liver regeneration (ALR) is a multifunctional mitochondrial protein that demonstrates antioxidative and anti-apoptotic properties and plays a key role in liver regeneration. Systematic search of PubMed resulted in 12 studies discussing ALR in multiple types of cancer. More specifically, ALR appears to be up-regulated in malignant cells and tissues. Furthermore, treatment of cells with exogenous ALR shows an anti-apoptotic effect while silencing or inhibiting ALR decreases cell and tumor survival. Conclusion: ALR clearly plays a role in cancer biology and demonstrates potential as a therapeutic target.
ALR activators for fibrosis.
Renal fibrosis is a hallmark in CKD (chronic kidney disease) and is strongly correlated to the deterioration of renal function that is characterized by tubulointerstitial fibrosis, tubular atrophy, glomerulosclerosis and disruption of the normal architecture of the kidney. ALR (augmenter of liver regeneration) is a growth factor with biological functions similar to those of HGF (hepatocyte growth factor). In this study, our results indicate that endogenous ALR is involved in the pathological progression of renal fibrosis in UUO (unilateral ureteral obstruction) rat model. Moreover, we find
that administration of rhALR (recombinant human ALR) significantly alleviates renal interstitial fibrosis and reduces renal-fibrosis-related proteins in UUO rats. Further investigation reveals that rhALR suppresses the up-regulated expression of TGF-β1 (transforming growth factor β1) induced by UUO operation in the obstructed kidney, and inhibits Smad2 and Smad3 phosphorylation activated by the UUO-induced injury in the animal model. Therefore we suggest that ALR is involved in the progression of renal fibrosis and administration of rhALR protects the kidney against renal fibrosis by inhibition of TGF-β/Smad activity.
Program data
HTS-Luminescent assay for inhibitors of ALR by detection of hydrogen peroxide production Measured in Biochemical System Using Plate Reader – 2036-02_Inhibitor_SinglePoint_HTS.
| PubChem AID: | 485317 |
|---|---|
| Protein Target: | FAD-linked sulfhydryl oxidase ALR [Homo sapiens] |
| Source: | Broad Institute |
| External ID: | 2036-02_Inhibitor_SinglePoint_HTS |
| BioAssay Type: | Primary Screening |
| Tested Substances: | |
| Tested Compounds: | |
| Version: | |
| Status: | Live |
| Dates: |
|
This bioassay record (AID 485317) belongs to the assay project “Summary of Broad Institute MLPCN Small Molecule Modulators for Redox Regulation in the Mitochondrial Intermembrane Space Project“, which is associated with the summary AID 488787 and a total of 3 additional BioAssay records in PubChem.
Description
Keywords: Mitochondria, biogenesis, protein import, intermembrane space, FAD, sulfhydryl oxidase, ALR, Erv1 Primary Collaborators: Carla Koehler,UCLA,Los Angeles,CA,koehlerc@chem.ucla.edu,310-794-4834 Deepa Dabir,UCLA,Los Angeles,CA,deepad@chem.ucla.edu Samuel Hasson,UCLA,Los Angeles,CA,hassons@gmail.com Biological Relevance: Defects in mitochondrial assembly impact a wide range of diseases from degenerative muscle and neural diseases to cancer. The mitochondrion is not only important for the production of energy but plays an important role in other aspects such as intermediary metabolism and signaling. The mitochondrion contains an inner membrane and outer membrane that separate the matrix from the intermembrane space. The intermembrane space is an important compartment because it houses molecules such as cytochrome c and apoptosis inducing factor (AIF) that are released during apoptosis. Recently, the intermembrane space has been implicated in diseases such as Parkinson’s disease by the presence of the kinase PINK1. In addition, we continue to make new discoveries about the function of this compartment. Specifically, we have identified a new import pathway in the intermembrane space that is redox regulated, indicating that oxidation-reduction reactions are unexpectedly housed in this compartment. Key components include the sulfhydryl oxidase Erv1 and cytochrome c, which form a complex in the intermembrane space. A recent study has demonstrated a role of ALR, the human Erv1 homolog, in Autosomal-Recessive Myopathy. Both Erv1 and ALR belong to a class of FAD dependent sulfhydryl oxidases that have essential roles in the mitochondrion. Project Goal: The goal of this project is to develop small molecule modulators that affect the mitochondrial sulfhydral oxidase pathways by using purified components, specifically ALR, in an in vitro assay.
Assay Overview:Screen for inhibitors of purified, recombinant ALR to oxidize the generic substrate DTT. Oxidation of DTT by ALR produces hydrogen peroxide, which was detected using horseradish peroxidase (HRP) and luminol. A solution of ALR and HRP was added to plates containing compounds, followed by the addition of DTT. The plates were incubated for 2 hours prior to the addition of the luminol solution. After a minute incubation, plates were read to detect the flash luminescence signal.
ProtocolHuman ALR is expressed and purified from E. coli. Enzyme preparations were supplied from the assay provider. HRP was purchased from Sigma and DTT and the SuperSignal ELISA Femto Luminol/Enhancer Solution were purchased from Thermo Scientific. With the exception of the luminol solution, all solutions were prepared with screening buffer (30mM HEPES, 100mM NaCl, 1mM EDTA, pH7.4). All solutions are kept chilled through the duration of the assay. ALR and HRP were diluted with screening buffer to a final concentration of 0.67uM and 0.027U/ml respectively in black, 384-well, low-volume plates (Greiner 784076), at a volume of 5ul. Inactivated ALR with HRP was used as a positive control, and was added to 32 designated control wells, in the same manner as the active enzyme. 7.5nl of compounds in DMSO were previously transferred to the plates via acoustic transfer (Echo555, LabCyte). 2.5ul of DTT in solution was added to all wells after the ALR solutions, to a final concentration of 133.3uM. The final reaction volume was 7.5ul. Plates were incubated at 37 degrees C for 2 hours in a Liconic STX220 incubator . At the completion of the incubation, 2.5ul luminol solution was added for a minute incubation. Plates were imaged for 25s to detect luminescence using a ViewLux (PerkinElmer). The assay was initiated by set-up in CBIP (Broad Chemical Biology Informatics Platform) and scheduled with Cellario (HighRes Biosolutions) to be executed on an integrated screening system (HighRes Biosolutions). Plates were moved from different instruments with a Staubli robot. ALR/HRP and DTT solutions were added using a Beckman BioRAPTR FRD Microfluidic Workstation. The luminol solution was added using a Multidrop Combi nL (Thermo).
Activators/inhibitorsAlthough the original assay was intended for ALR inhibitors, the negative inhibition tail in the single shot screening data will be used for analysis of activators or enhancers. | |
BioAssay Target
| BioAssay Target: 1 of 1 (Protein Target) | |
|---|---|
| Protein Target | FAD-linked sulfhydryl oxidase ALR [Homo sapiens] |
| Encoding Gene | GFER |
Understanding ALR Data
| BioAssay AID | BioAssay Name | Tested Substances | Active Substances | BioAssay Type |
|---|---|---|---|---|
| 485317 | HTS-Luminescent assay for inhibitors of ALR by detection of hydrogen peroxide production Measured in Biochemical System Using Plate Reader – 2036-02_Inhibitor_SinglePoint_HTS | 288803 | 10859 | Screening |
| 493248 | HTS-Luminescent assay for inhibitors of ALR by detection of hydrogen peroxide production Measured in Biochemical System Using Plate Reader – 2036-02_Inhibitor_Dose_CherryPick_Activity | 2345 | 1447 | Confirmatory |
| 540356 | Luminescence assay for the detection of hydrogen peroxide activity in the abscence of ALR and DTT, at dose Measured in Biochemical System Using Plate Reader – 2036-03_Inhibitor_Dose_CherryPick_Activity | 2462 | 362 | Confirmatory |

activity distribution histogram measured as % inhibition
Now, the two confirmatory assays will be used to remove artefacts:
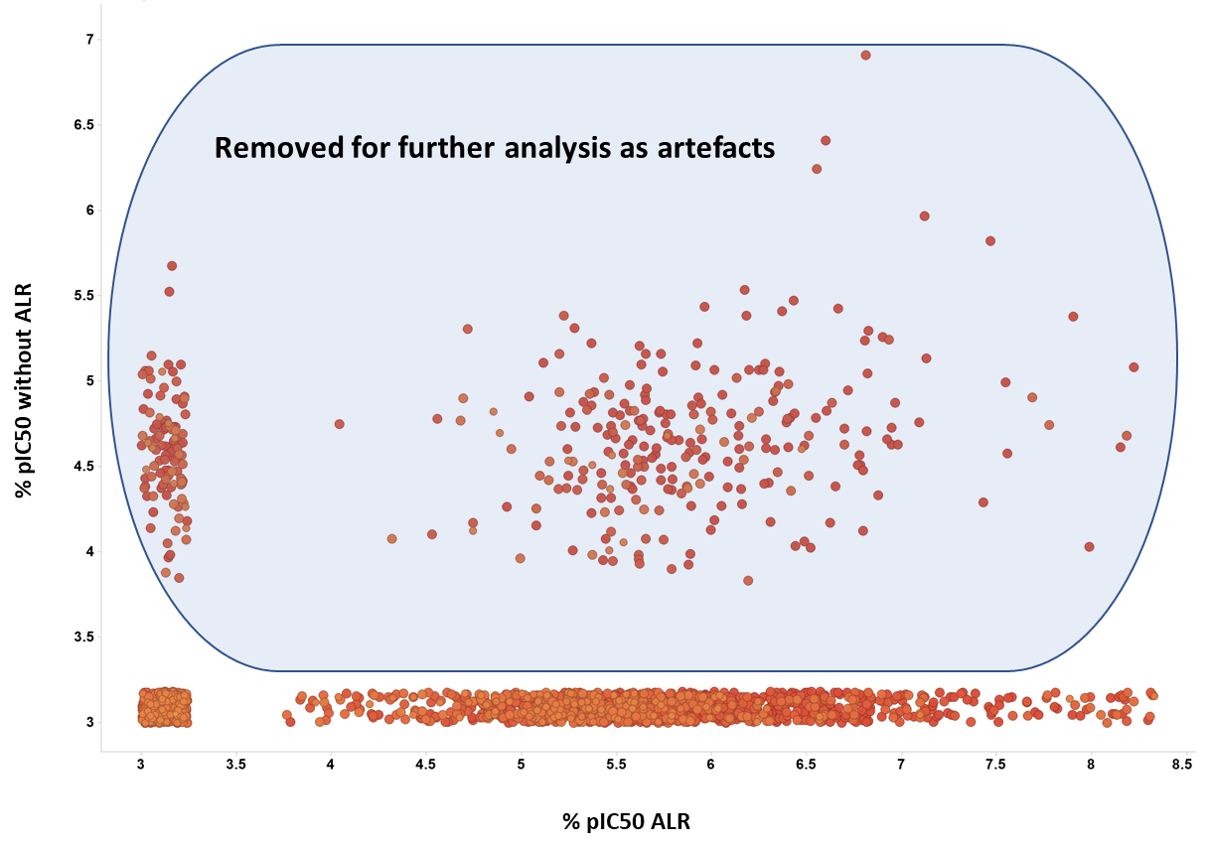
Comparison of confirmartory assays in the presence and absence of ALR.
Given that the single concentration assay returns many thousands of active molecules and only 2400 have been progressed to confirmatory full curve assays, the % inhibition is log transformed, inverting the logistic equation, to generate a ALR inhibition score and an ALR enhancing score.
Calculation of ALR scores for inhibitors and enhancers.
Final ALR scores are generated by a conditional function that uses full curve results when they exist, and the log transformation from single concentration % inhibition data when they don’t.
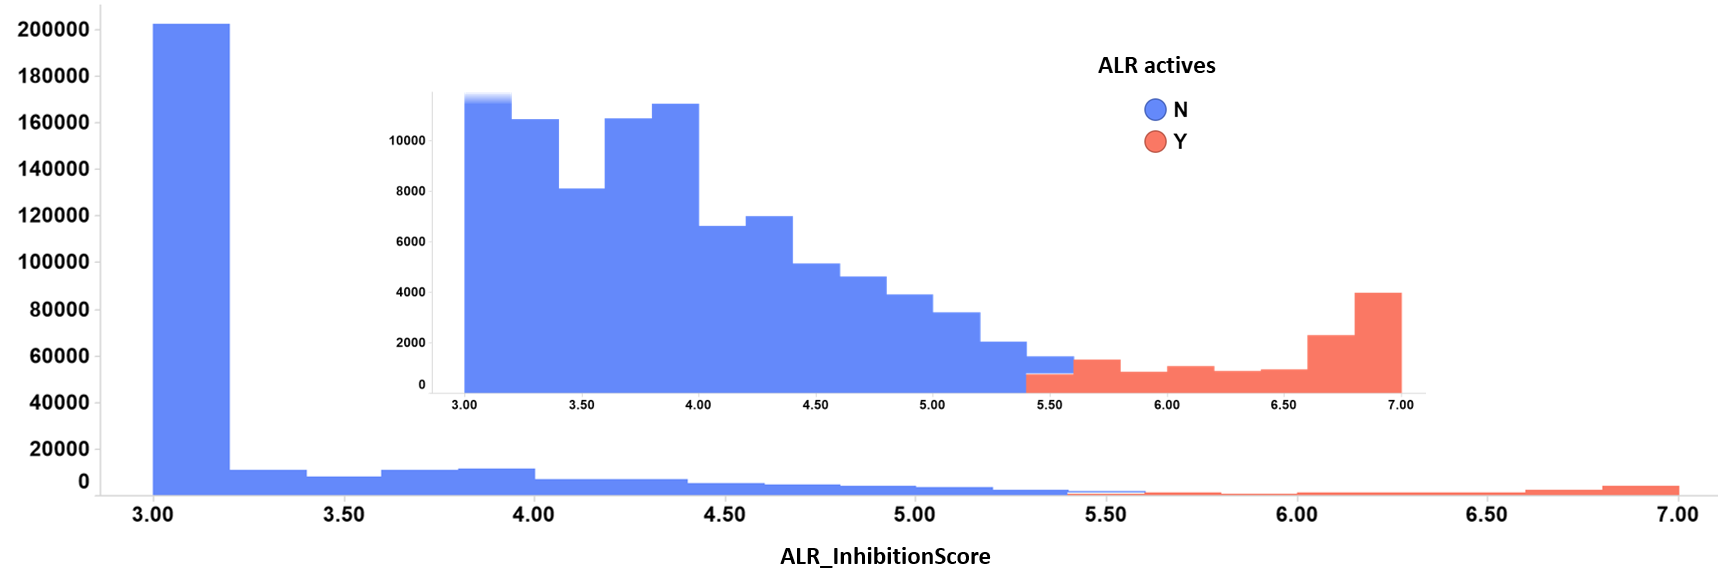
ALR inhibitionScore distribution histogram. Zoom on most actives.
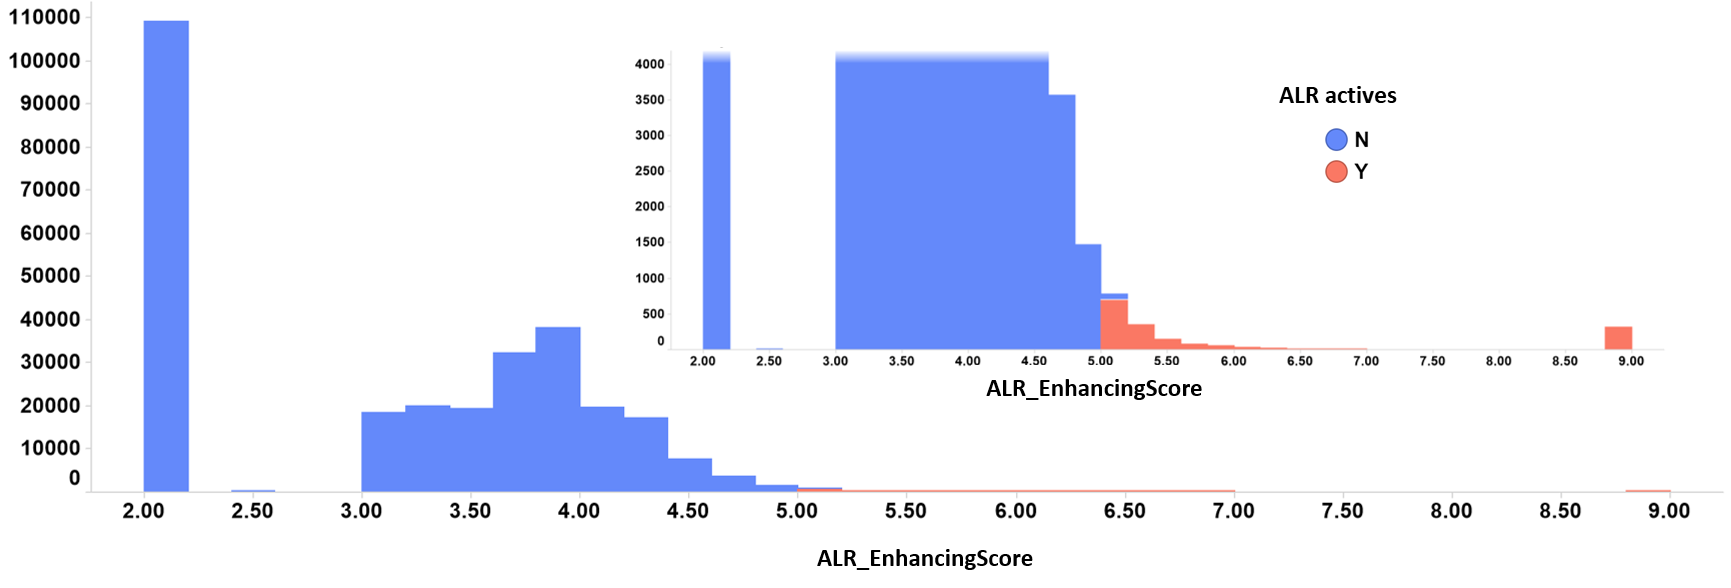
ALR enhancing Score distribution histogram. Zoom on most actives.
To build the machine learning table, we need to know what these 280k molecules have done in the rest of the DB. And we find thart there are 750k additional records from 50k different experimental protocols carried out on more than 3k targets. Below, a barchart displaying the experiments occurrence in the ML table we have created for modelling:
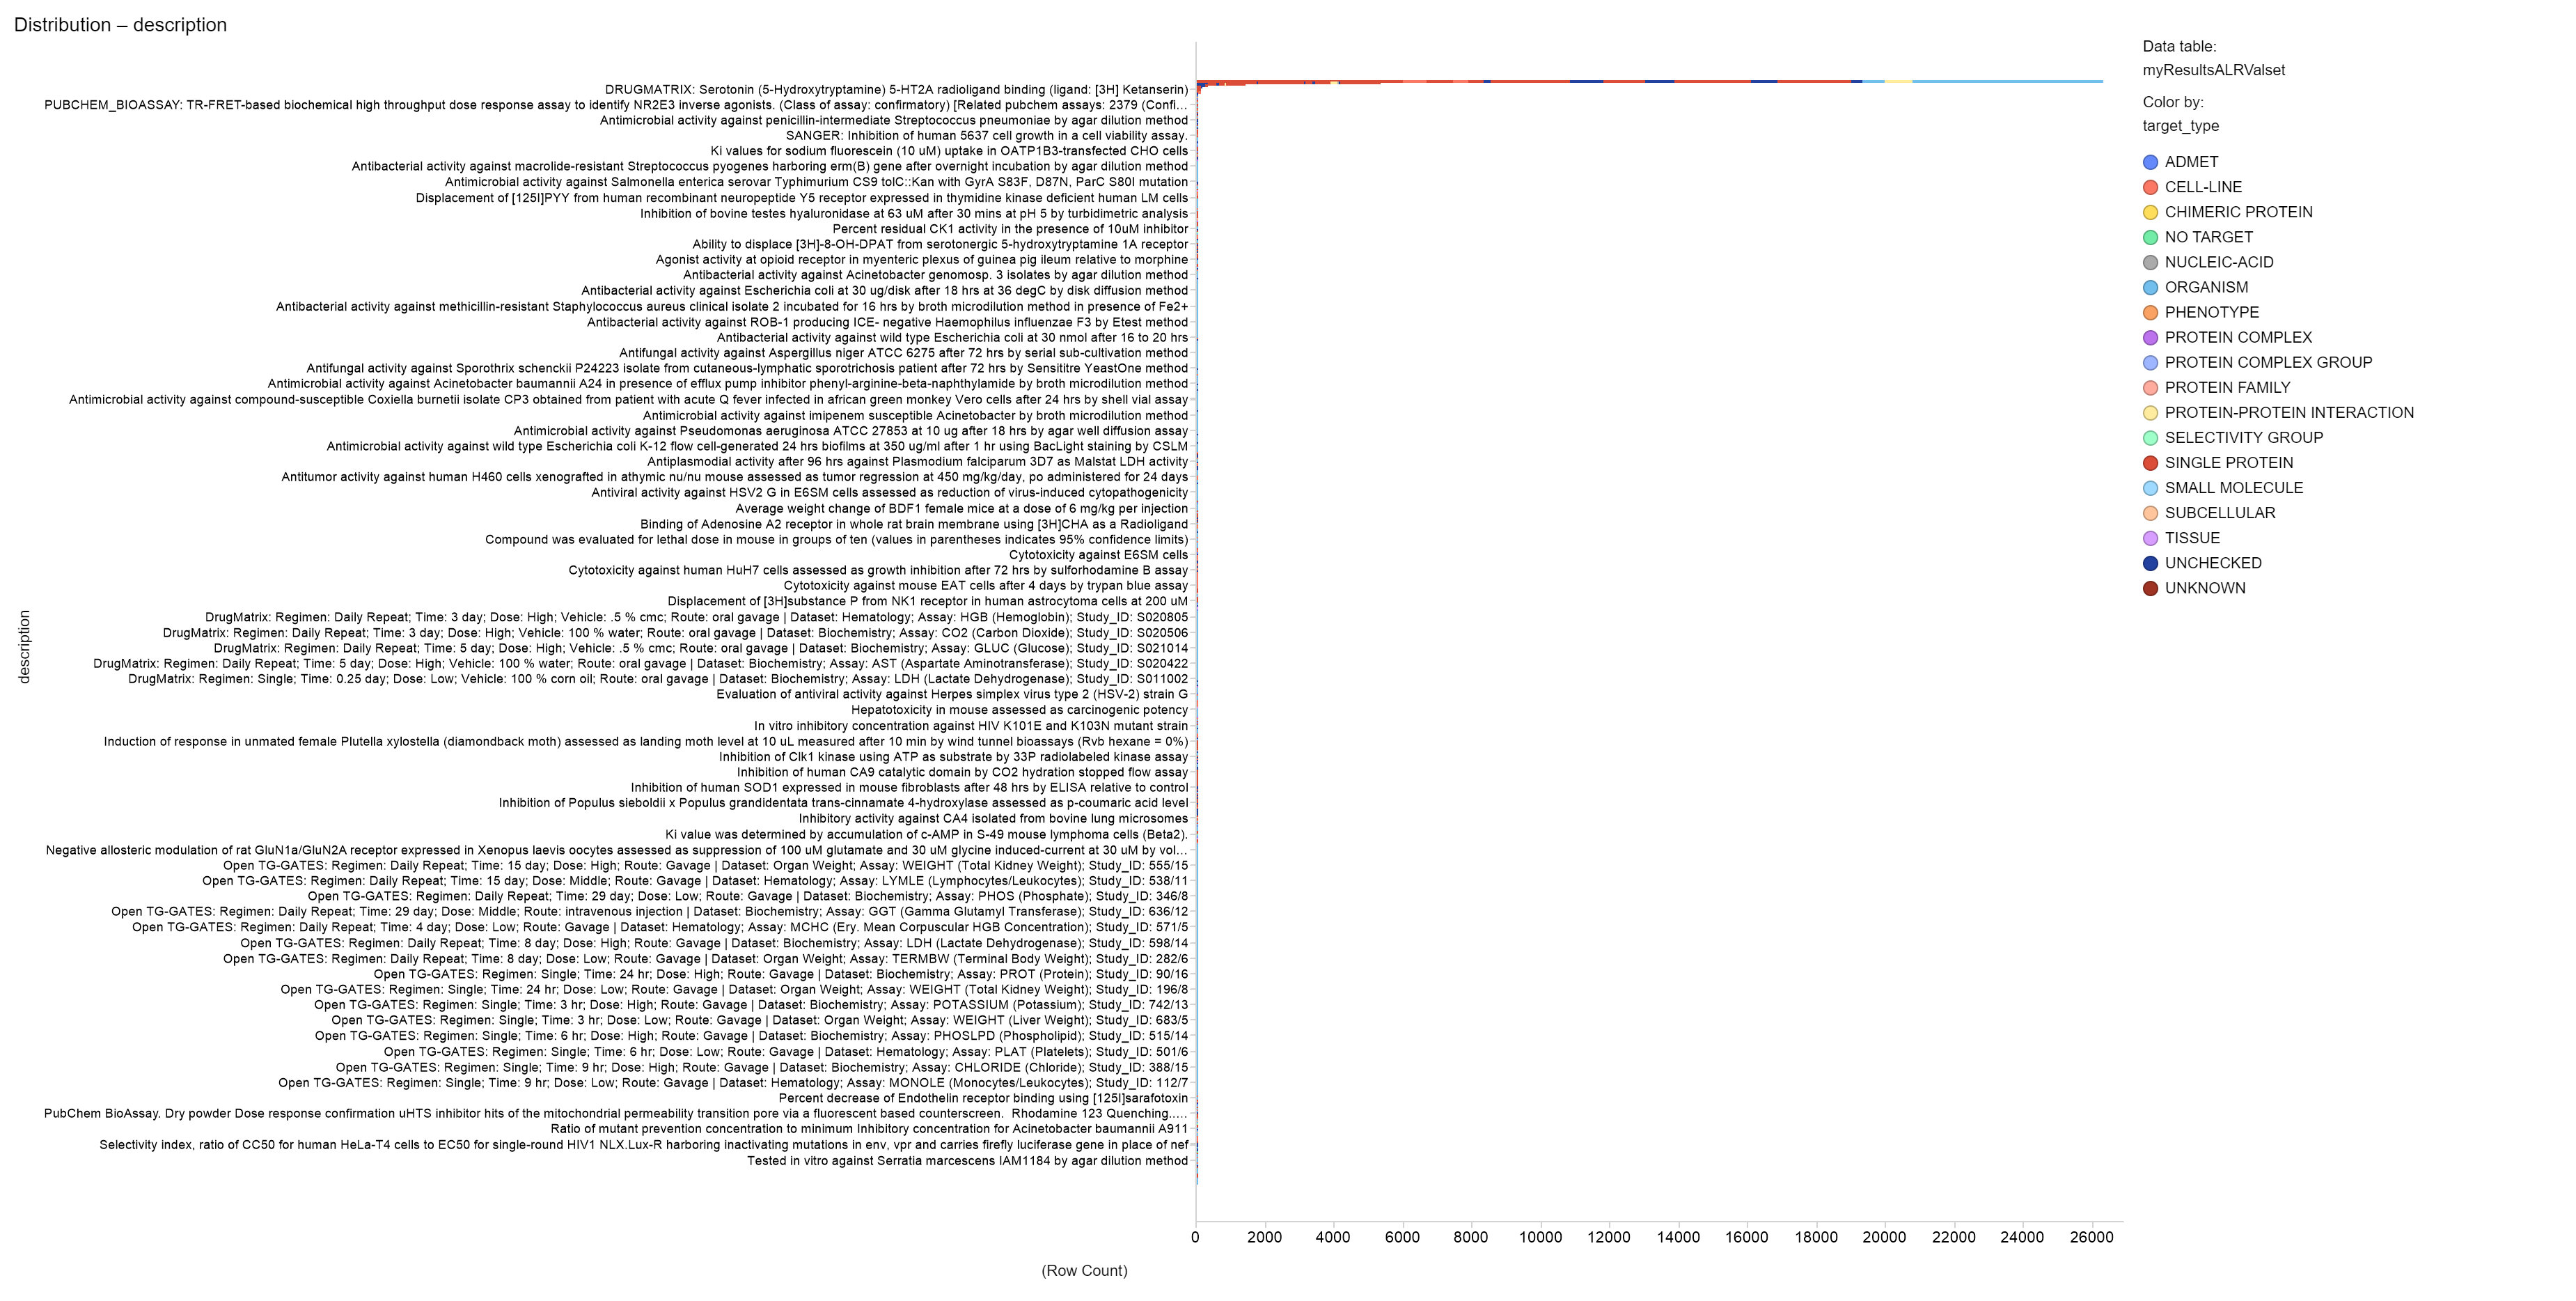
All assays barchart.
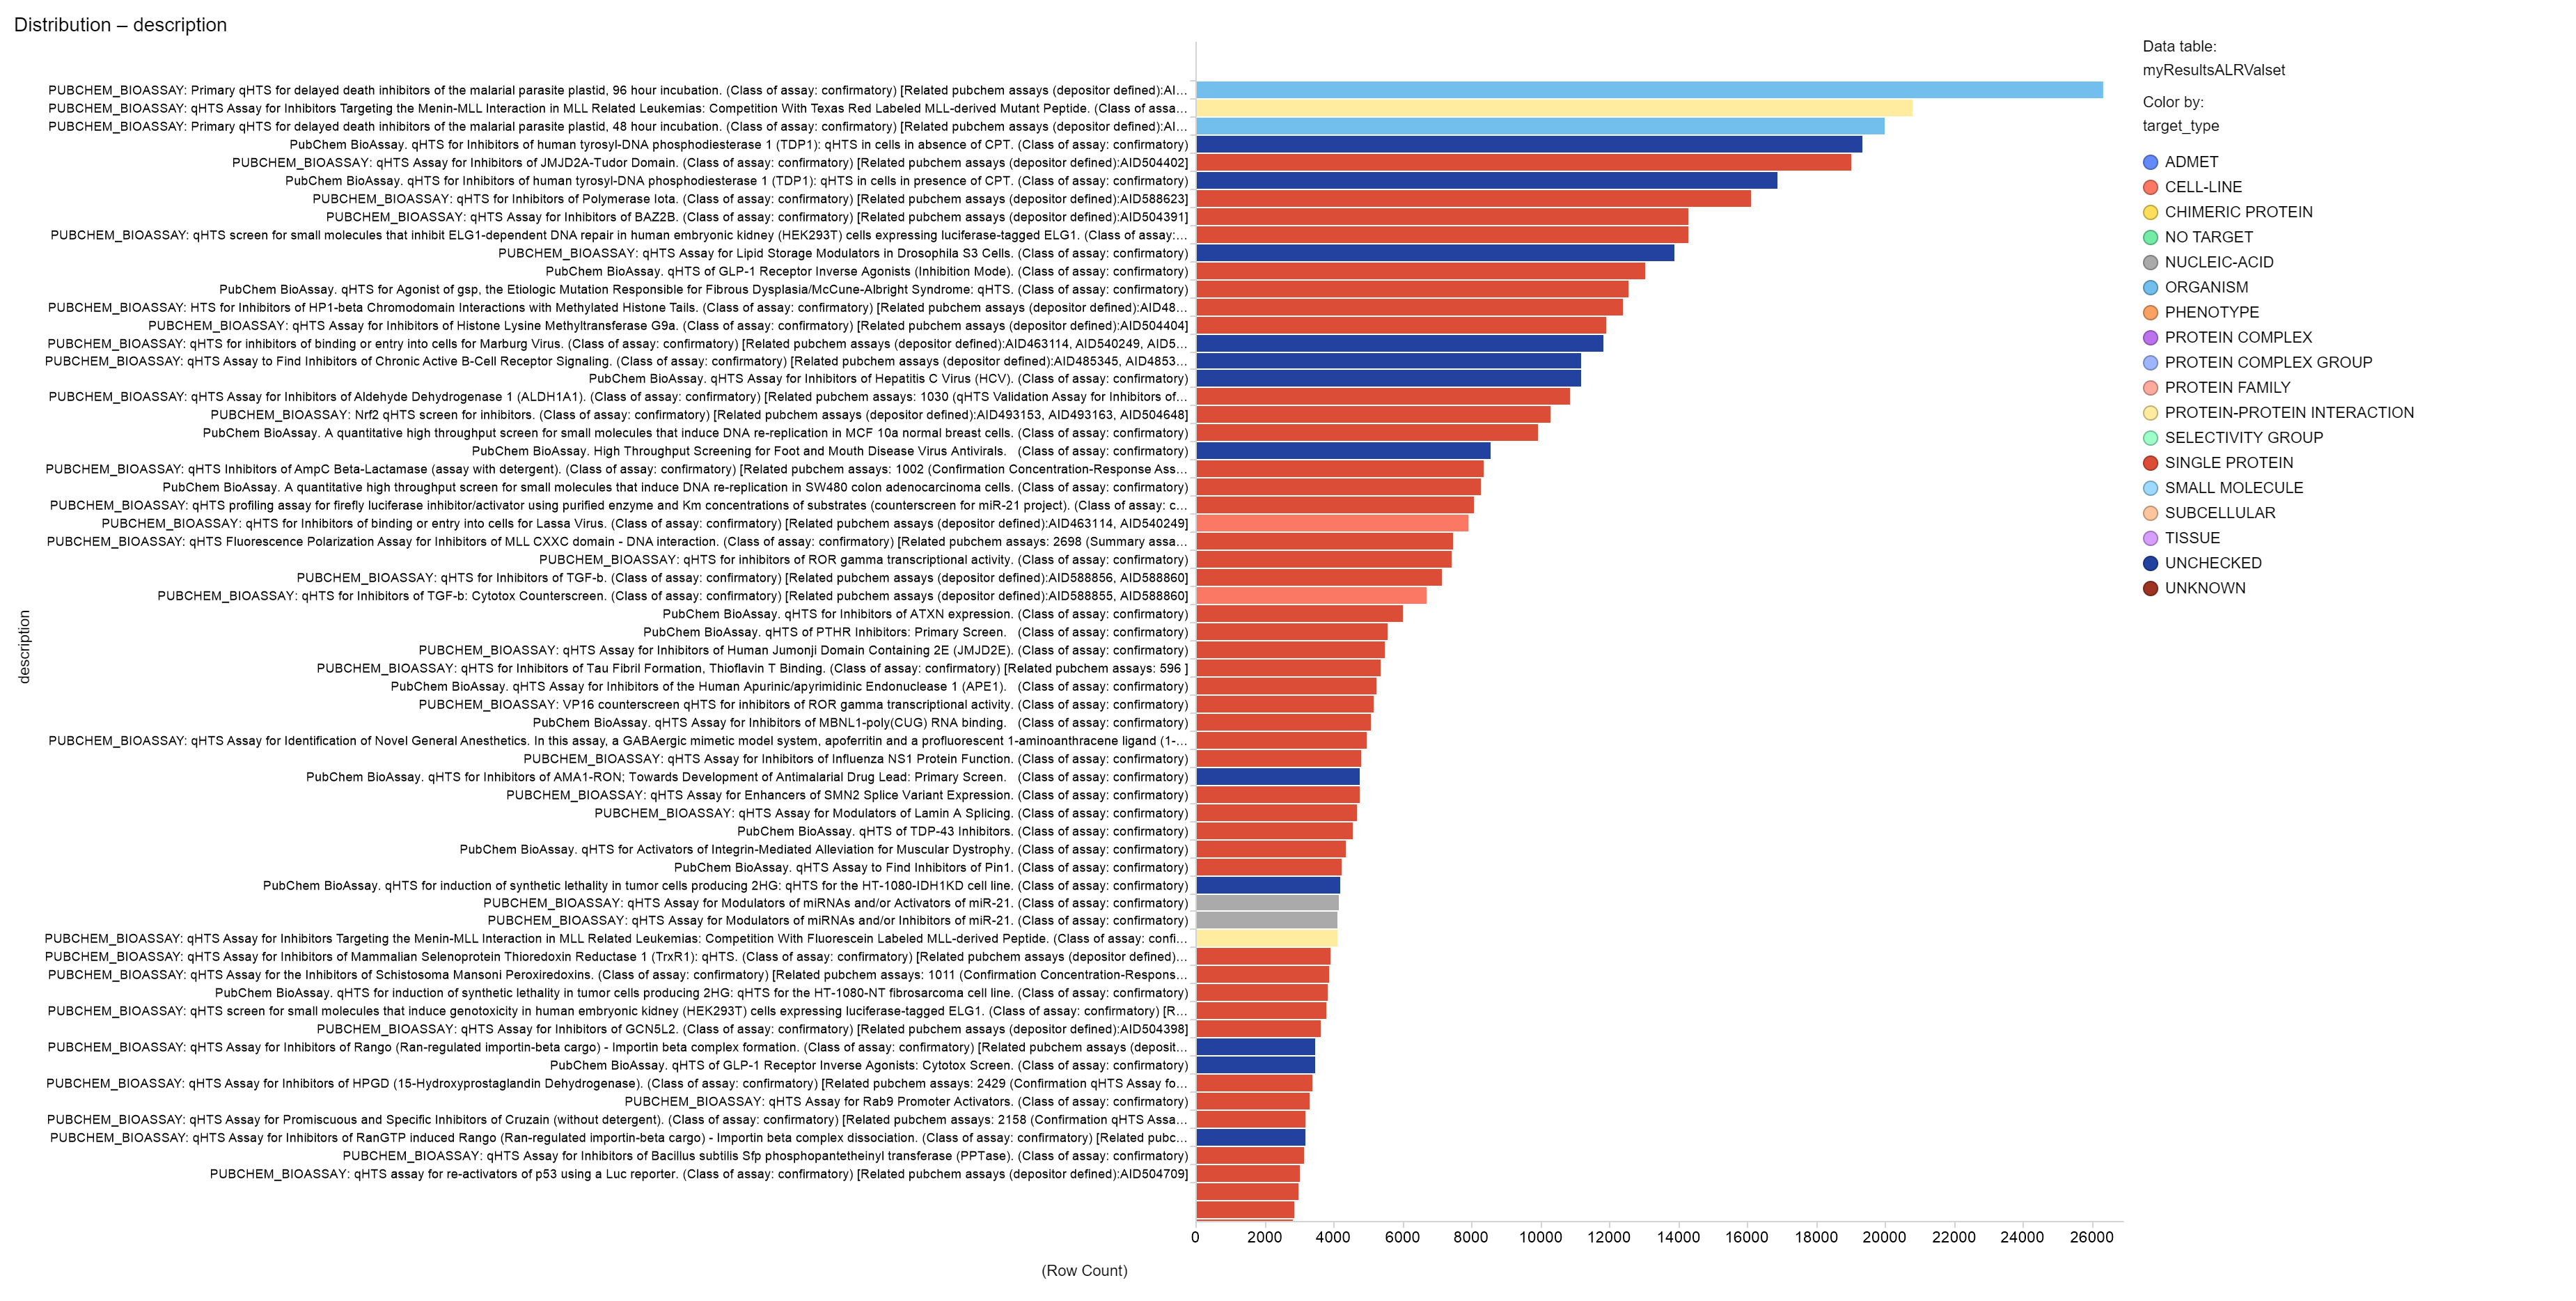
Assays with higher occurrence.
Evaluation of ALR Activity Predictive Models
For model evaluation, data have been splitted in validation and test sets The validation set has been labelled for classification and regression and used to generate the model. The test set is tested against the model and the predictions compared to the previously hidden activity columns. Accuracy of predictions is then assessed by the classical machine learning evaluation parameters in the charts below.
Random forest classifier results as the best predictor for the ALR validation set. NB classifiers provide a very high false positives rate and have been discarded. The random forest regression trends to underestimate potency for less potent compounds in particular, but despite this condition, it is still a valid predictor and, combined with a RF classifier, shows a small population in the false positives zone. Predictors are calculated for eack row in the validation set. When prediction is aggregated by compound, classification systems return the countRatio (the ratio between number of events a compound has been classified as active and total events per compound), regression systems return the average of the predicted value.
Confusion matrix for ALR inhibitors random forest classifier.
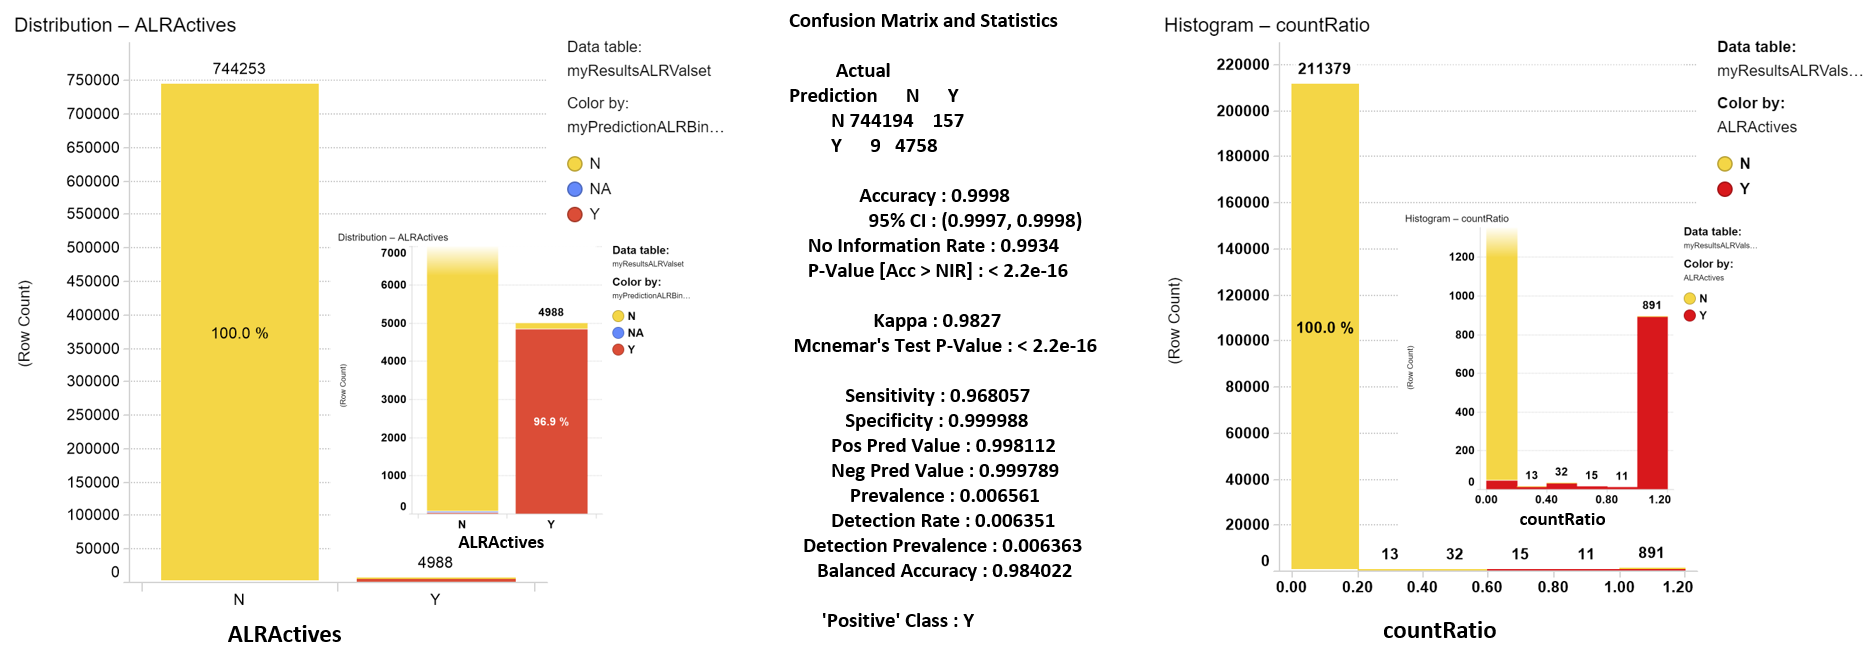
Left: Confussion matrix bar chart. Each bar represents the true actives. Predicted as active items in red. Predicted as inactive in yellow. The inset shows the bottom of the chart zoomed to better visualize the proportion of truly predicted actives. Center: Statistical indexes from R pakage. Right: CountRatio distribution histogram for predictions aggregated by compound. Colors indicate whether the compounds are true actives (red) or not (yellow).
Confusion matrix for ALR enhancers random forest classifier.
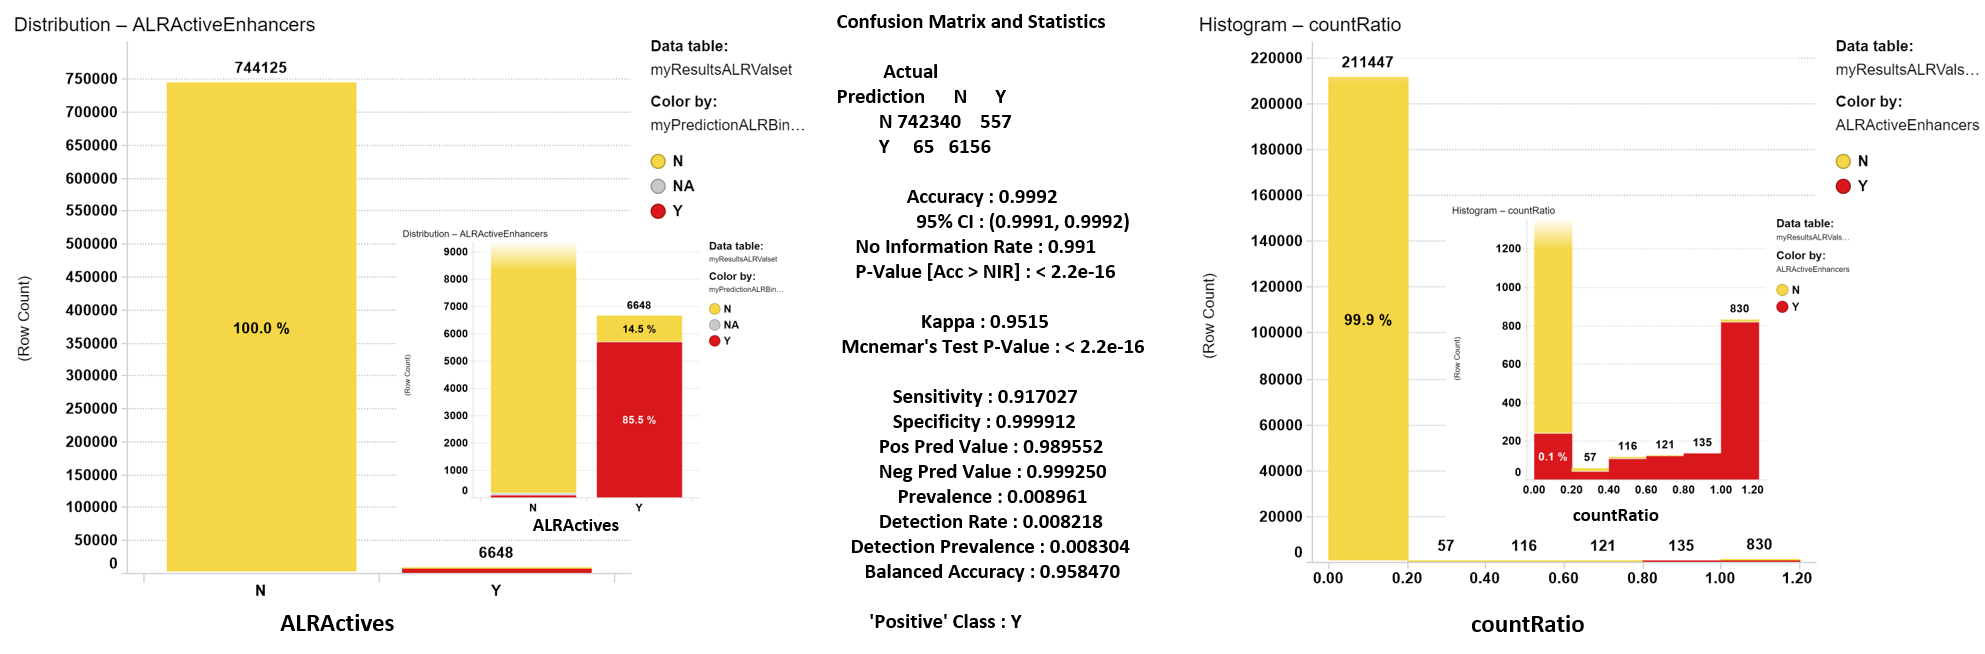
Left: Confussion matrix bar chart. Each bar represents the true actives. Predicted as active items in red. Predicted as inactive in yellow. The inset shows the bottom of the chart zoomed to better visualize the proportion of truly predicted actives. Center: Statistical indexes from R pakage. Right: CountRatio distribution histogram for predictions aggregated by compound. Colors indicate whether the compounds are true actives (red) or not (yellow).
Evaluation of random forest regression model for ALR inhibitors and a combined parameter from classification and regression predictions.
Although regression models result in an acceptable correlation between true and predicted values when above the activity cutoff, the false positives rate would load the prediction upon the ChEMBL dataset with an unmanageable number of hits. The generation of a parameter combining countRatio with predicted score from regression (ALRInhibitionCombinedPrediction) largely decreases the number of false positives with a small increase in the false negatives rate.
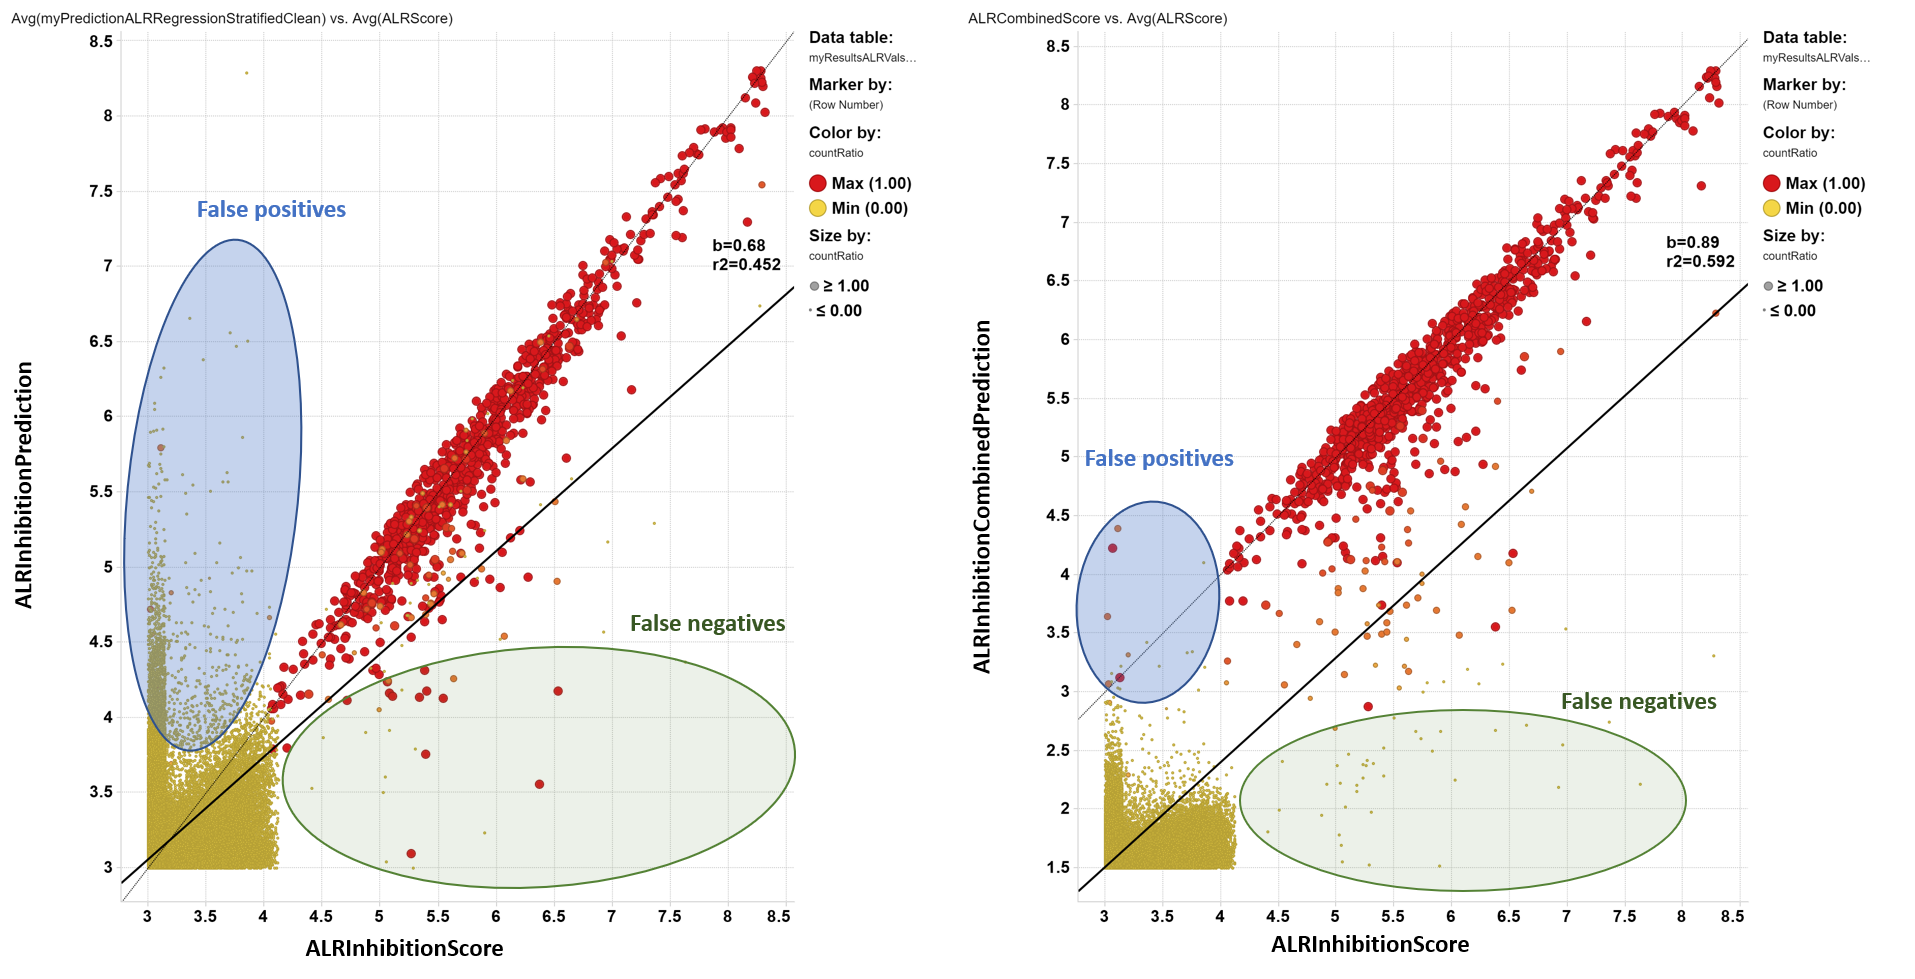
left: Correlation between true inhibition and prediction from regression. right: Correlation between true inhibition and a combined parameter built from regression and classification predictions. Color and size by countRatio.
Evaluation of random forest regression model for ALR enhancers and a combined parameter from classification and regression predictions.
Although regression models result in an acceptable correlation between true and predicted values when above the activity cutoff, the false positives rate would load the prediction upon the ChEMBL dataset with an unmanageable number of hits. The generation of a parameter combining countRatio with predicted score from regression (ALREnhancingCombinedPrediction) largely decreases the number of false positives with a small increase in the false negatives rate.
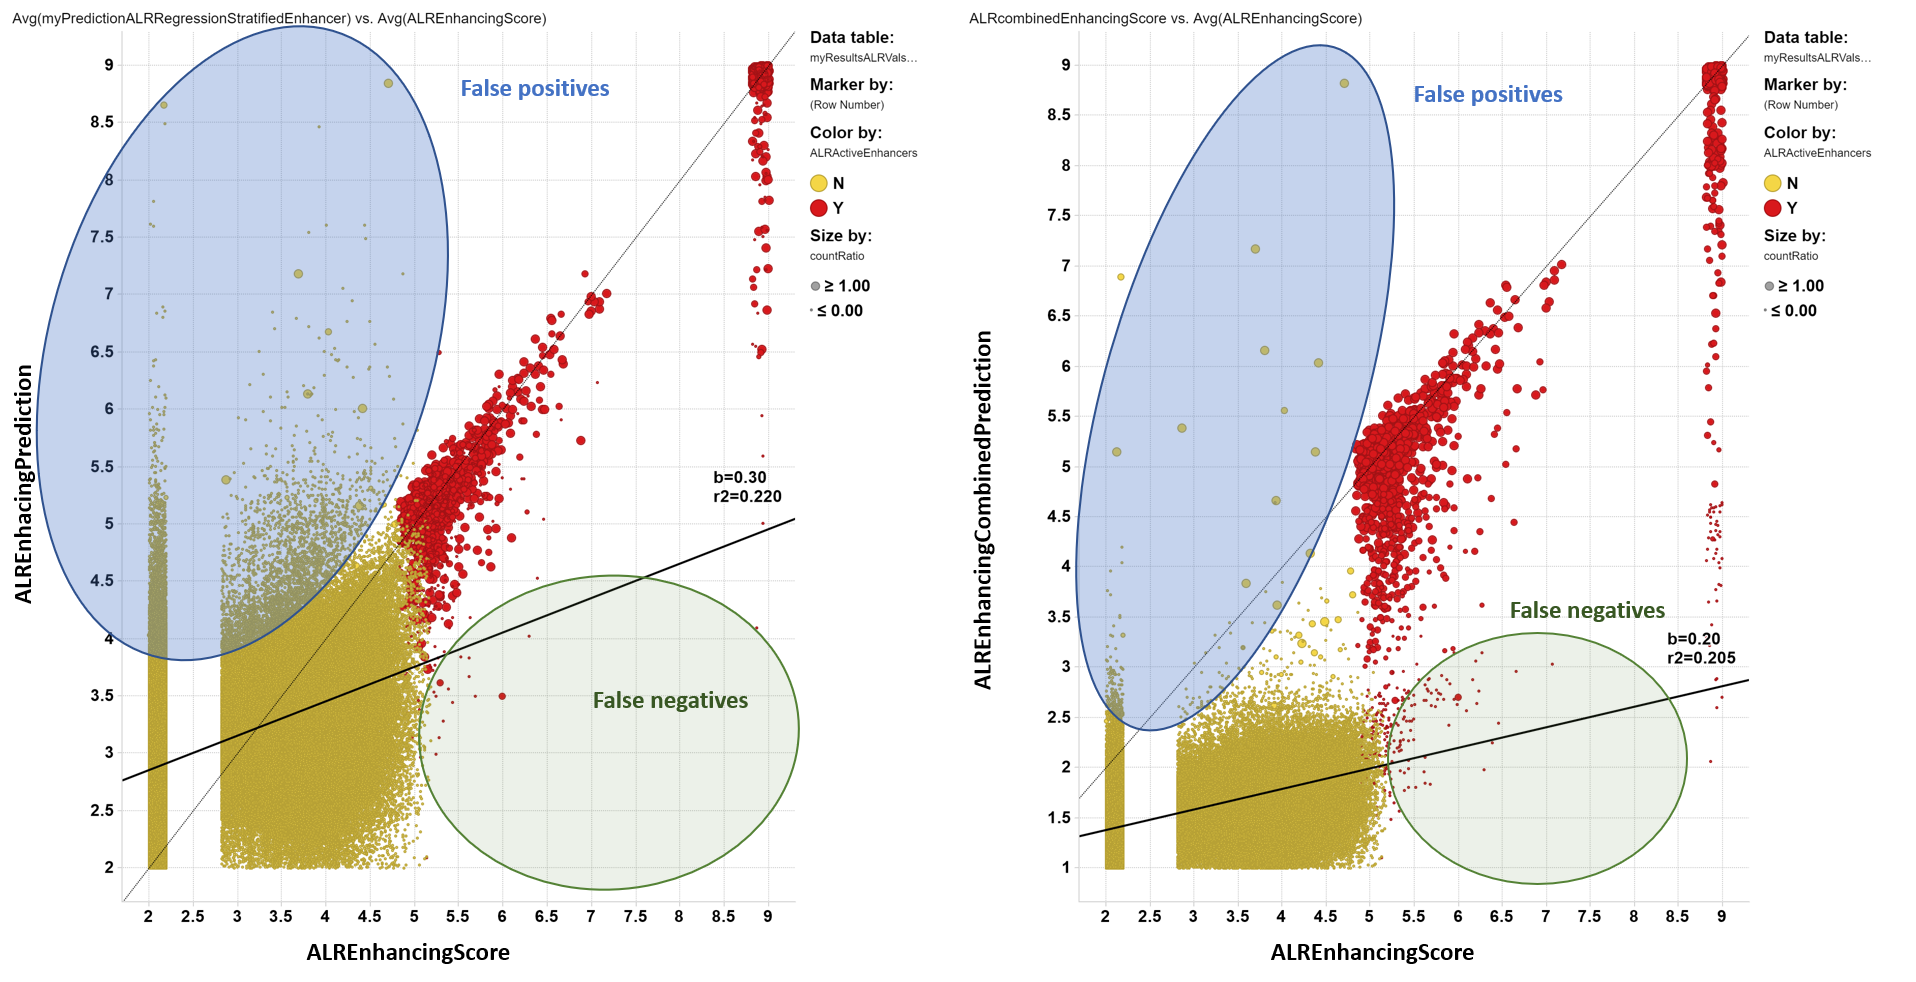
Left: Correlation between true enhancement and prediction from regression. Right: Correlation between true enhancement and a combined parameter built from regression and classification predictions. Color and size by countRatio.
Prediction scores distribution histograms.
Attending to the ability to separate active from inactive compounds in a predicted sample population, the combined score shows much better performance, so it will be the one to be applied to the whole ChEMBL dataset.
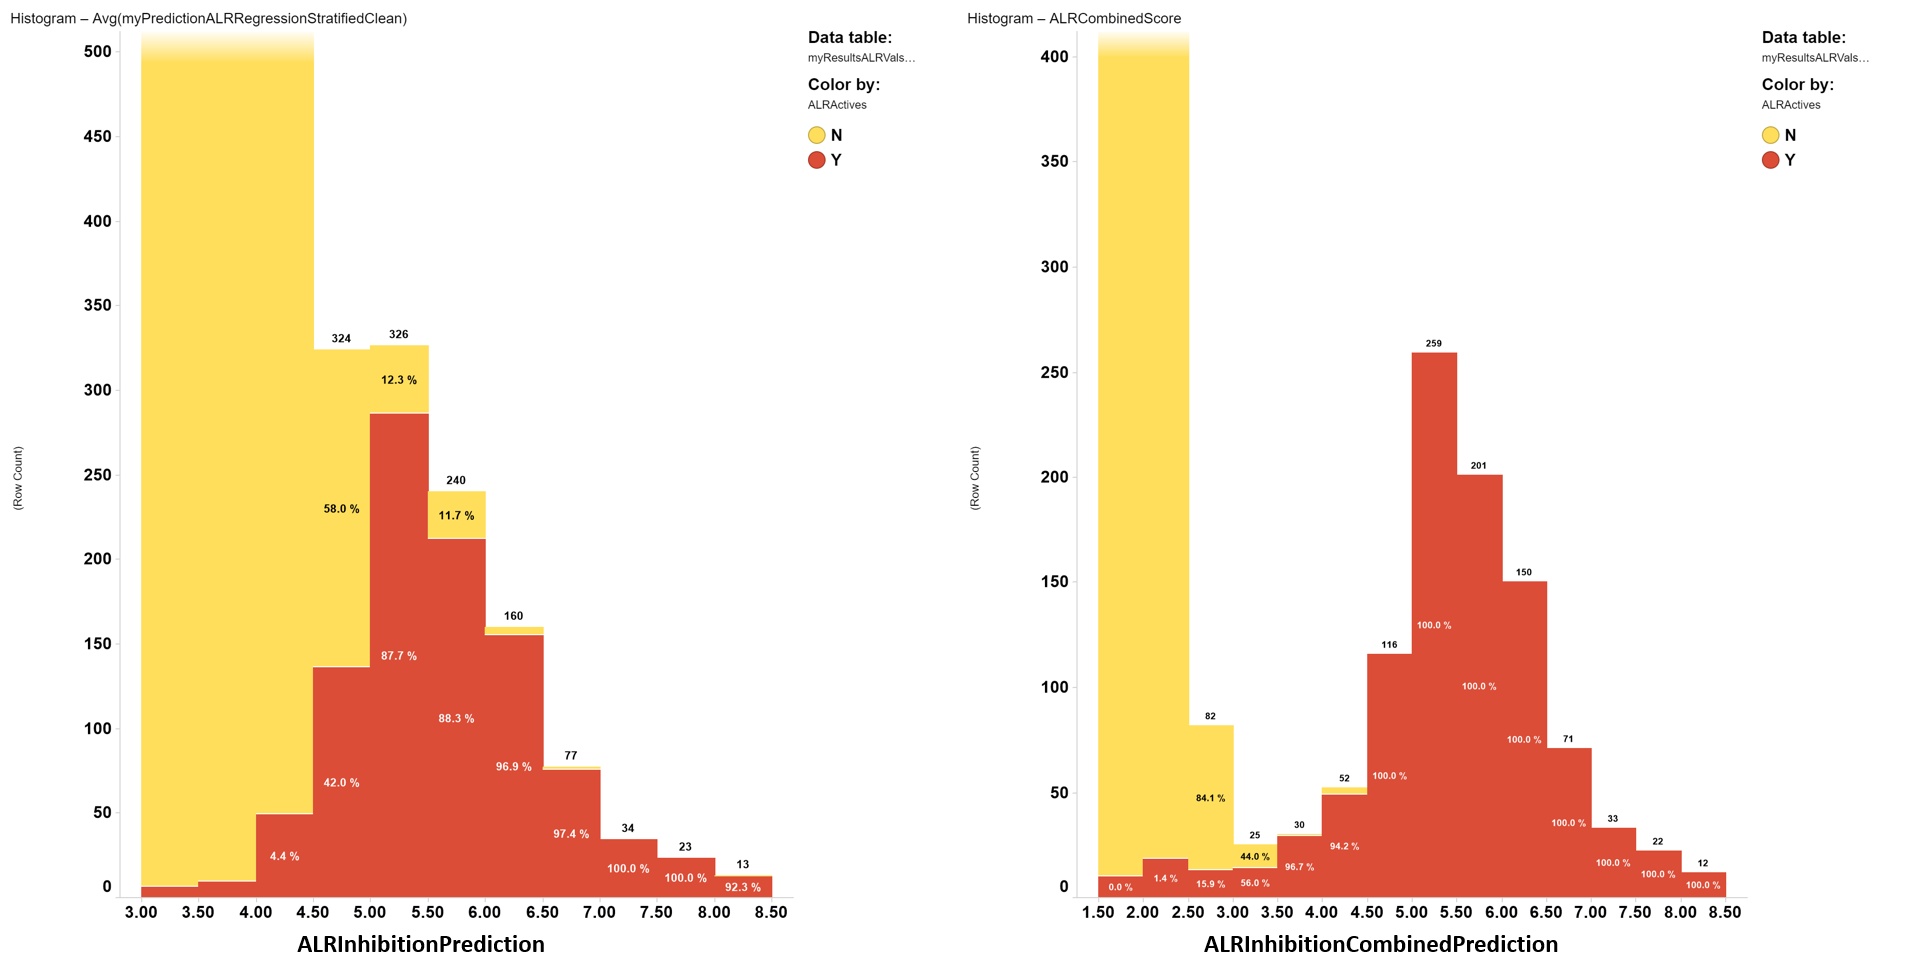
Predicted inhibition score distribution histograms for simple regression (left) and a combined index from classification and regression predictions (right). Red bar segments: true actives. Yellow bar segments: true inactives.
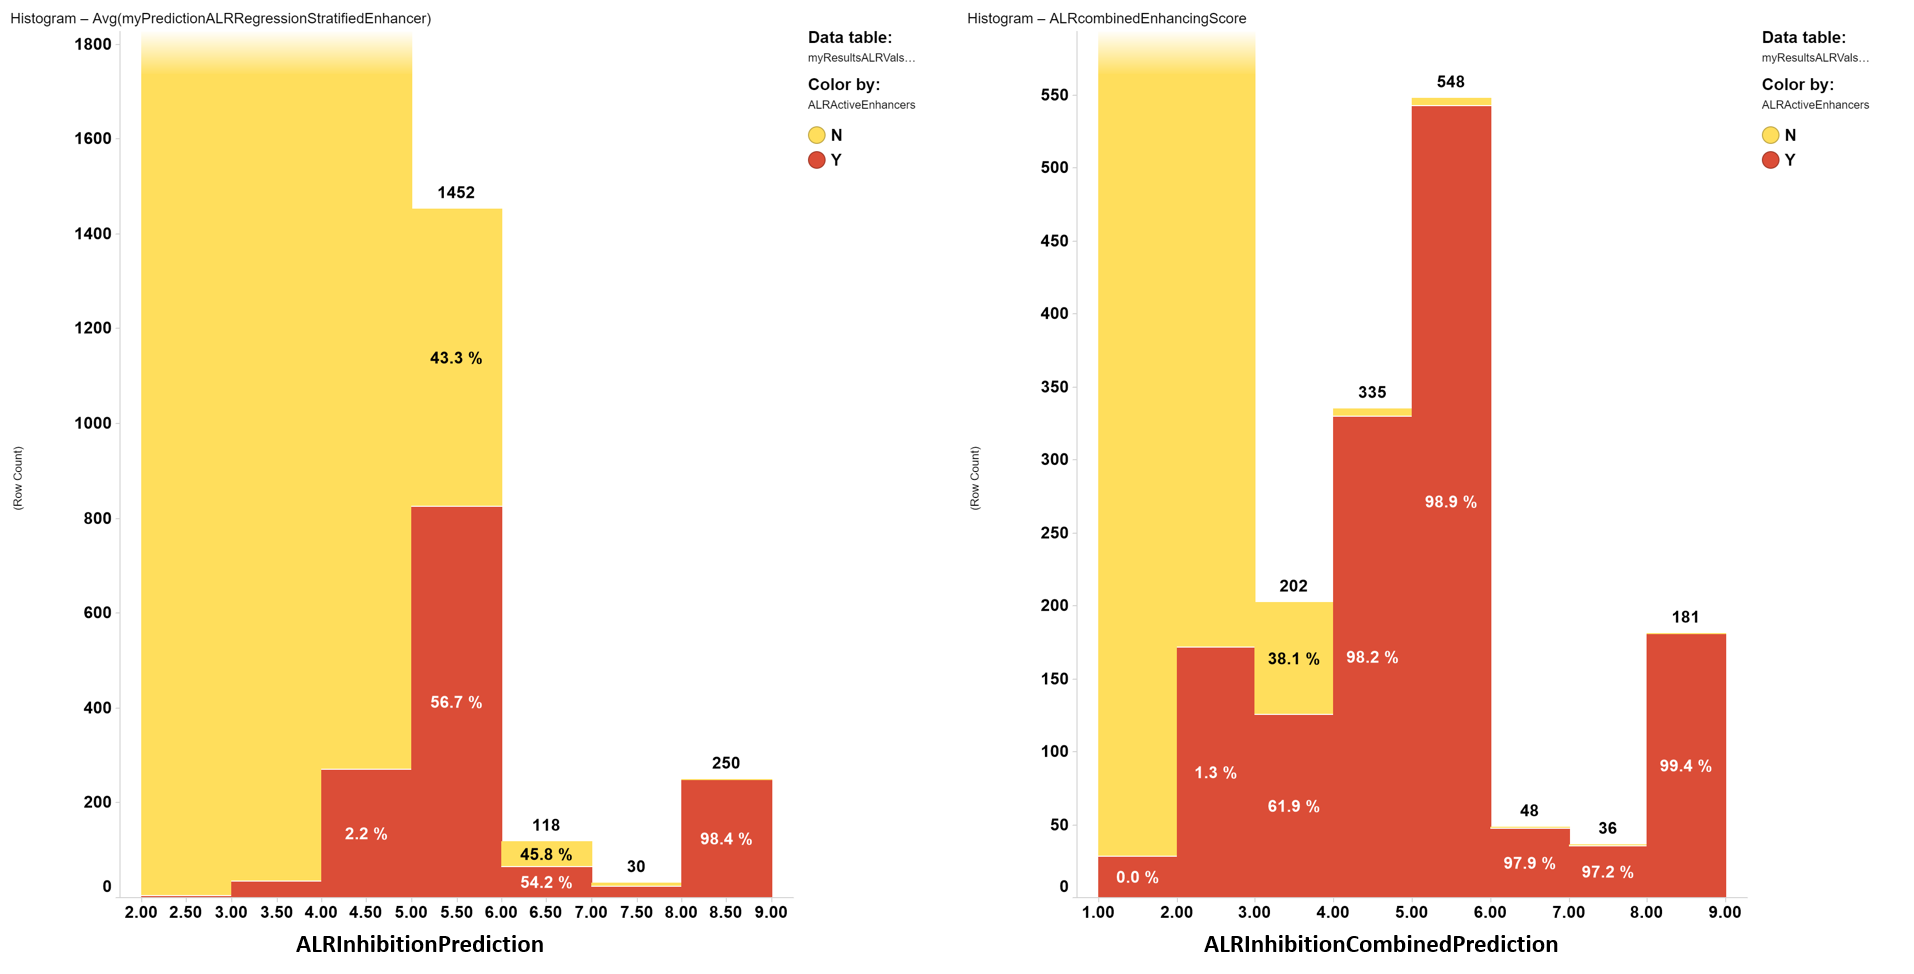
Predicted enhancing score distribution histograms for simple regression (left) and a combined index from classification and regression predictions (right). Red bar segments: true actives. Yellow bar segments: true inactives.
Selection of active compounds.
The application of predictive algorithms to the ChEMBL data base results in the identification of more than 100k active compounds. In this page, we describe the activity profile of the most potent 11k ALR enhancers and 10k ALR inhibitors. See histograms below. Click here for download.
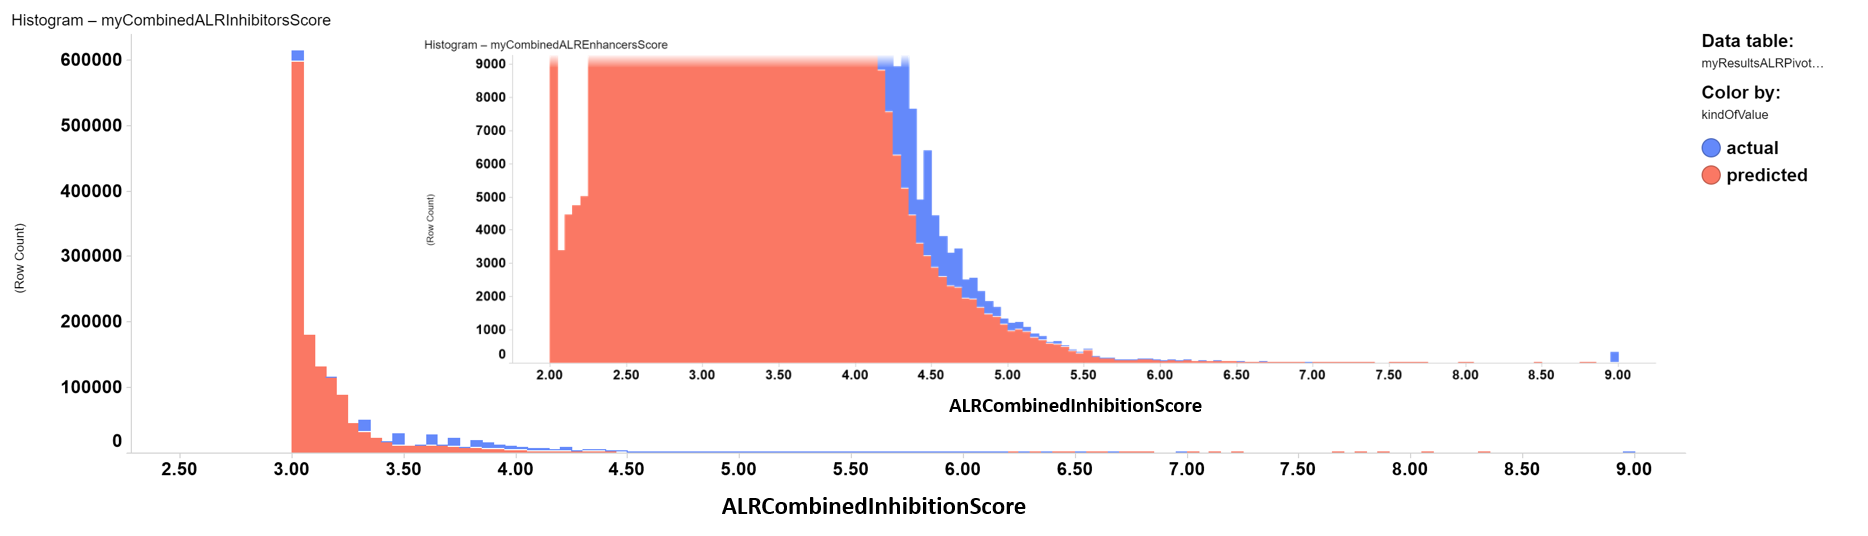
ALR inhibitors distribution histogram. Color by kind of value. Inset: zoom into the highest inhibition score values.
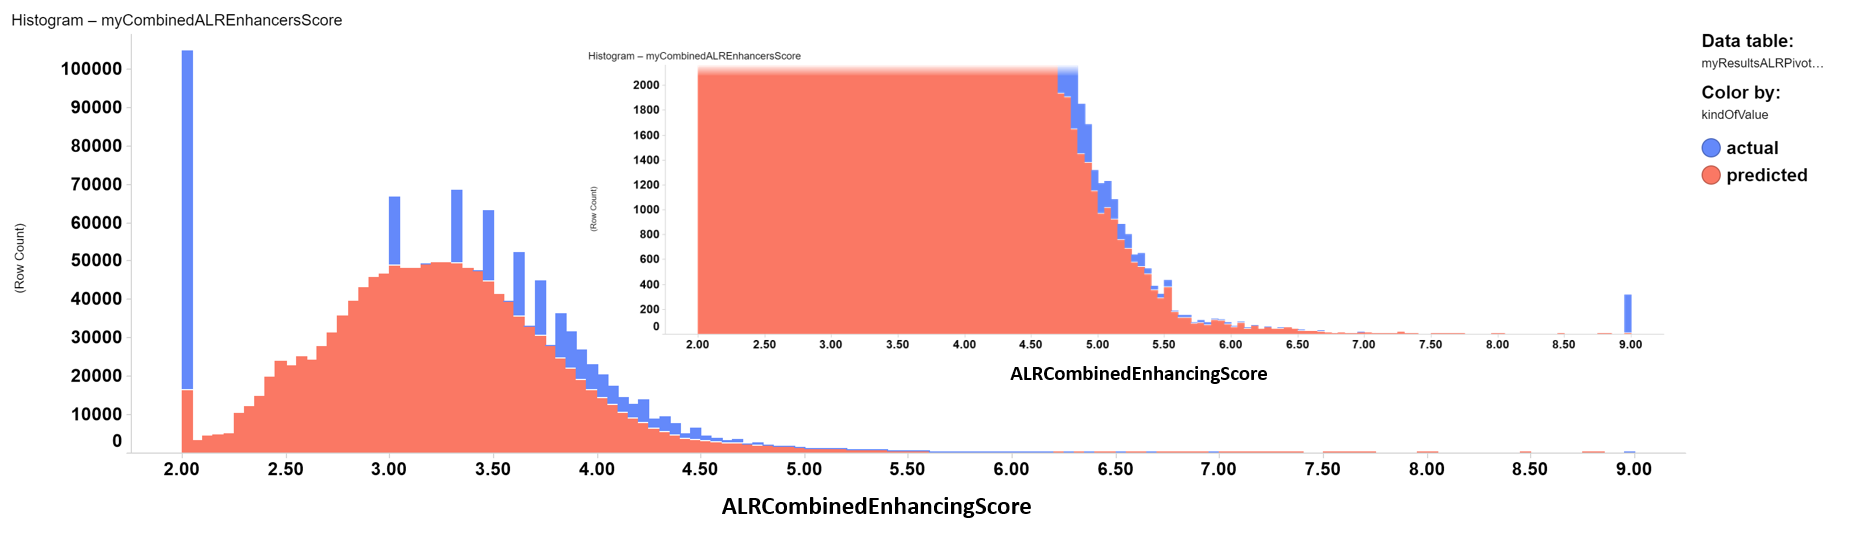
ALR enhancers distribution histogram. Color by kind of value. Inset: zoom into the highest enhancing score values.
Active compounds can be chemically clustered using tools like ChemmineR, or DataWarrior ro identify scaffolds with higher potential.

Cluster selection panel for inhibitors. Left plot represents the averave score for inhibitiors vs the number of molecules in each cluster. Right graph shows the statistics of the clusters selected in the left chart.
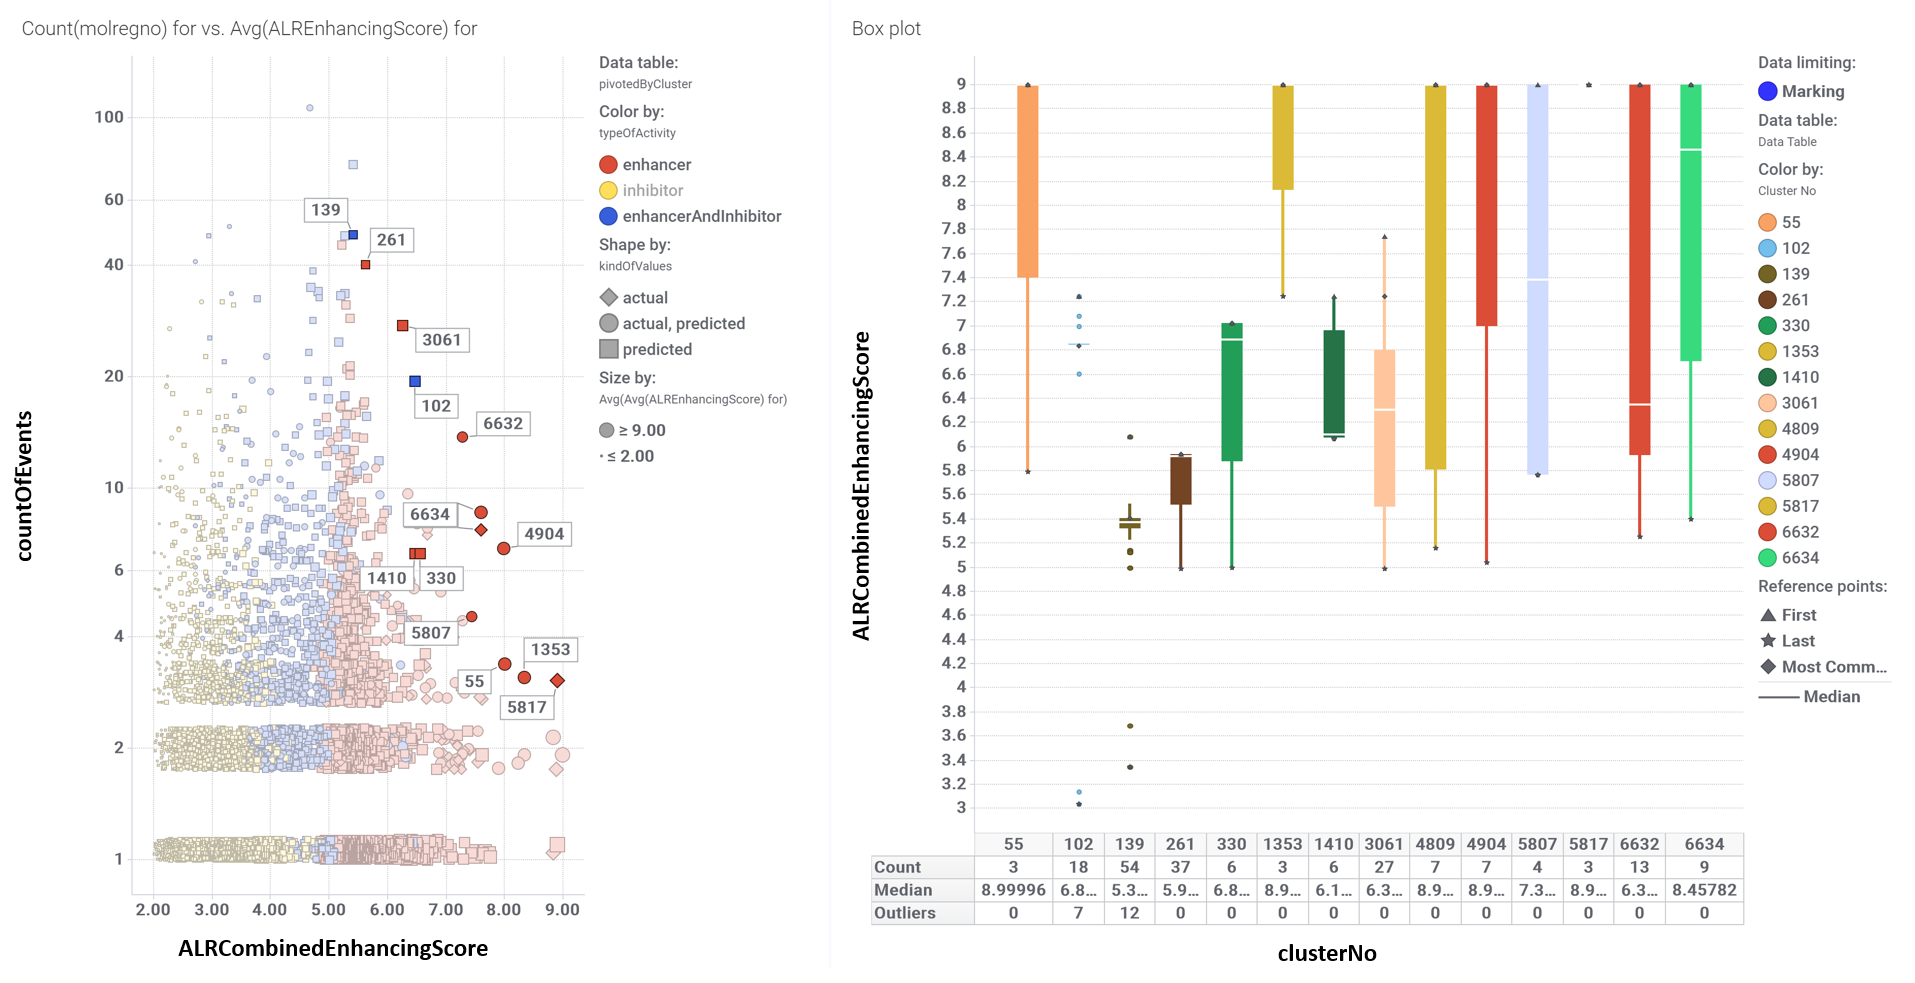
Cluster selection panel for enhancers. Left plot represents the averave score for enhancers vs the number of molecules in each cluster. Right graph shows the statistics of the clusters selected in the left chart.
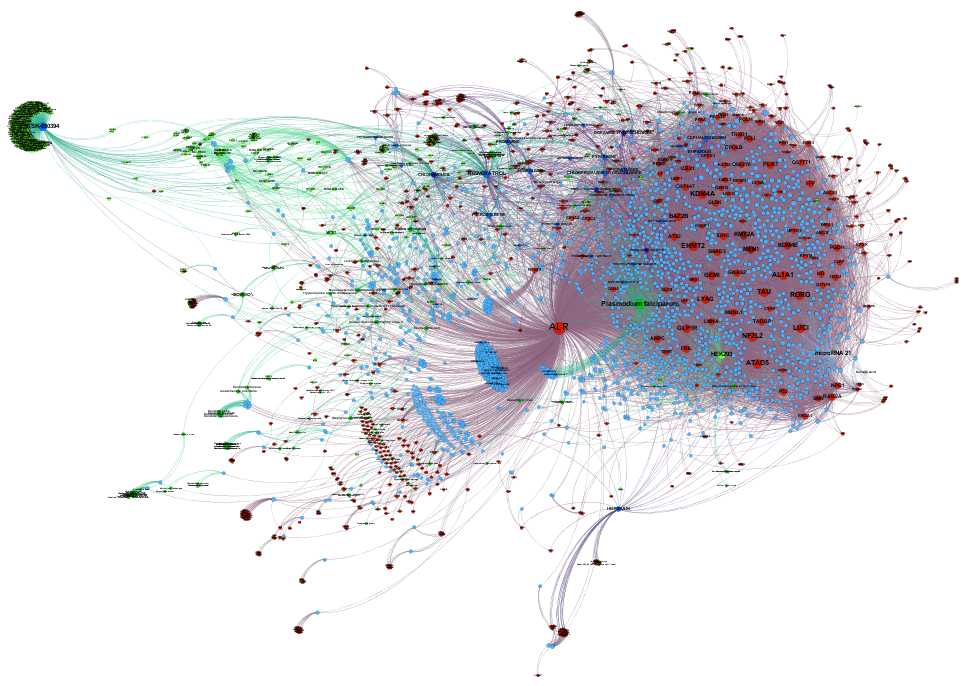
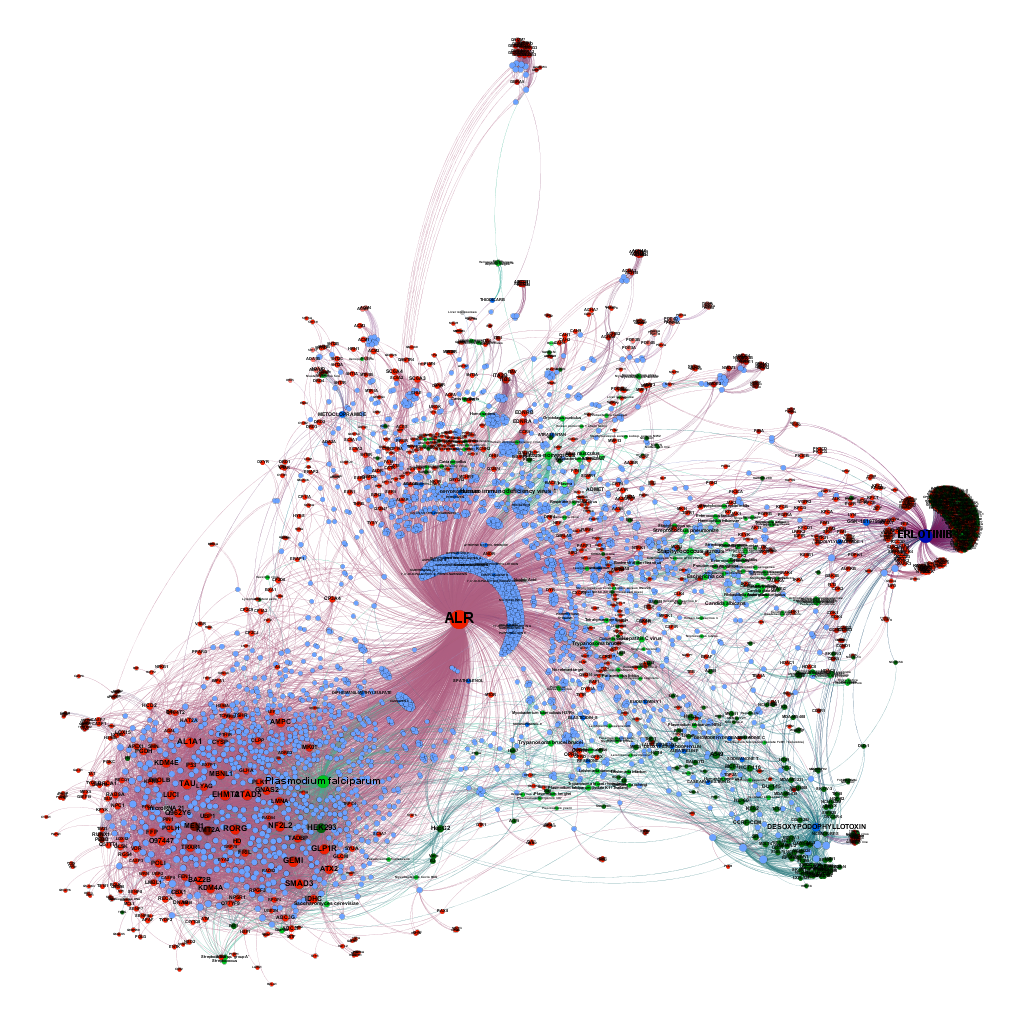
The ChEMBL DB contains several hundred thousand records of these 21k ALR compounds in several phenotypic or protein based assays. Once removed interactions considered as inactive, 97k relevant interactions with cell lines, organisms, tissues and proteins remain. We can use this information to build graphs and calculate centrality measures (degree, betweenness, pageRank, etc) and compare them to ALR potency. Centrality informs us about other properties beyond potency at ALR, like promiscuity of the molecules, importance of particular phenotypes, and cross reactivity with other protein targets. Thus, topologic properties are a measure of the role of each node within the entire network. Below, you can see graph and scatter plot views of the networks for ALR inhibitors and activators. Scatter plots show the degree parameter as centrality measure corrected by the number of records in the DB to avoid misinterpretation due to over or under representation in the DB compared to ALR inhibition or enhancement scores. A txt file with all interactions can be downloades from the ALR downloads page.
Relevant interactions of ALR inhibitors. Molecules are represented ibn blue colors (drugs darker), protein targets are red, and live cells tissues and organisms have been represented in green, darker as complexity increases.
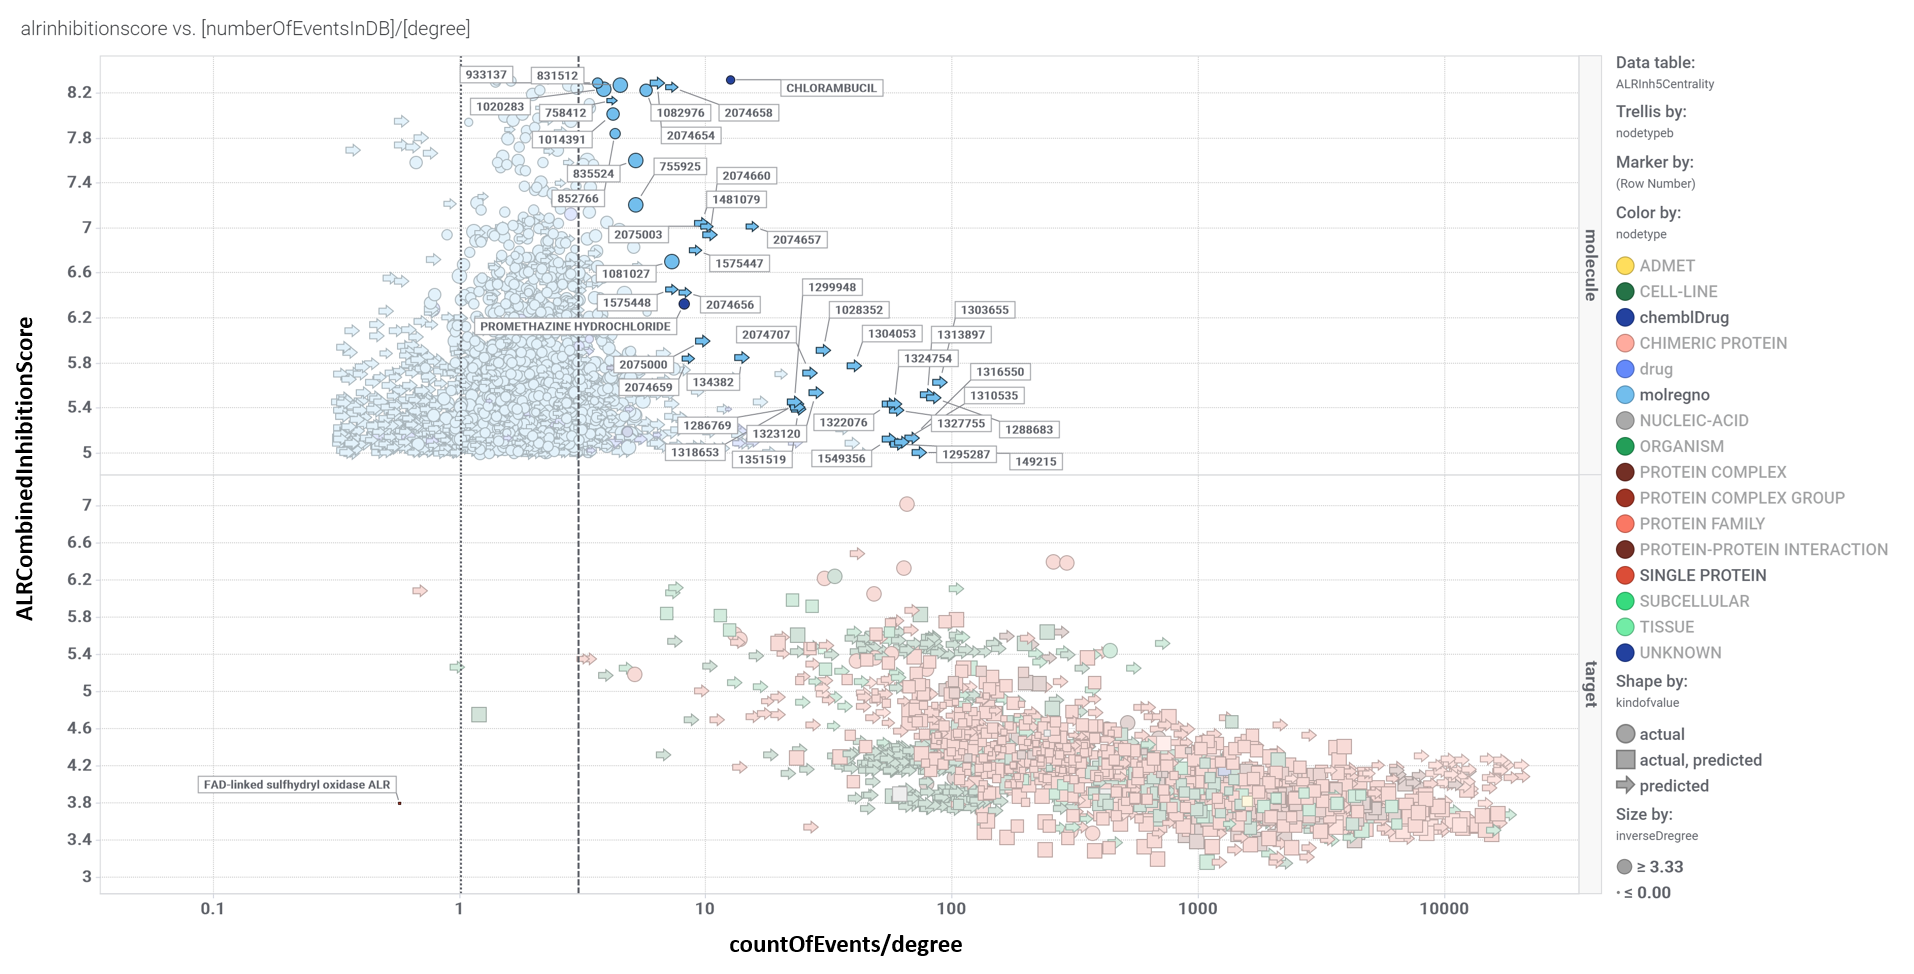
ALR inhibitors score vs degree centrality corrected by occurrence in the ChEMBL DB.
Relevant interactions of ALR enhancers. Molecules are represented ibn blue colors (drugs darker), protein targets are red, and live cells tissues and organisms have been represented in green, darker as complexity increases.
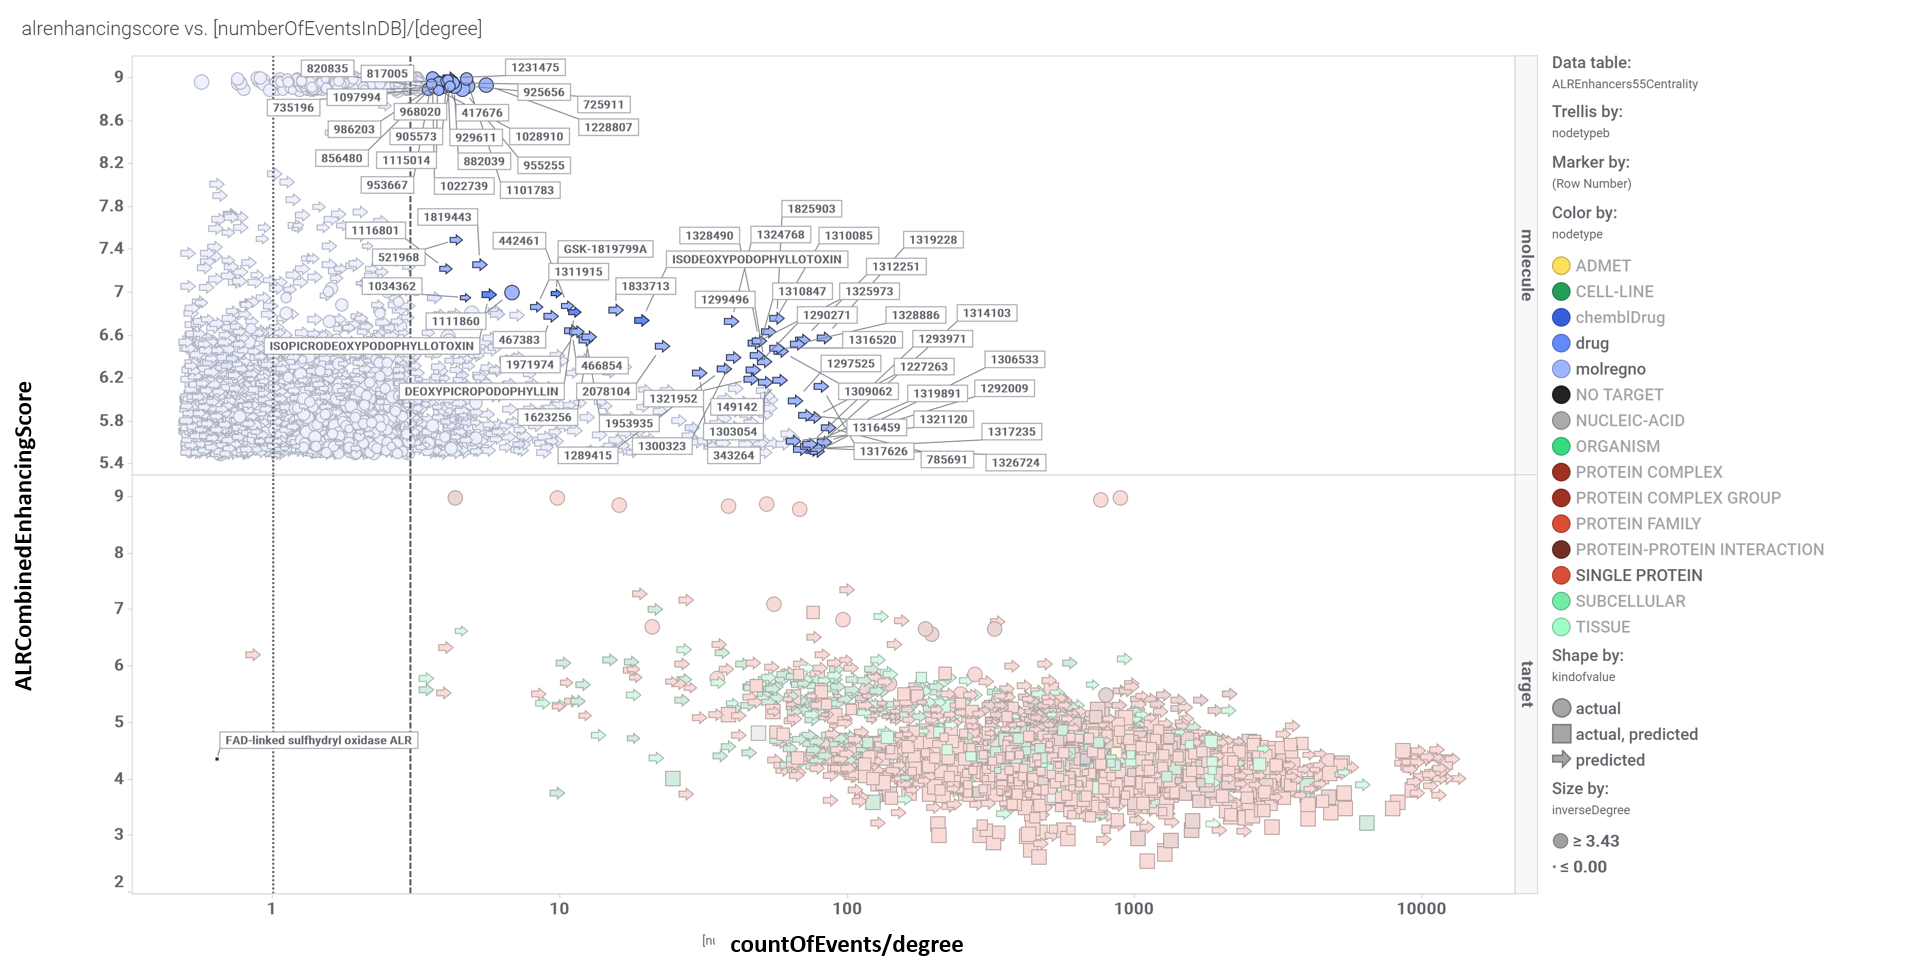
ALR enhancers score vs degree centrality corrected by occurrence in the ChEMBL DB.
Below, some examples of most potent ALR compounds structures, so as chemical clusters of interest. A txt file with all interactions can be downloades from the ALR downloads page.
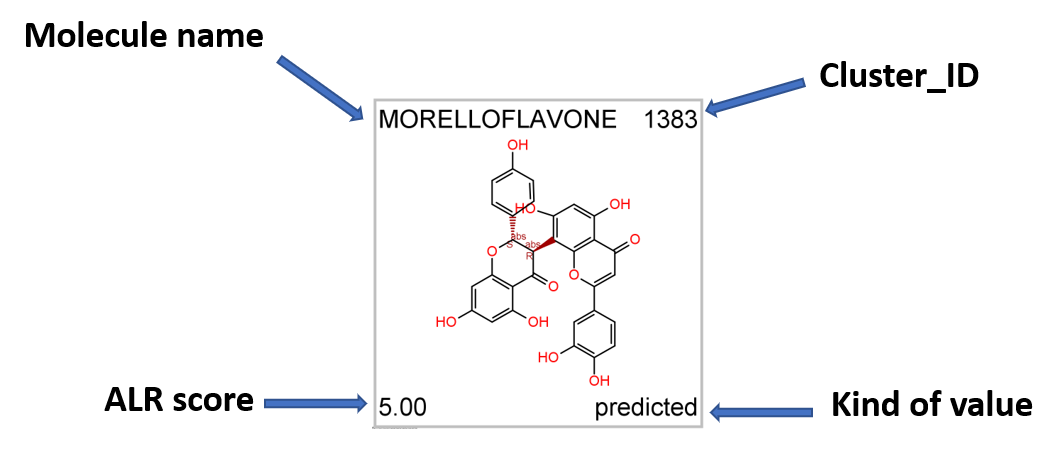
Compound structure display schema.
Most potent actual and predicted ALR inhibitors.
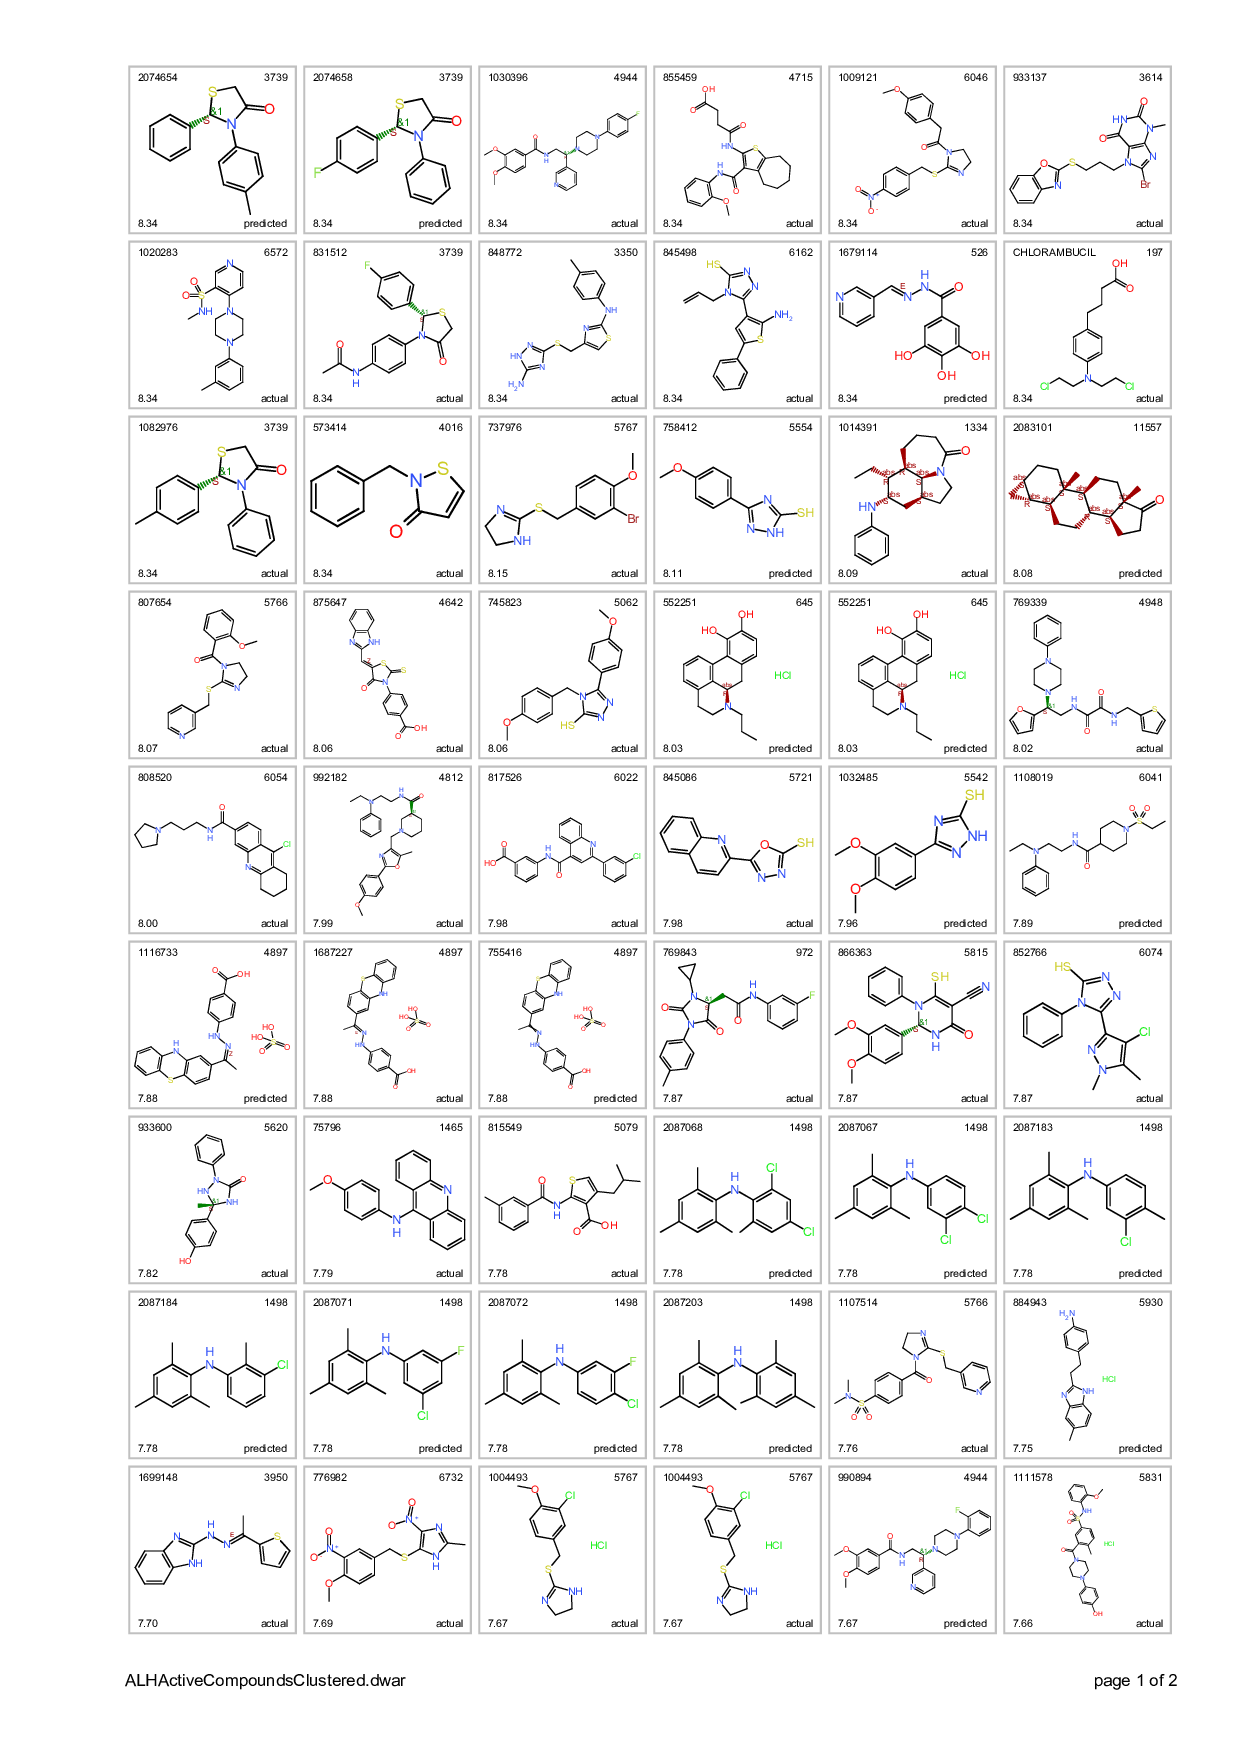
Most potent ALR inhibitors. Top left: molecule name. Top right clusterNo. Bottom left: inhibition score. botom right: actual or predicted.
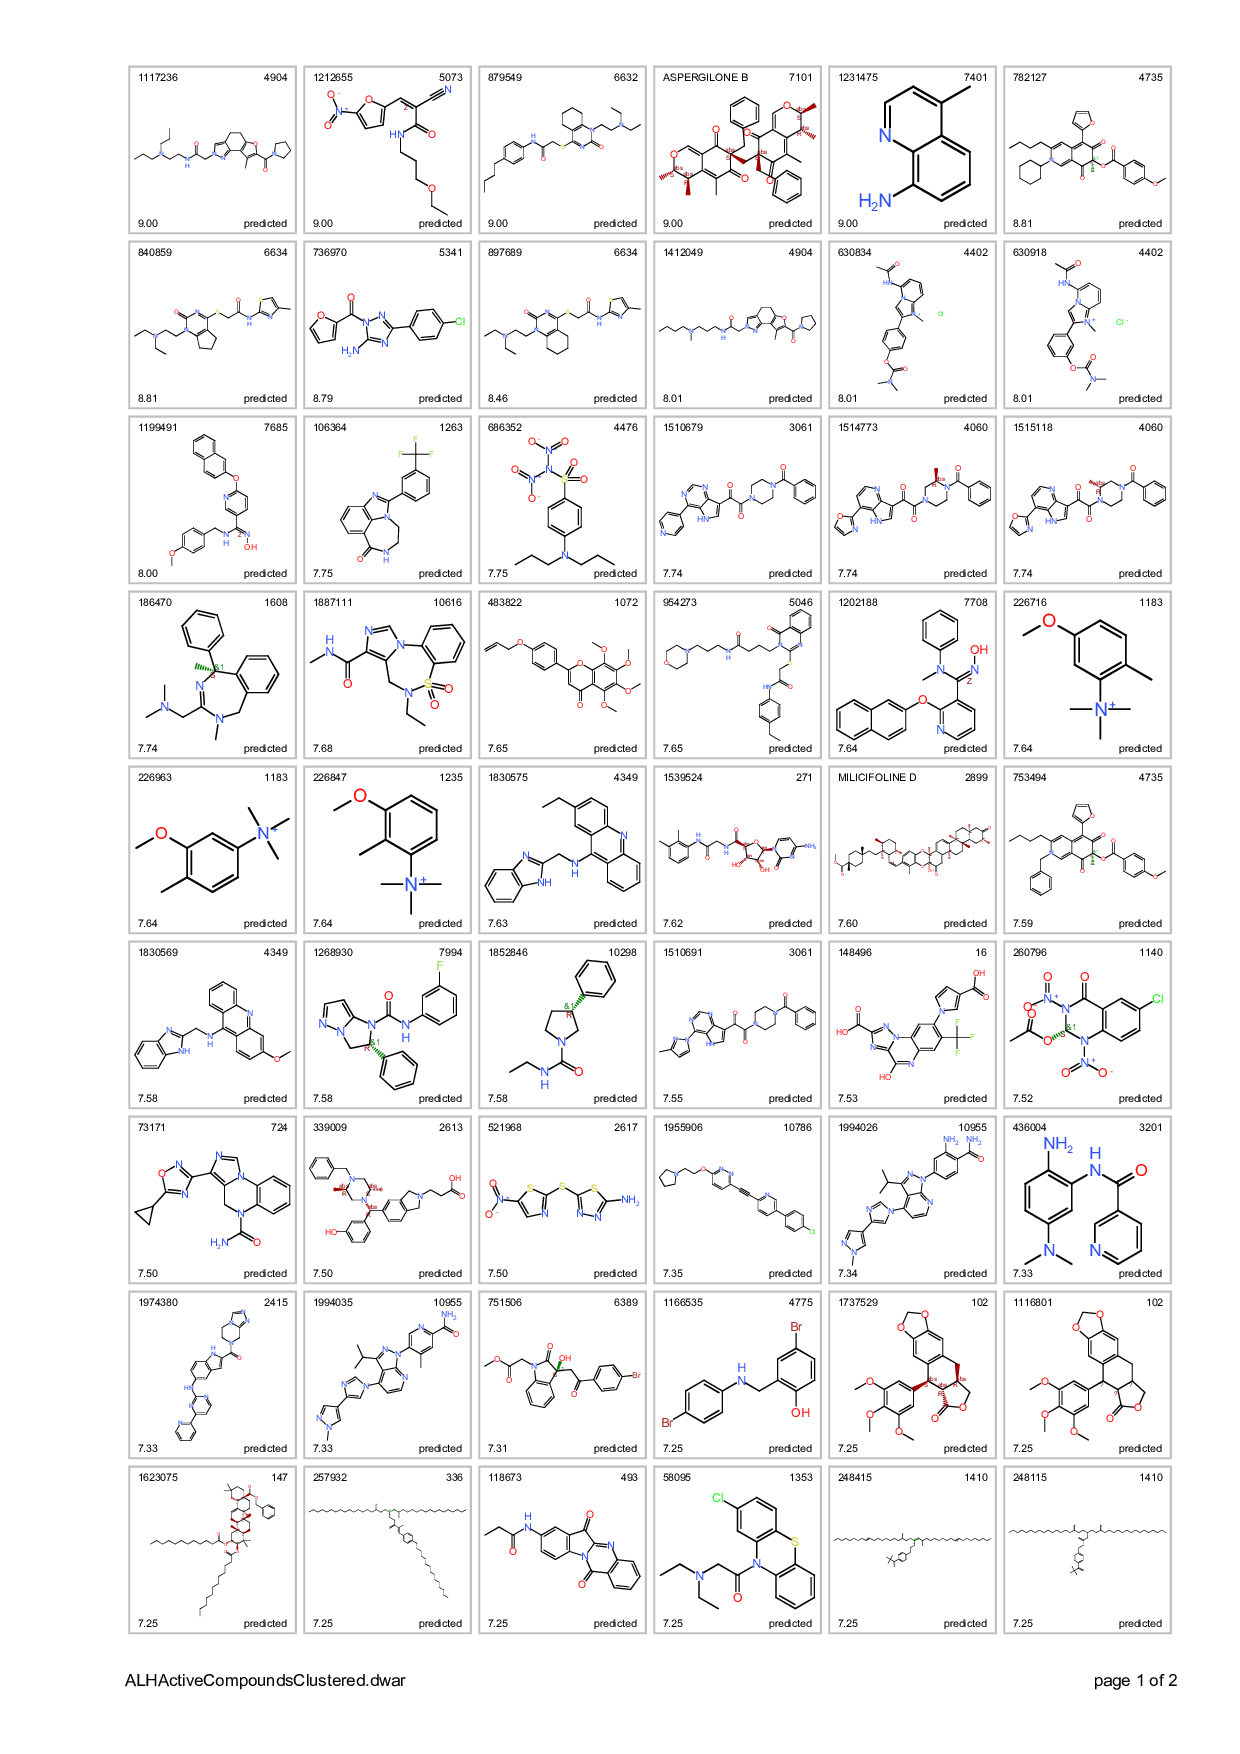
Most potent predicted ALR inhibitors.

Most potent predicted ALR inhibitors. Top left: molecule name. Top right clusterNo. Bottom left: inhibition score. botom right: actual or predicted.
Most potent predicted ALR enhancers.
Most potent predicted ALR enhancers. Top left: molecule name. Top right clusterNo. Bottom left: inhibition score. botom right: actual or predicted.
And a few examples of particular clusters…
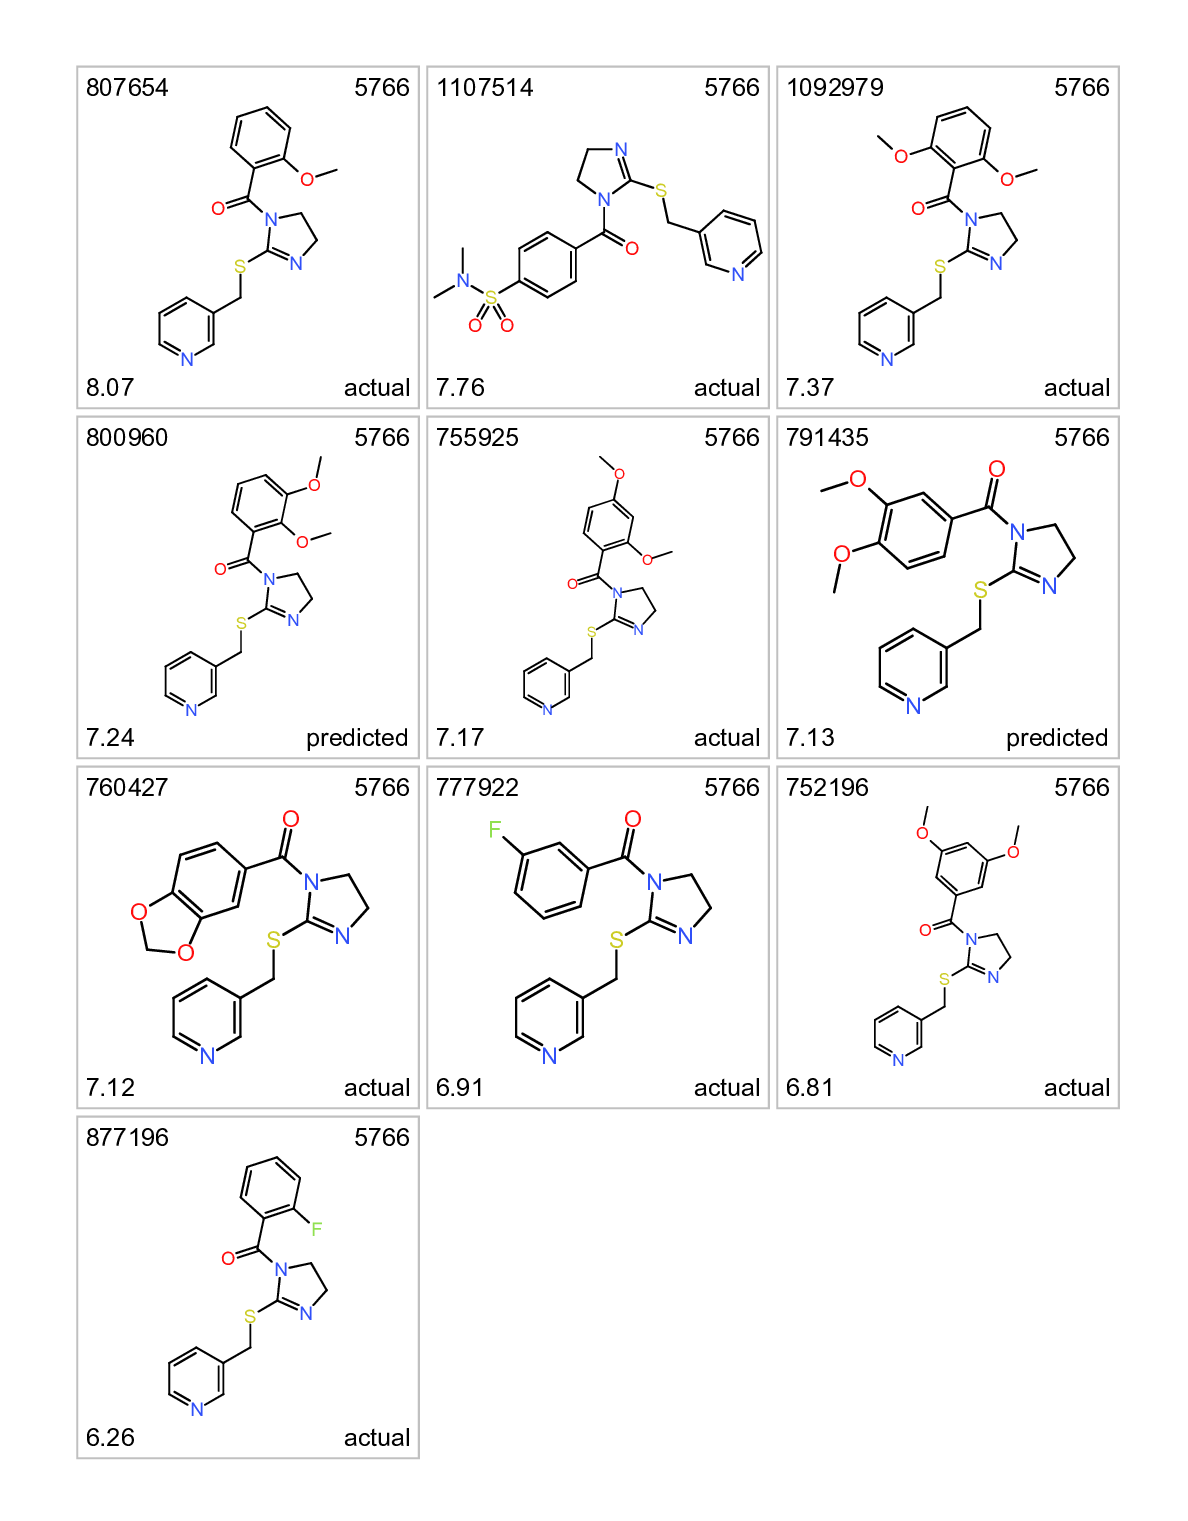
Cluster 5766. Actual and predicted ALR inhibitors. Top left: molecule name. Top right clusterNo. Bottom left: inhibition score. botom right: actual or predicted.
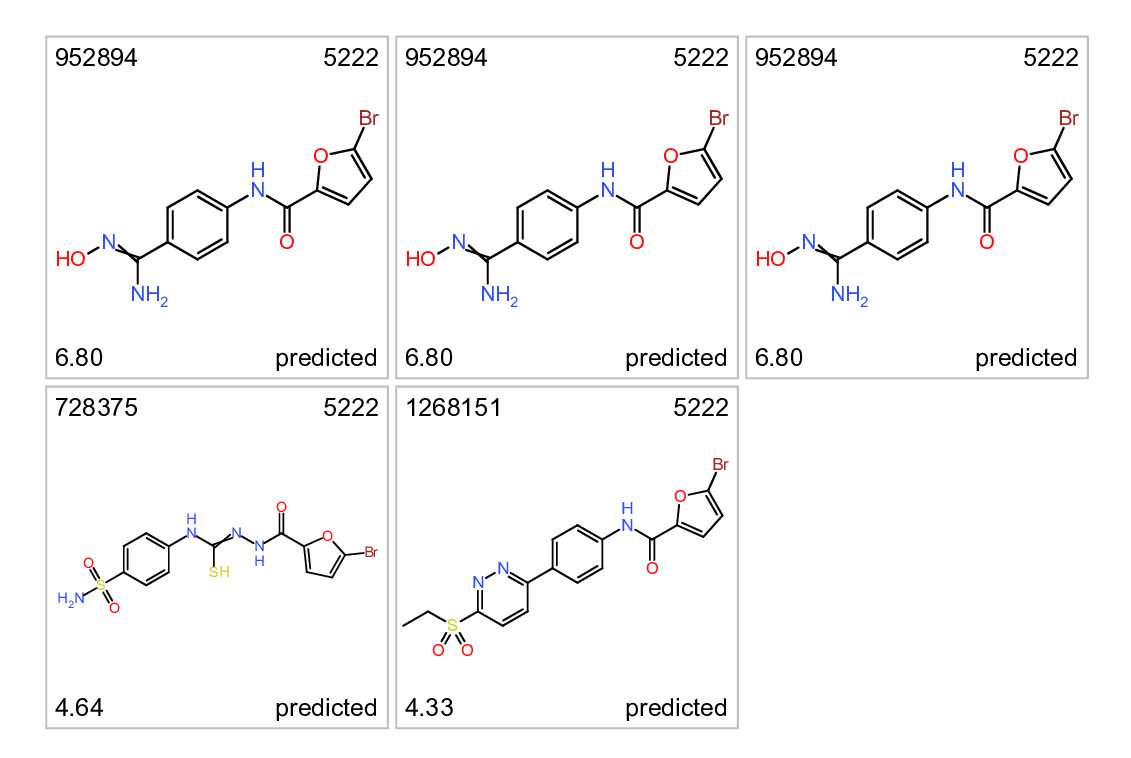
Cluster 5766. Predicted ALR inhibitors. Top left: molecule name. Top right clusterNo. Bottom left: inhibition score. botom right: actual or predicted.
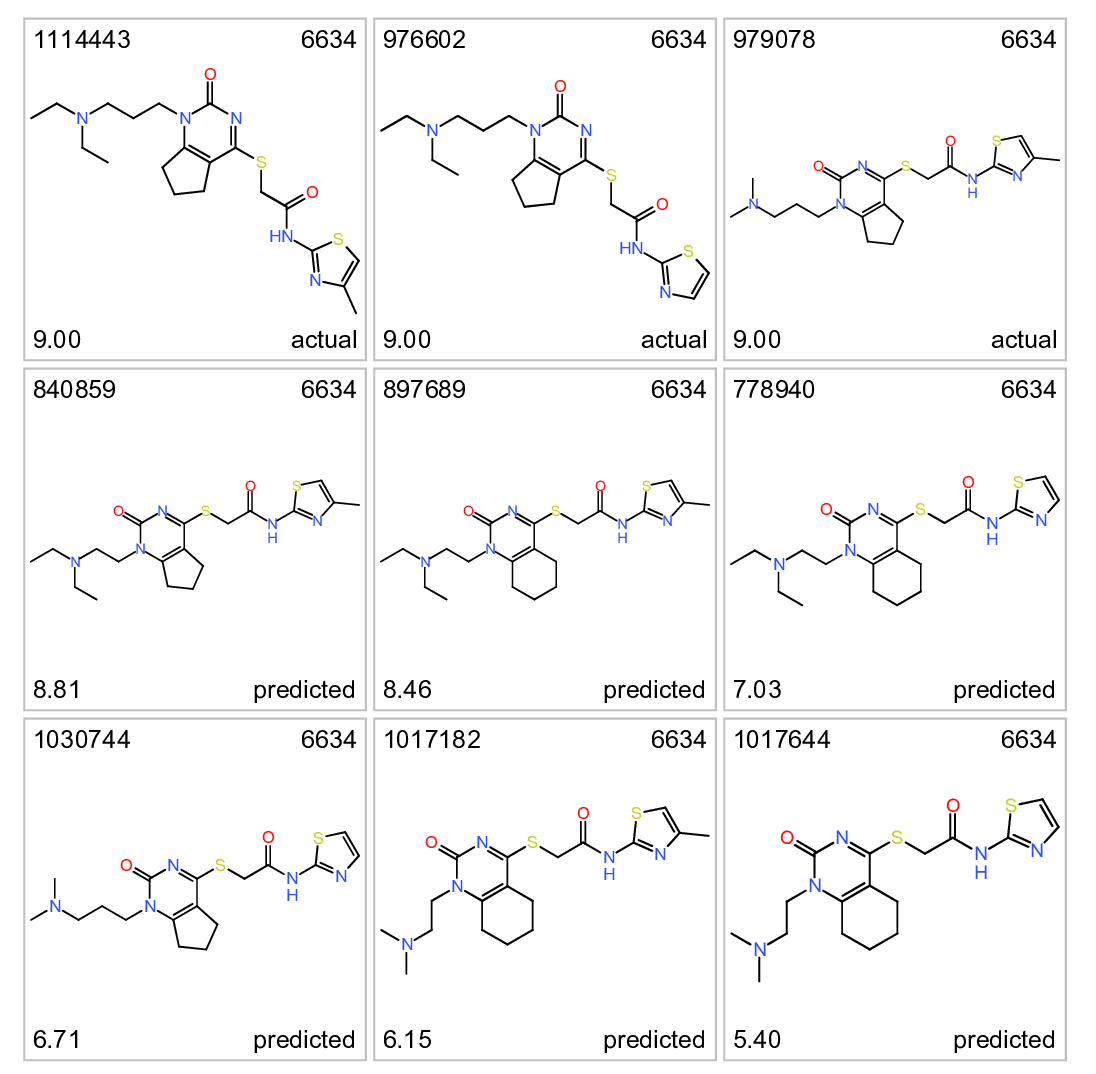
Cluster 6634. Actual and predicted ALR enhancers. Top left: molecule name. Top right clusterNo. Bottom left: inhibition score. botom right: actual or predicted.

Cluster 102. Predicted ALR enhancers. Top left: molecule name. Top right clusterNo. Bottom left: inhibition score. botom right: actual or predicted.