Cytotoxicity: Pathways Analysis
As described in the cytotox target Id section, all the predictions and scores in the DB are pivoted by protein name, and a parameter CountRatio is calculated. The count ratio is the proportion of active (cytotoxic) predicted and actual events vs the total number of events. The plot below shows the distribution of count ratios vs total events for all DB contents. It is identical to that described in the target ID section other than the fact that reactome pathways from Reactome DB have been inserted, so that one protein target is represented as many times as the pathways it is associated to. In this example the tubulin protein items are marked displaying the tubulin associated pathways.
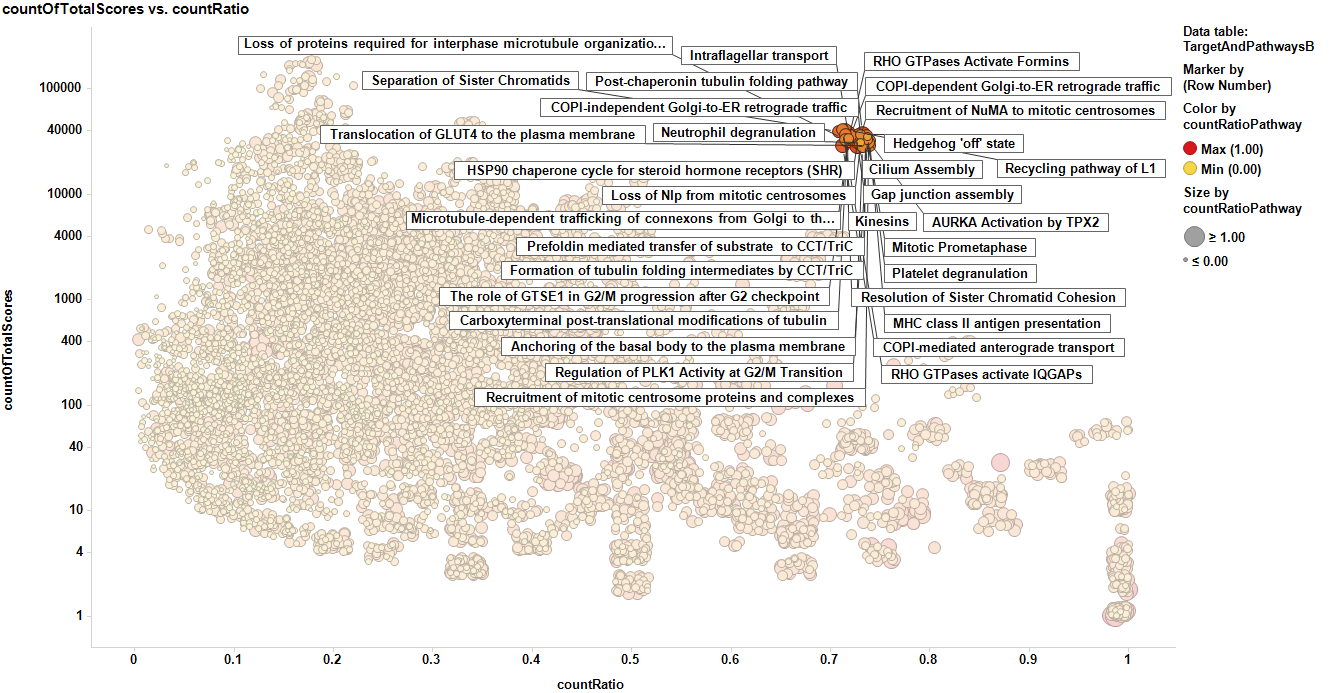
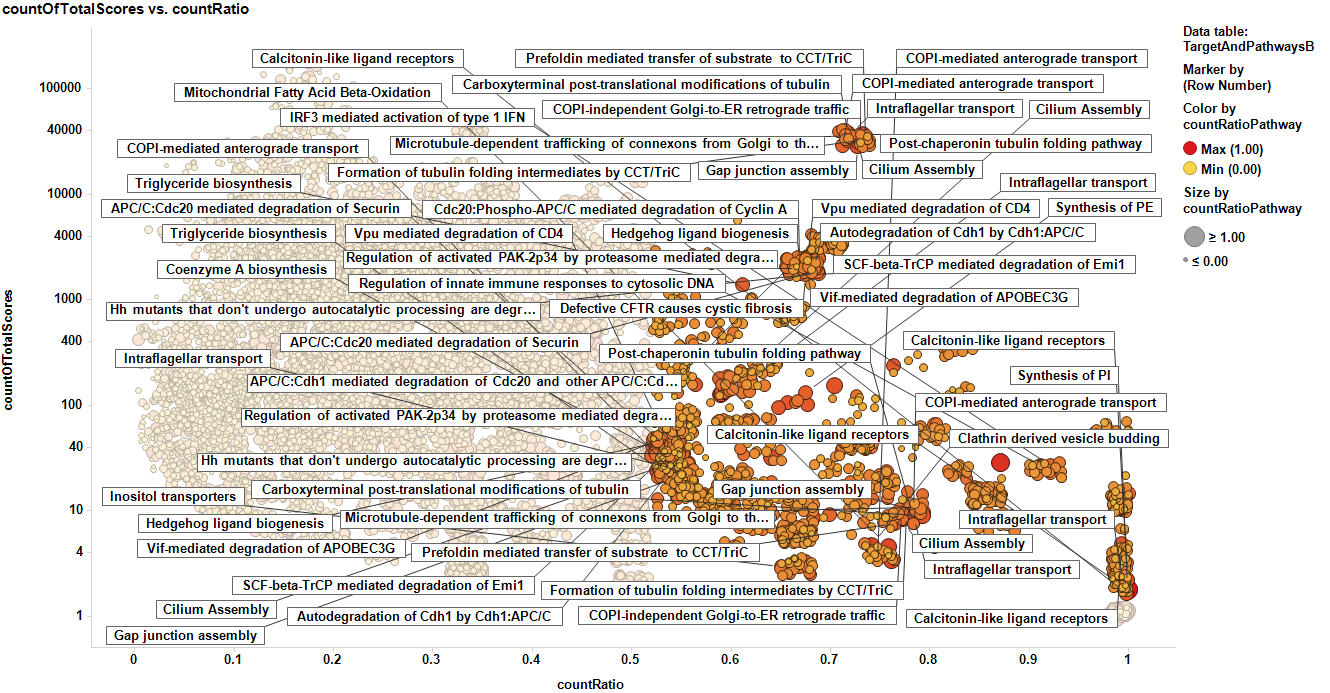
Here we see the pathways marking the protein targets with higher scores.
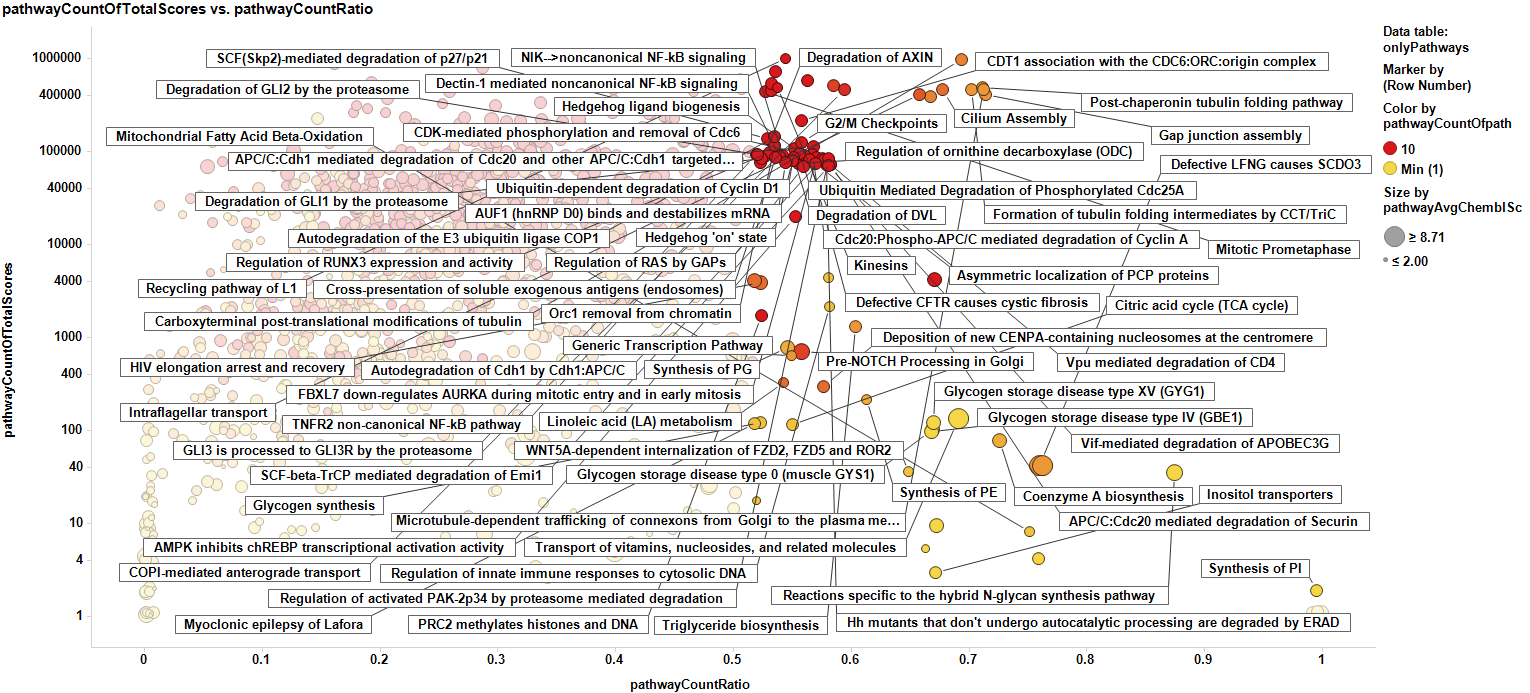
We can pivot the results by pathway, and now the countRatio of the pathway is the average of the countRatio of all the proteins participating in it, and the countOfTotal scores is the sum of the countOfScores of each pathway associated protein target. We have to be careful, because many of the items with more representation in the DB are quite generic pathways (marked below are some pathways with high representation in the DB).
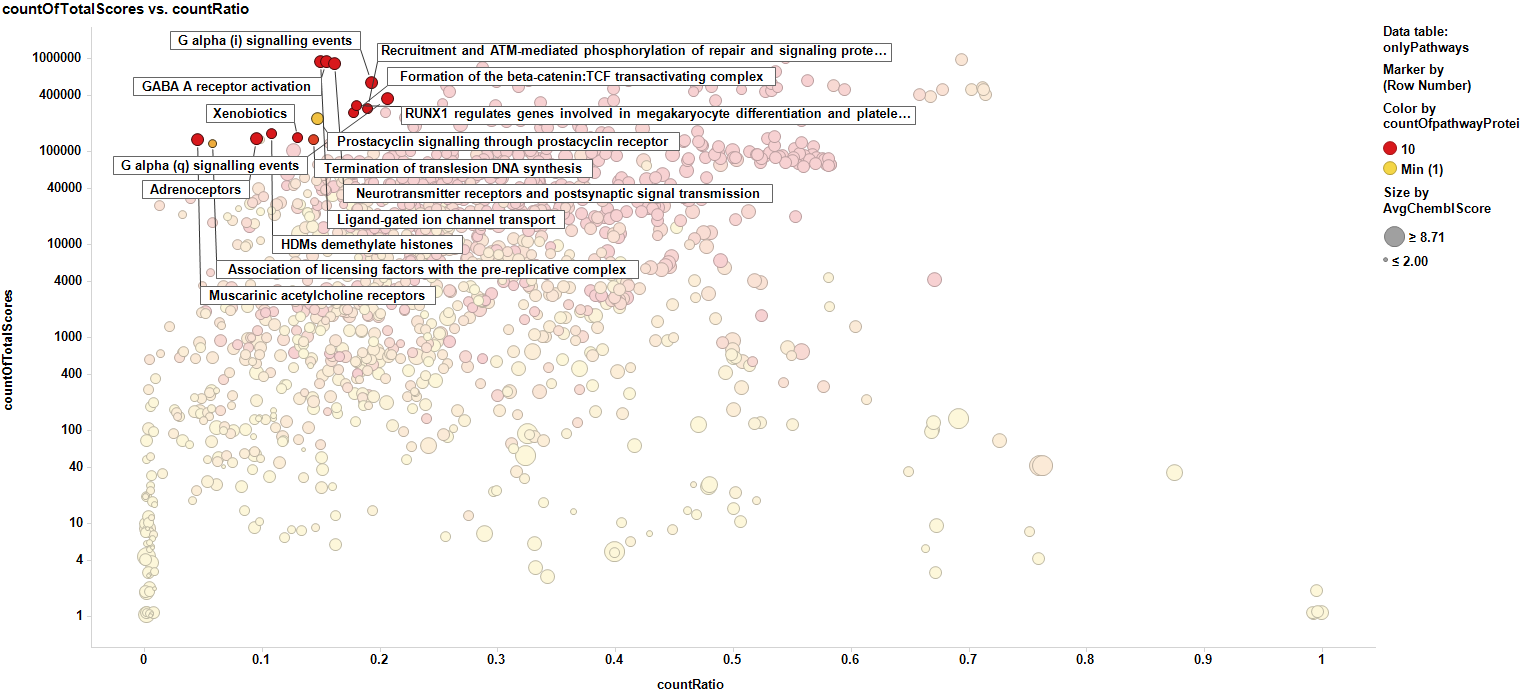
And, of course, we can also select pathways from the averaged scores…
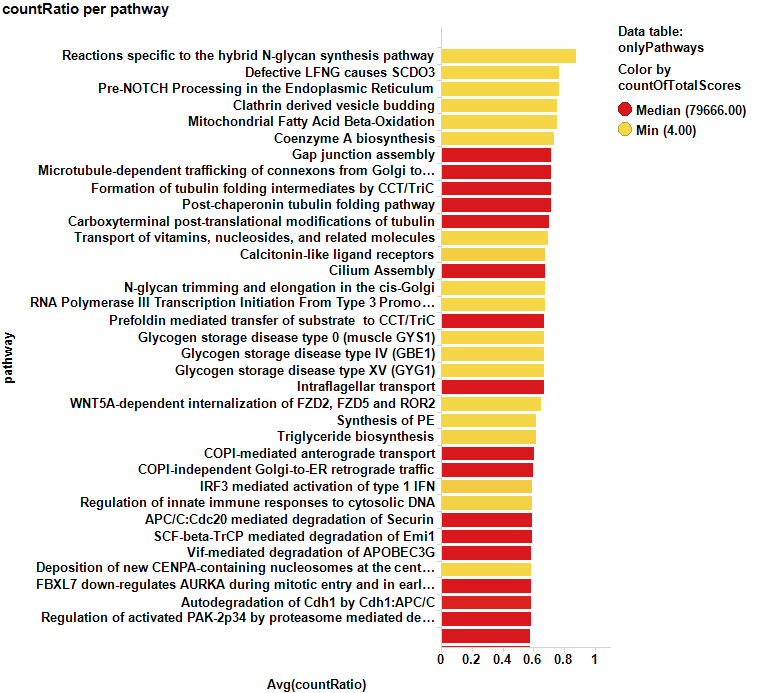
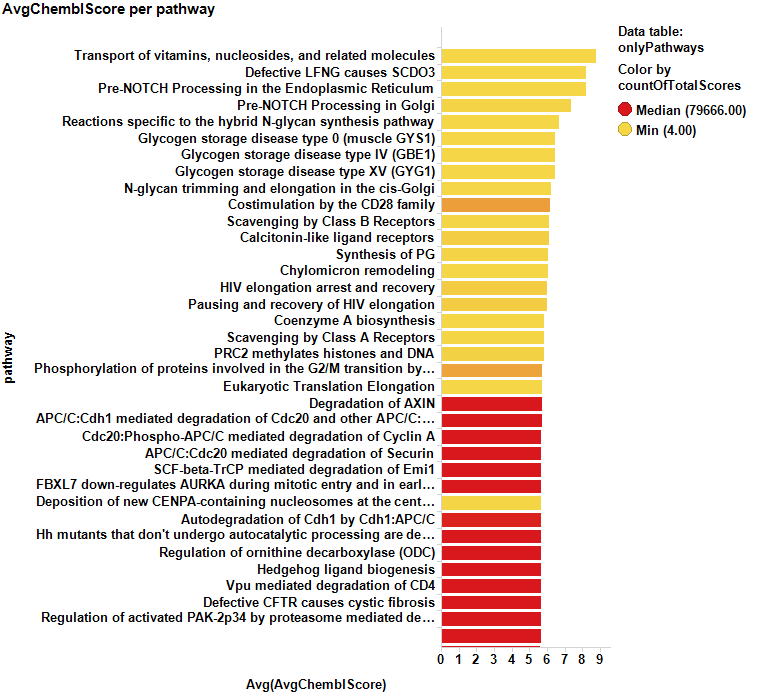
Bar charts show some of the predicted cytotoxic pathways ranked by their respective countRatio or averaged chemblScore. A score table with pathways selected in the dot plot above can be accessed through the button just below.
Predicted cytotoxic pathways by countRatio
Predicted cytotoxic pathways by chemblScore
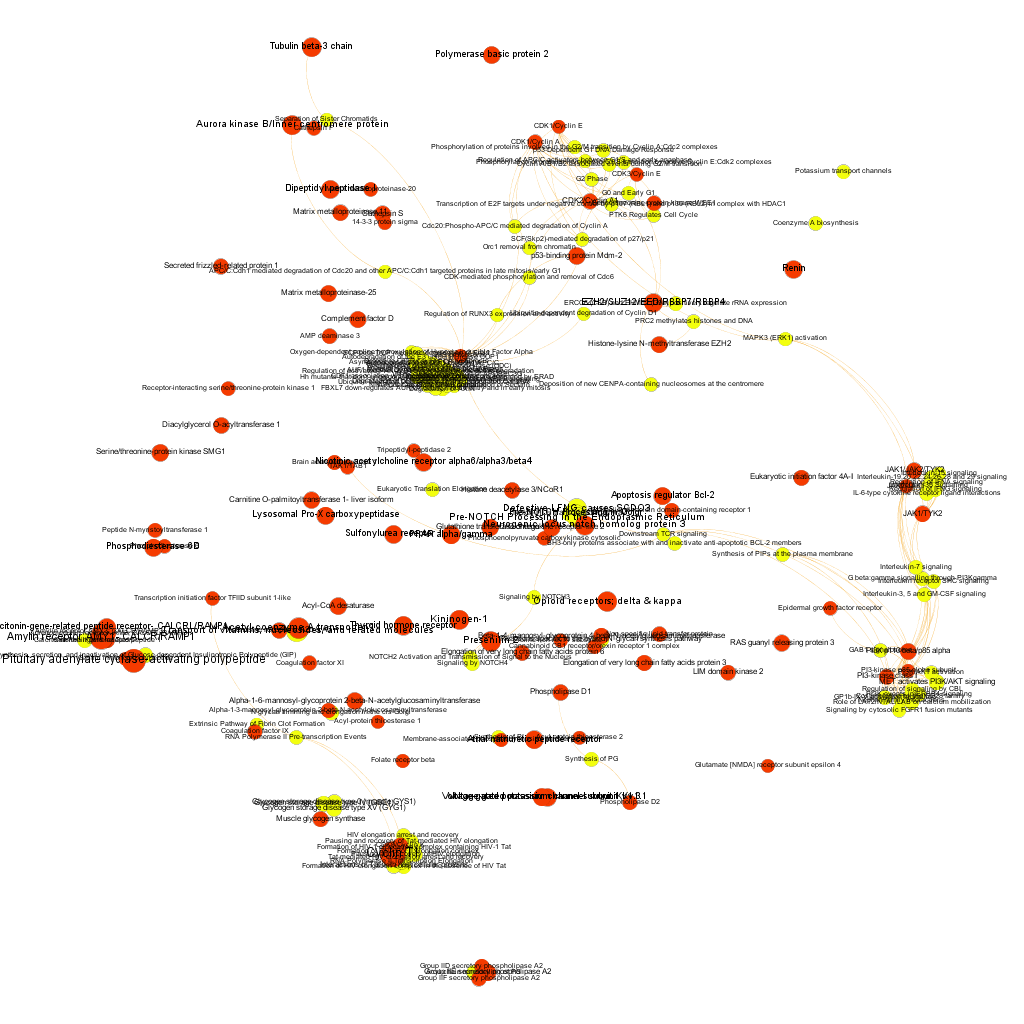
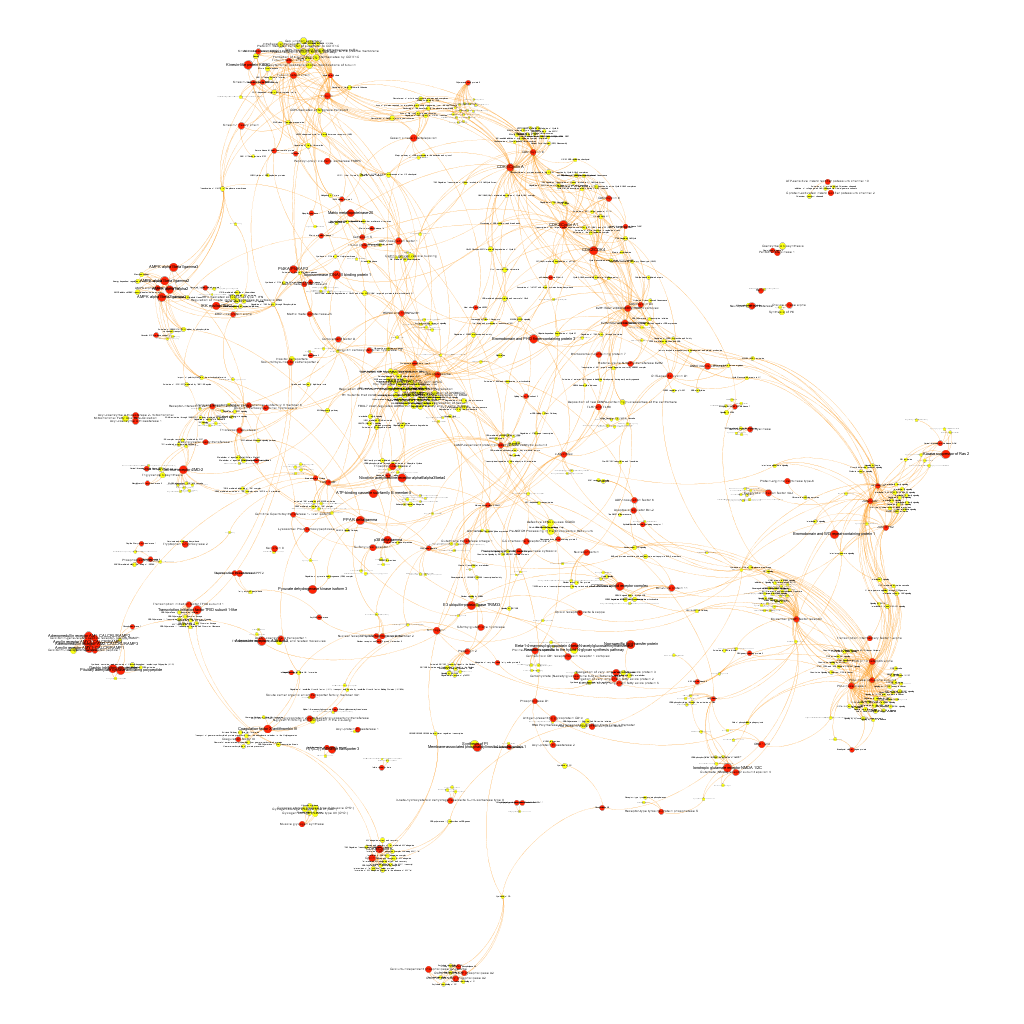
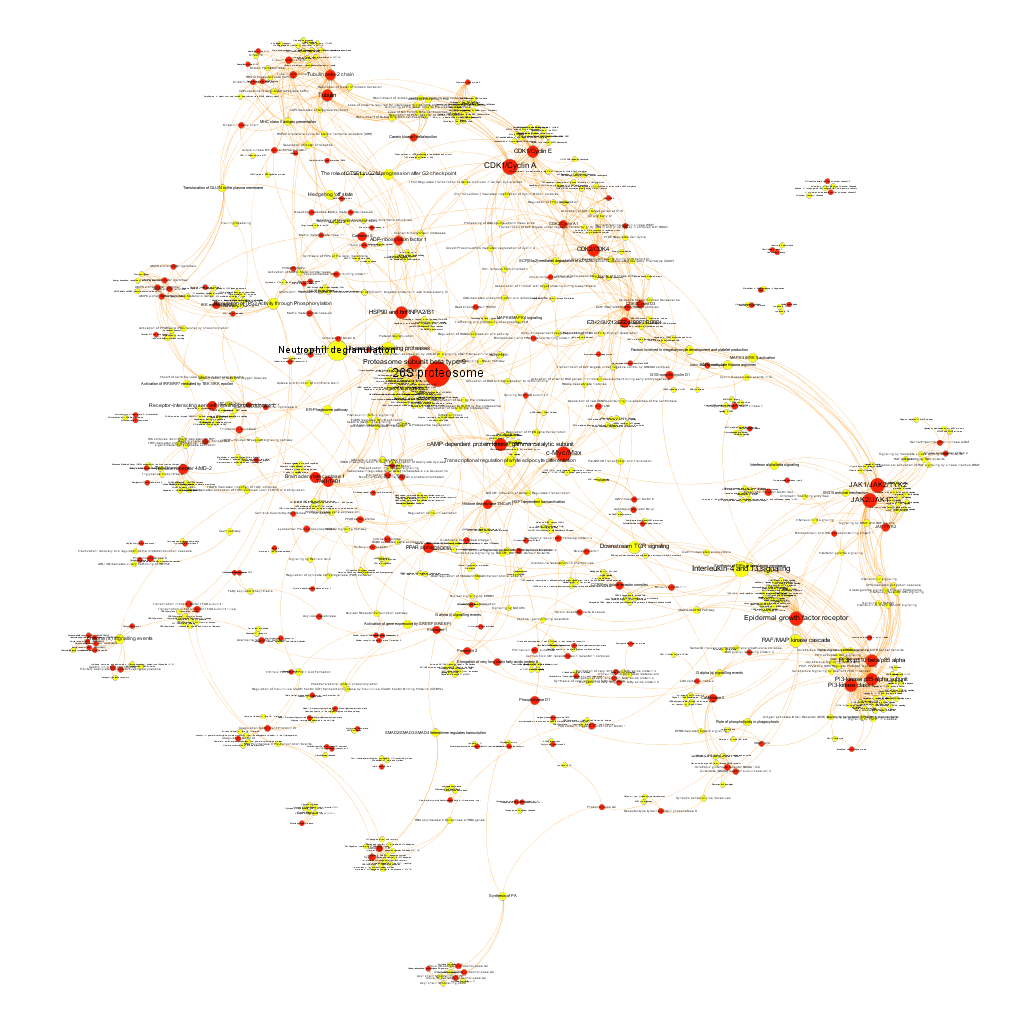
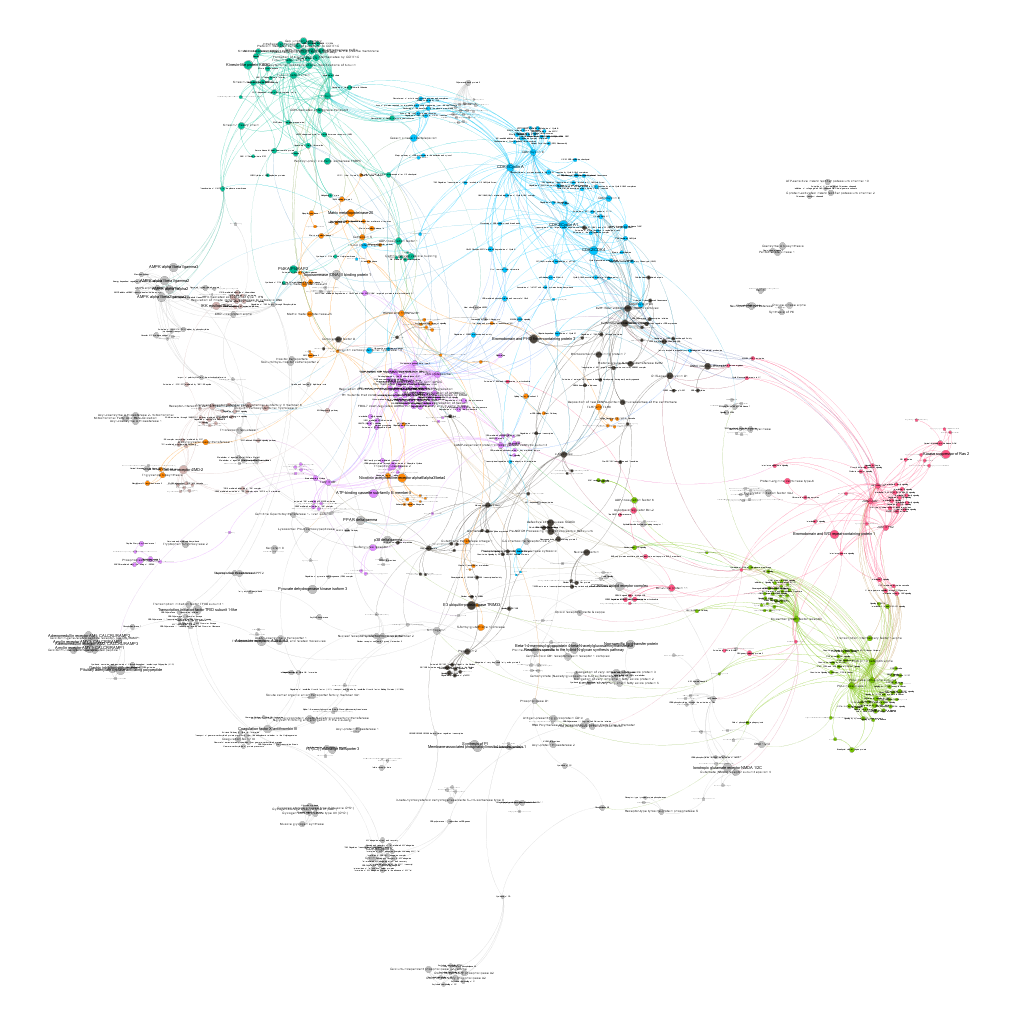
Protein to pathways relationships: Graph analysis.
Connection between pathways and their proteins can be explored through graphs. This allows, not only to visualize the existing relations, but also the calculation of centrality measures, which determine the importance of the nodes within the network in multiple ways. Click on the graph itself to enlarge it or in the pdf link if you want a larger extension with higher precision.
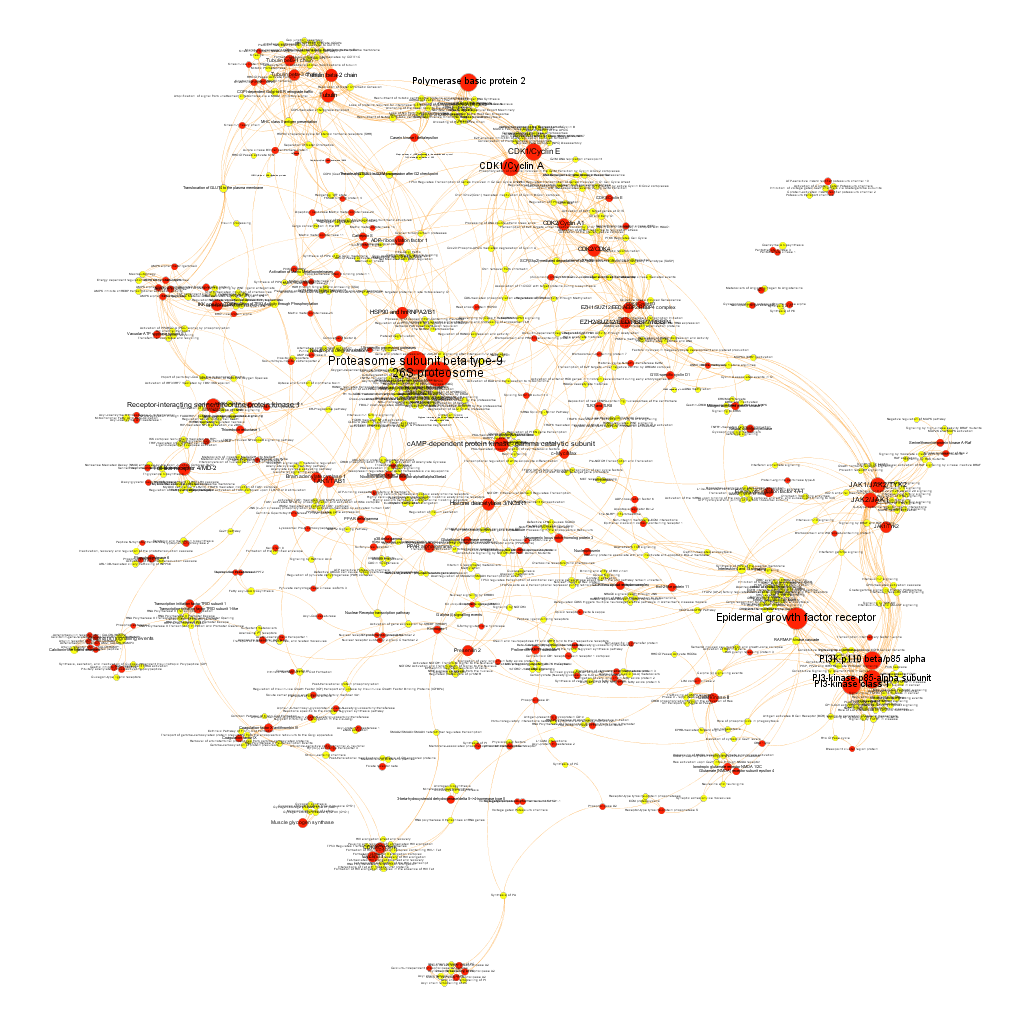
Cytotoxicity graph sized by betweenness
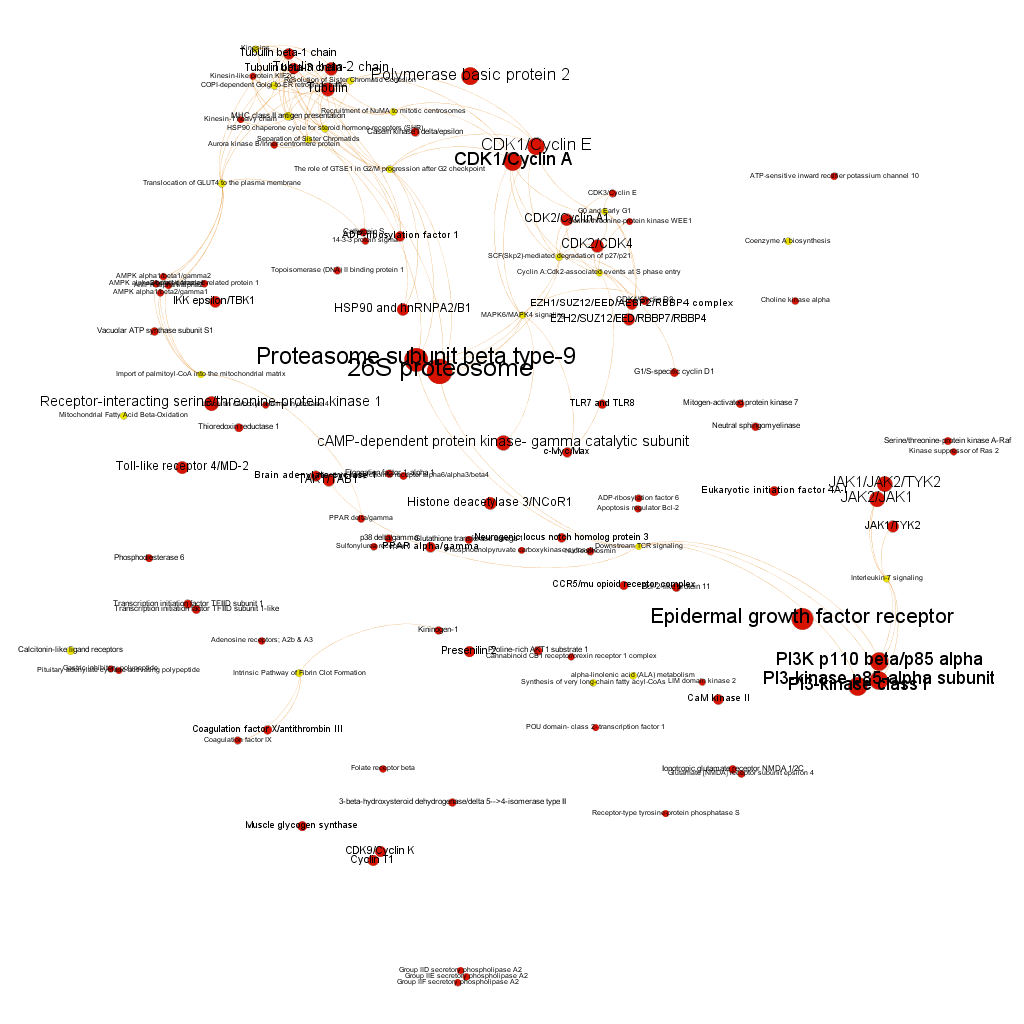
Cytotoxicity graph sized by countRatio. Colors correspond to different clusters after the application of a modularity algorithm.
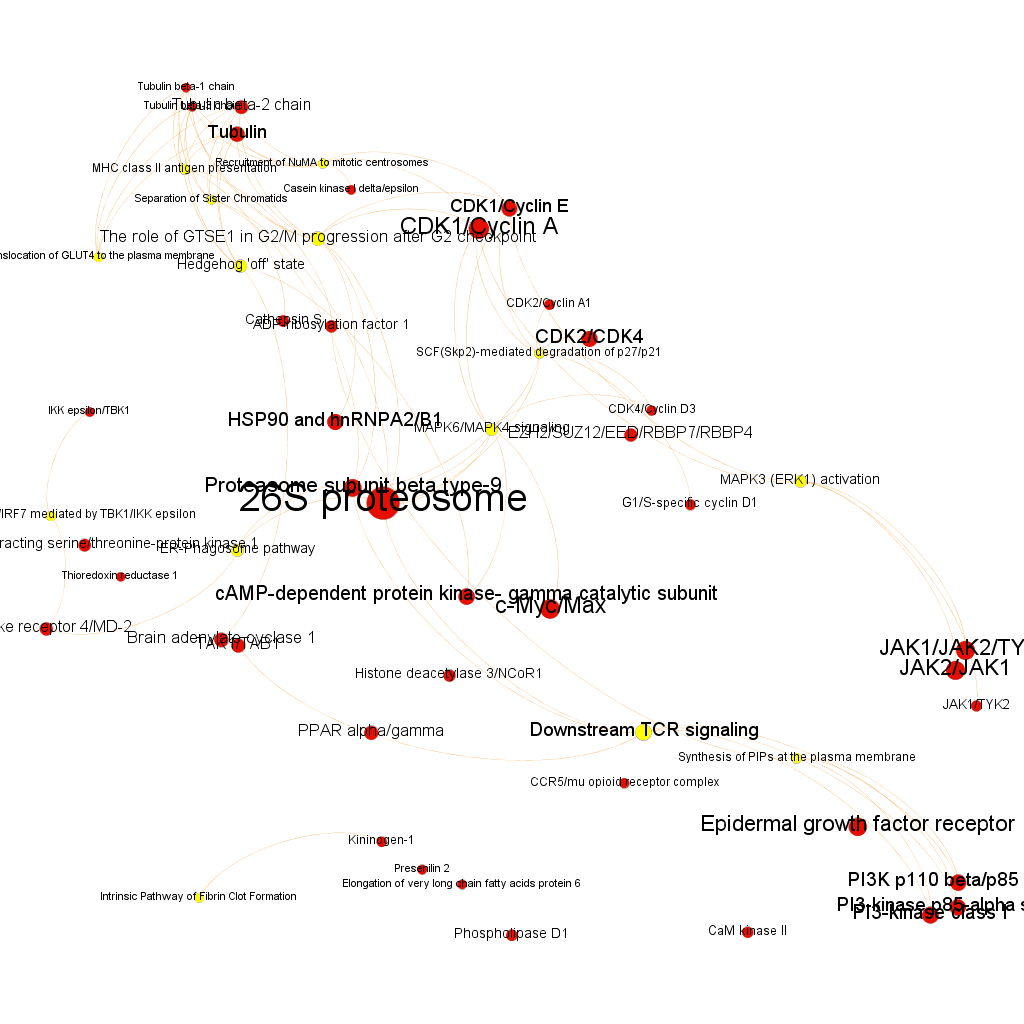
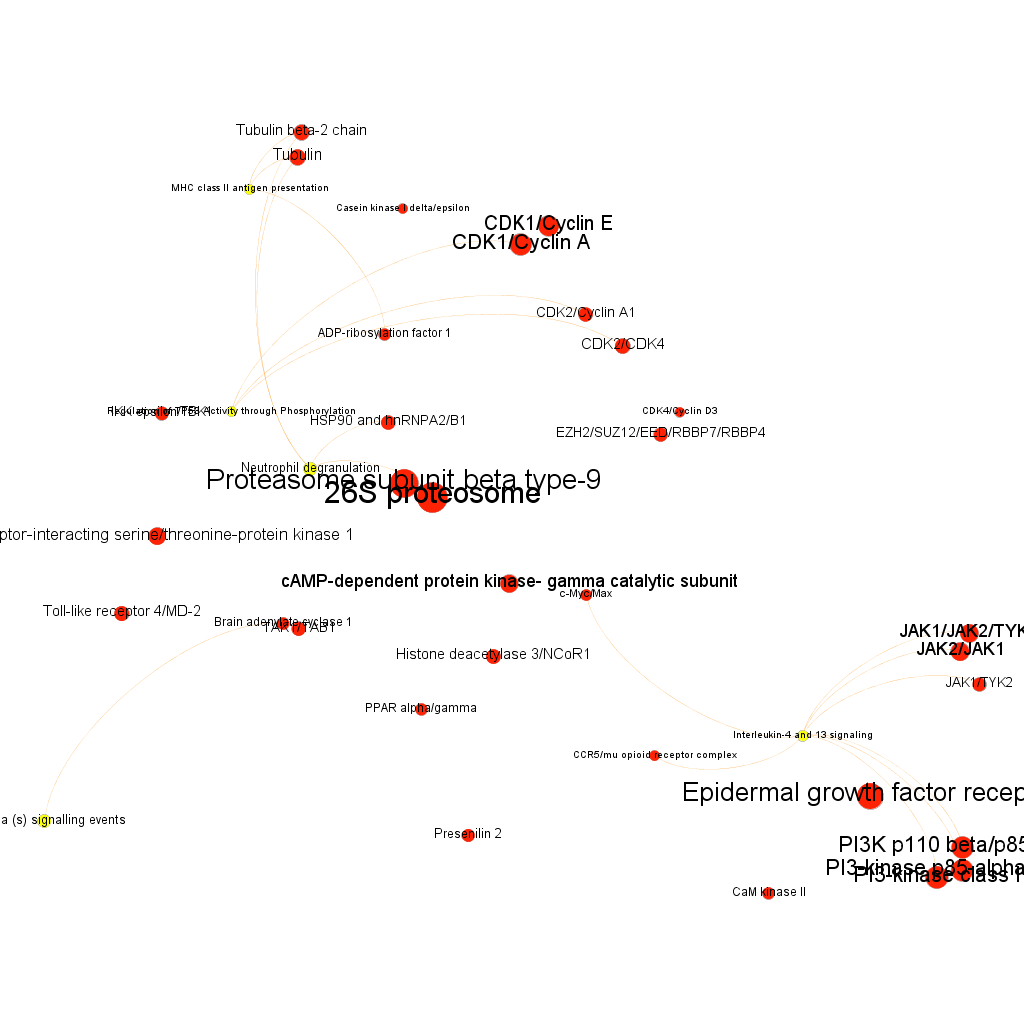
Cytotoxicity graph sized by Page Rank.
Network graphs can also be queried for biological, statistical, centrality or modularity parameters, here are a few examples.