Pathways analysis with the SMN2 dataset.
Once targets are selected in the target ID section, we can proceed incorporating the pathways from Reactome database (Keggs and others would suit as well), in this case Reactome low level pathways.
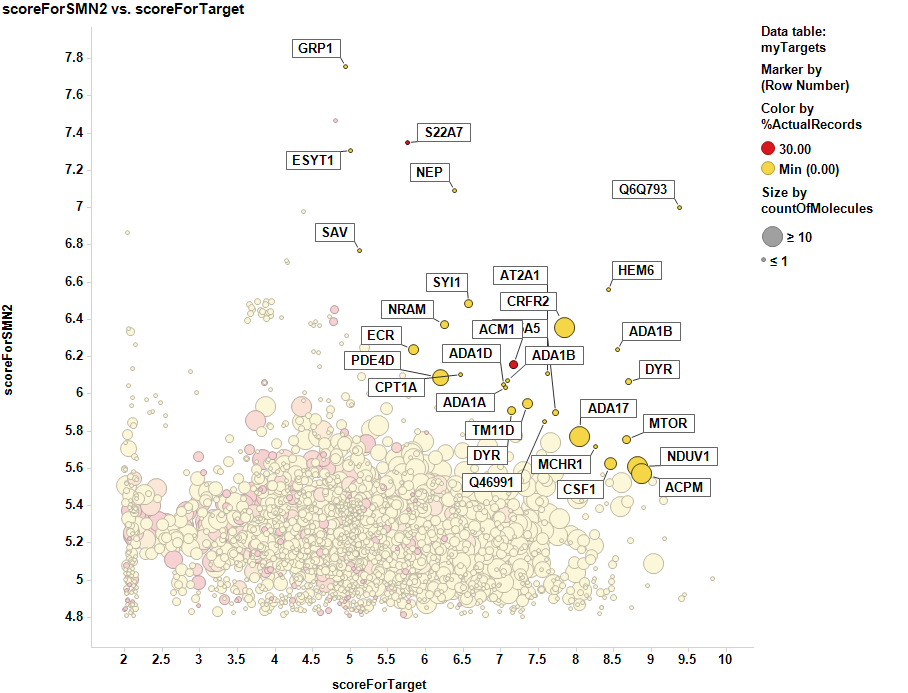
Targets selected in the target ID section
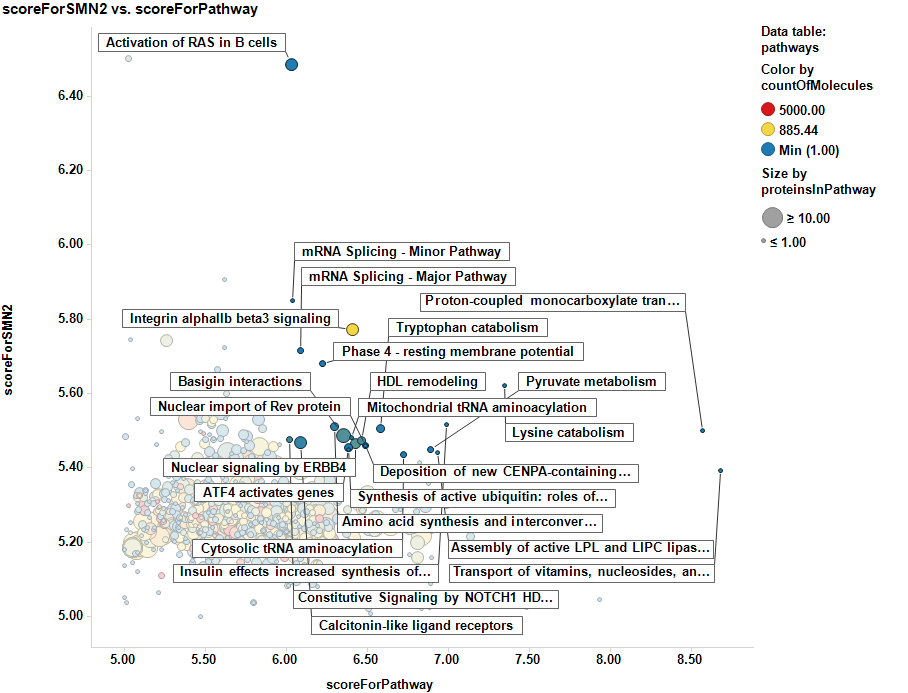
The SMNscores are now aggregated by pathway, and there is a pathway potency score calculated too. Below a selection of best combinations of both scores.
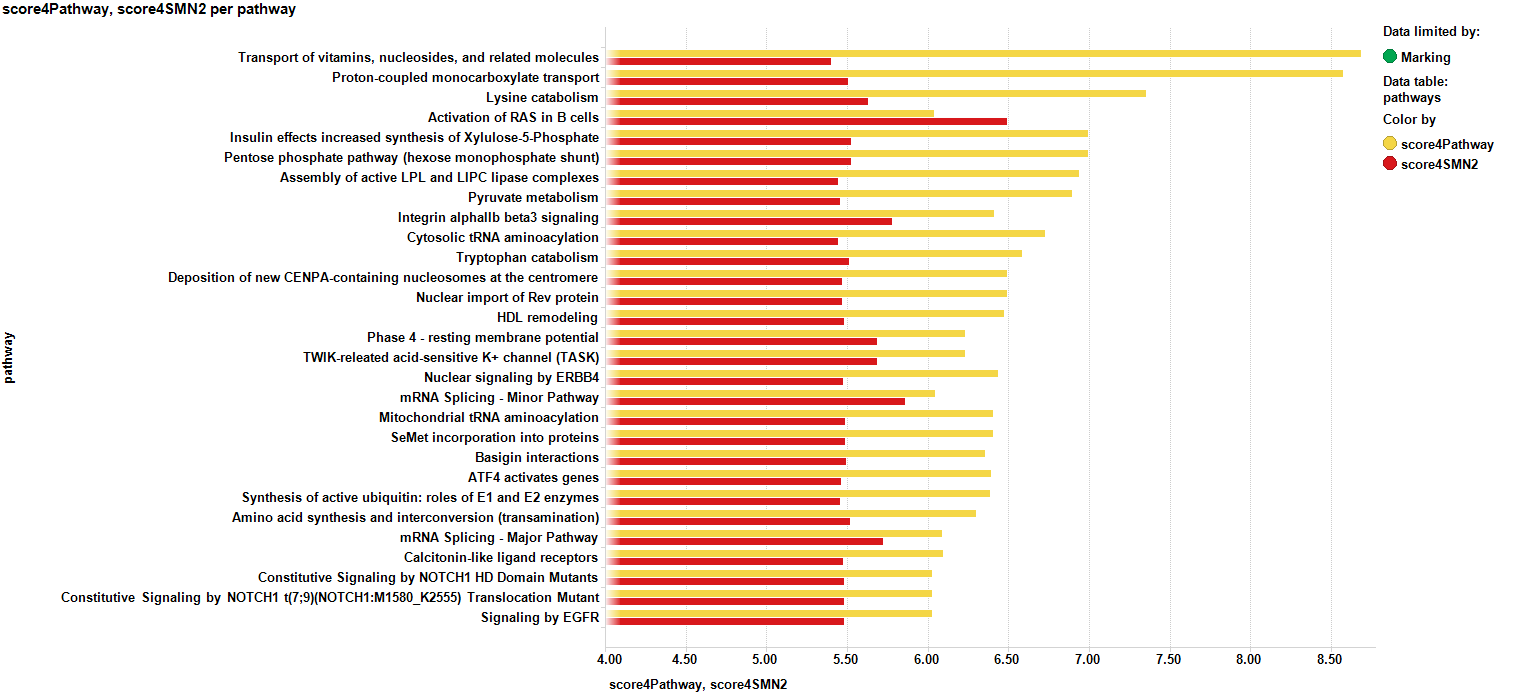
And the respective barchart with the scores sorted by potency…
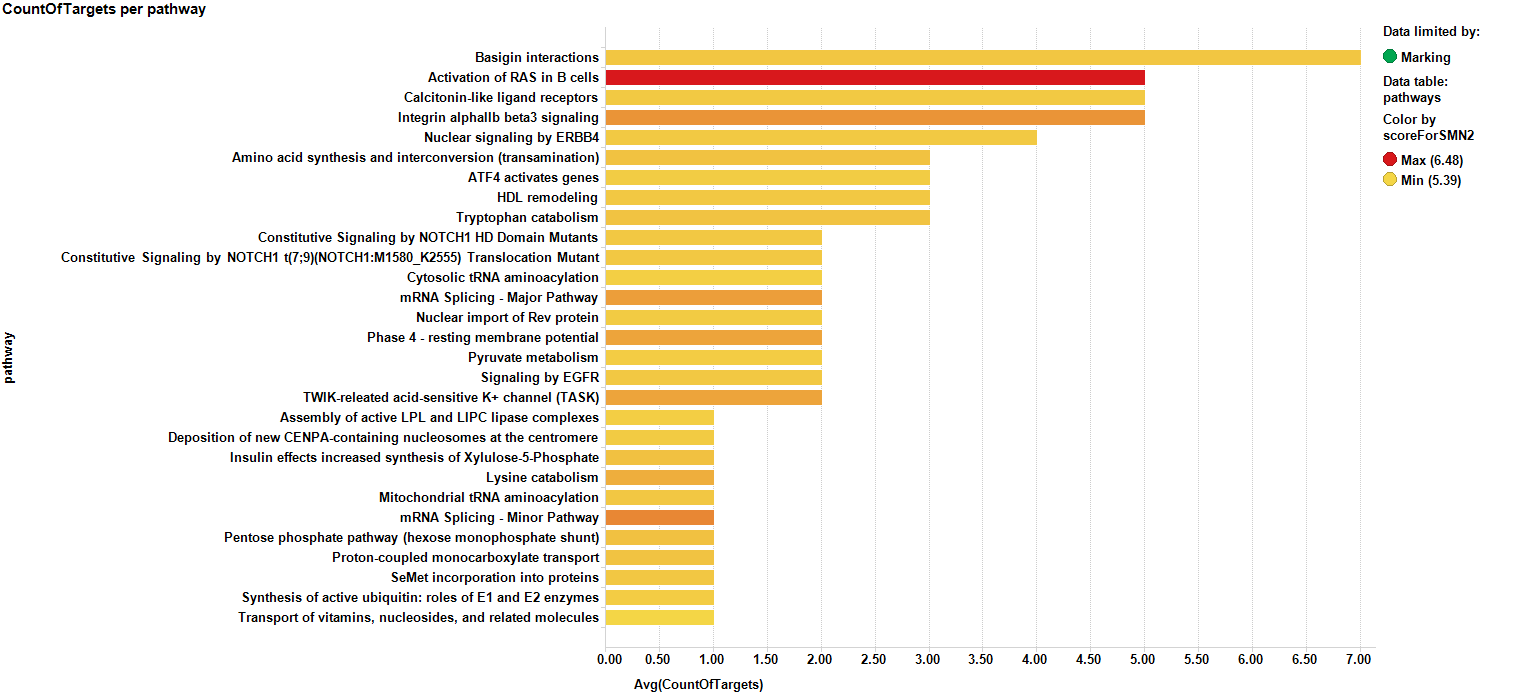
It may be also be interesting to consider how many proteins appear in the identified pathways…
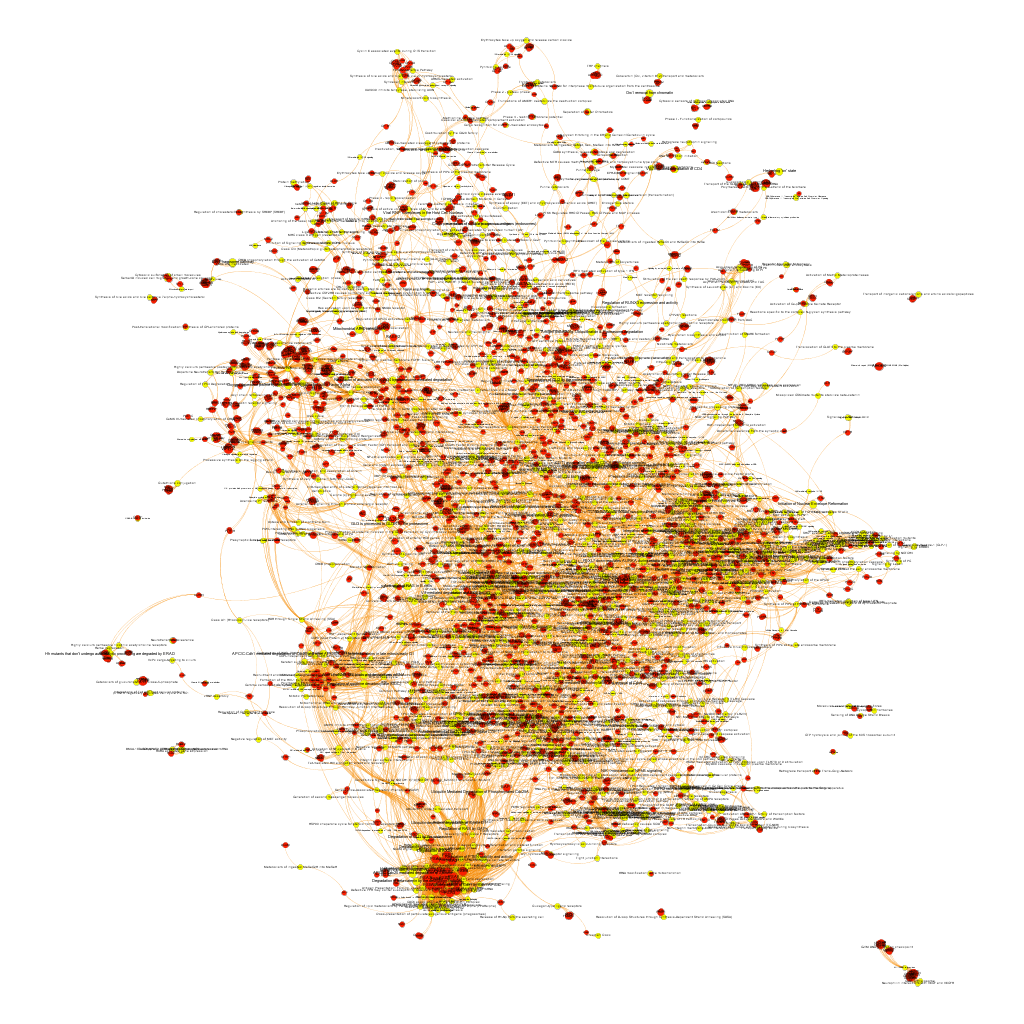
Pathways analysis. The use of graph databases.
What we have now is a collection of target-pathway pairs accompanied by a series of numerical and class descriptors. We can track the relationships among all pair members and quantify and categorize them using the descriptors as weights and labels. This is what graph databases do, and we can always query the database for components and properties.
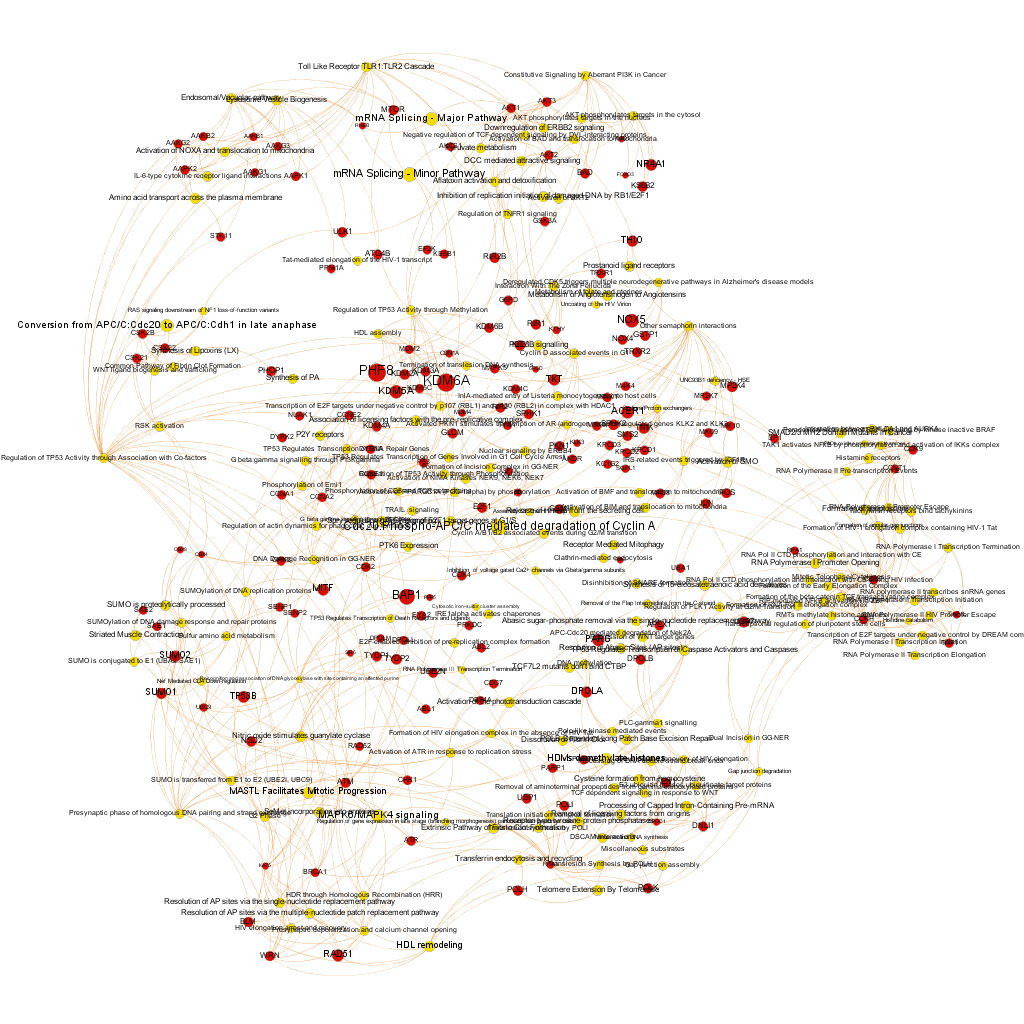
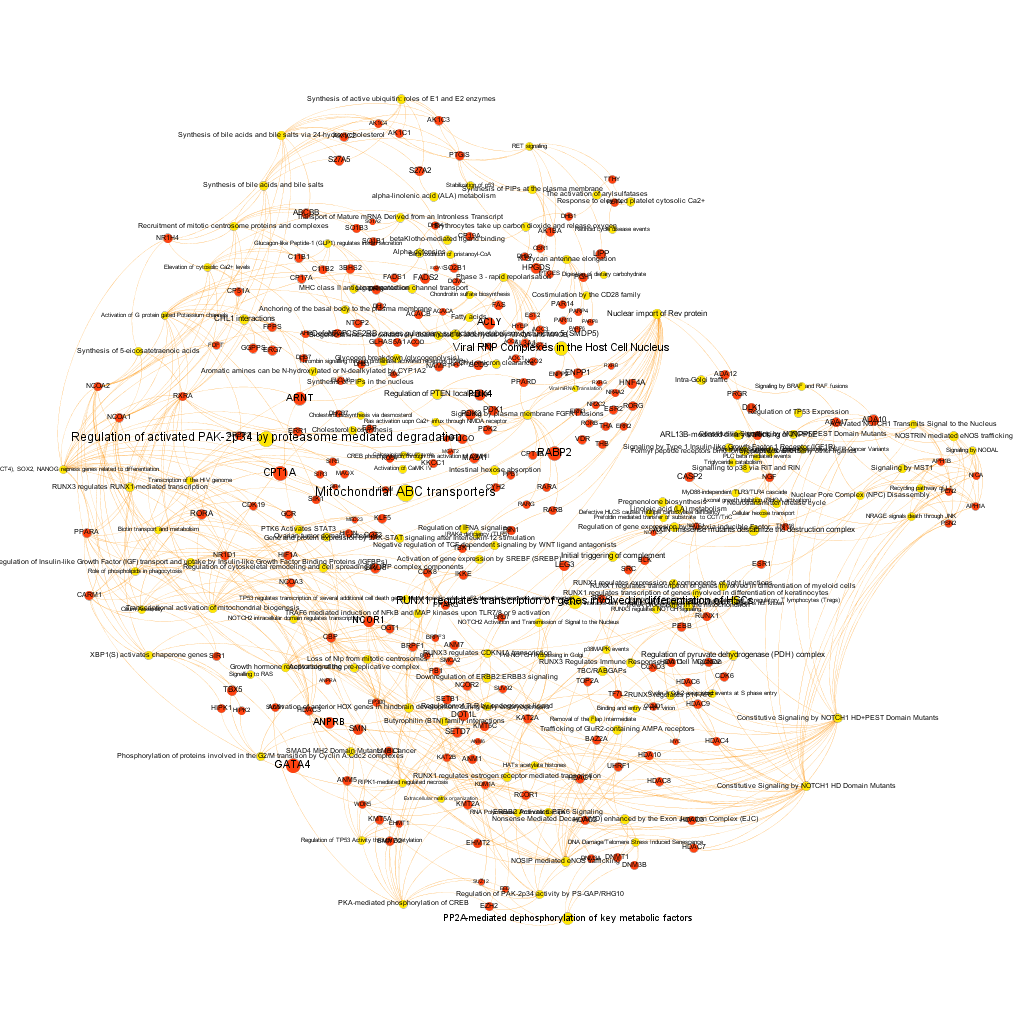
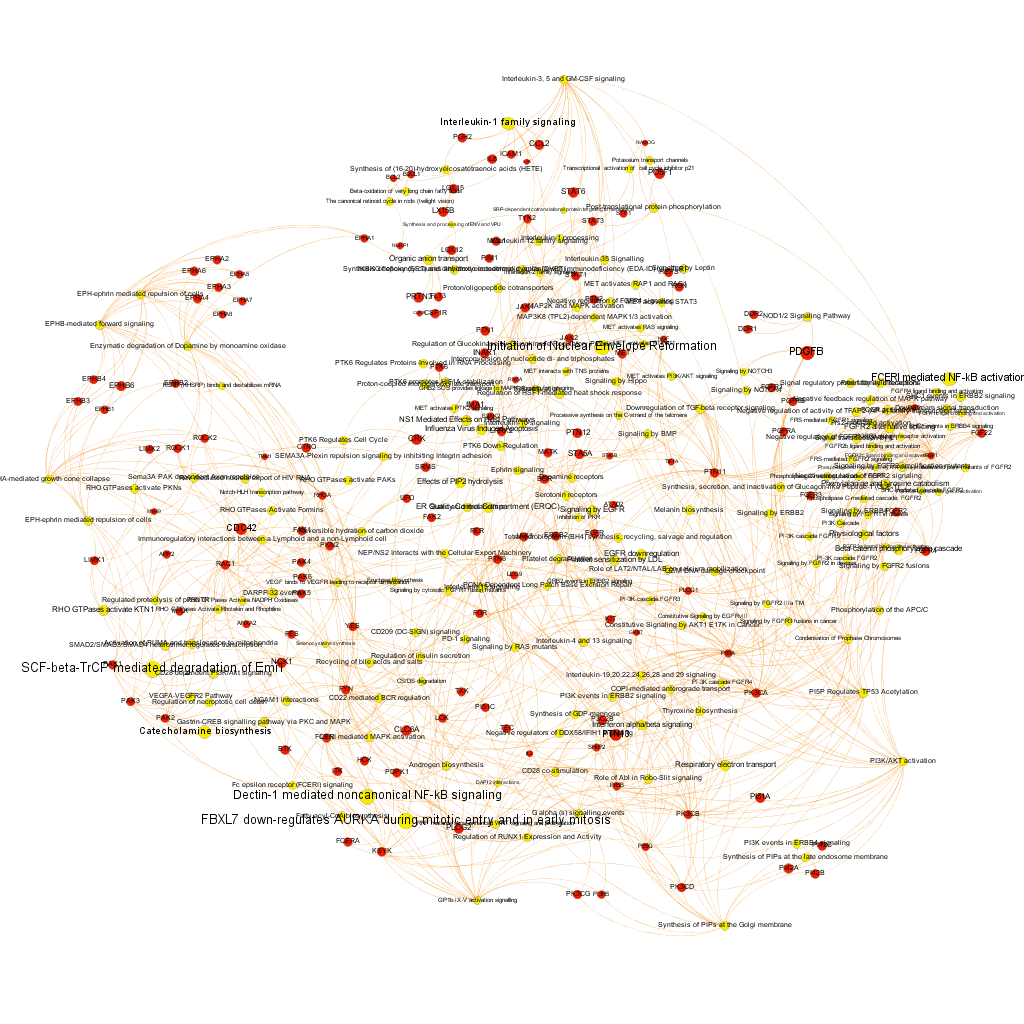
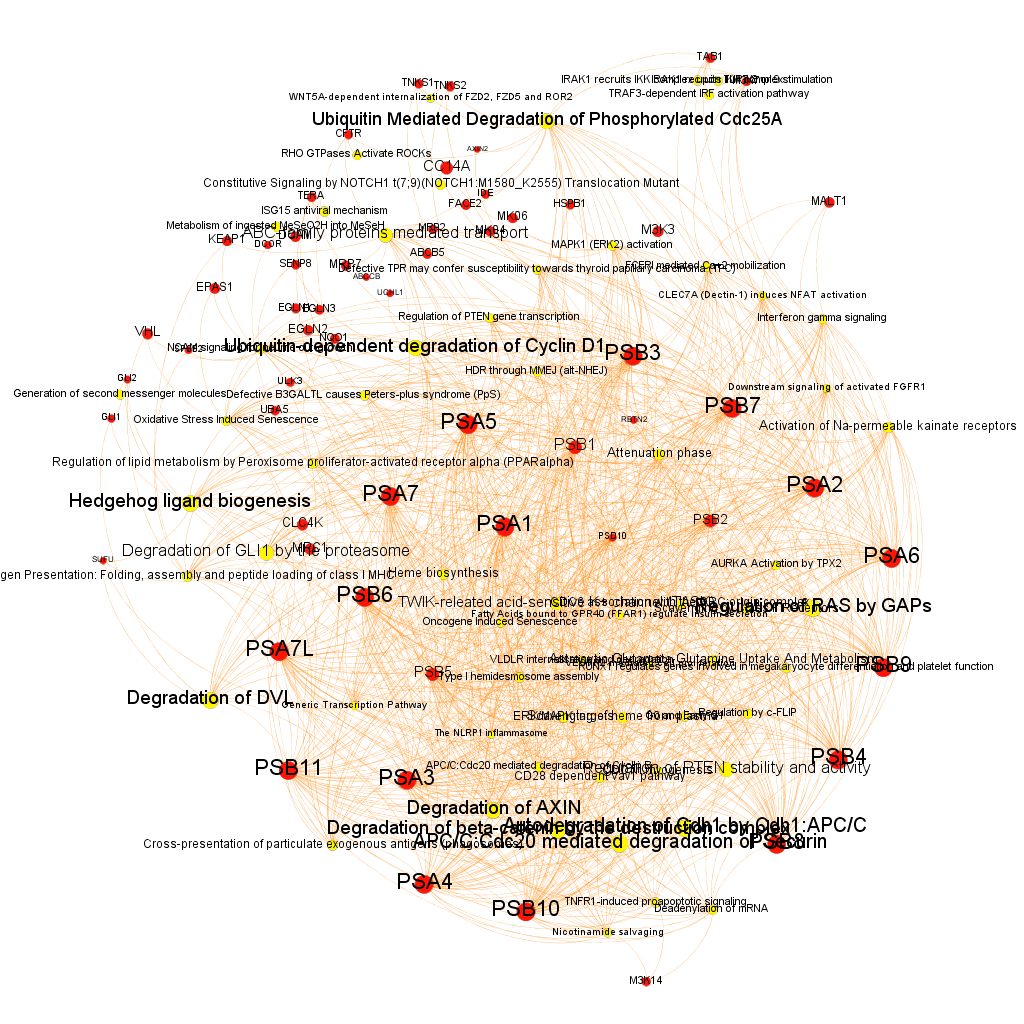
This is the aspect that the whole set of relationships between targets and pathways has, but the graphs can be queried by potency of nodes, or proximity to a particular node. We can see it in the next graphs


… or we can get those that are closer to SMN protein.

We can even try to classify the graph components in different modules as a function of the closeness of their relations.

And query and reshape by module. Below, four of the most populated clusters.