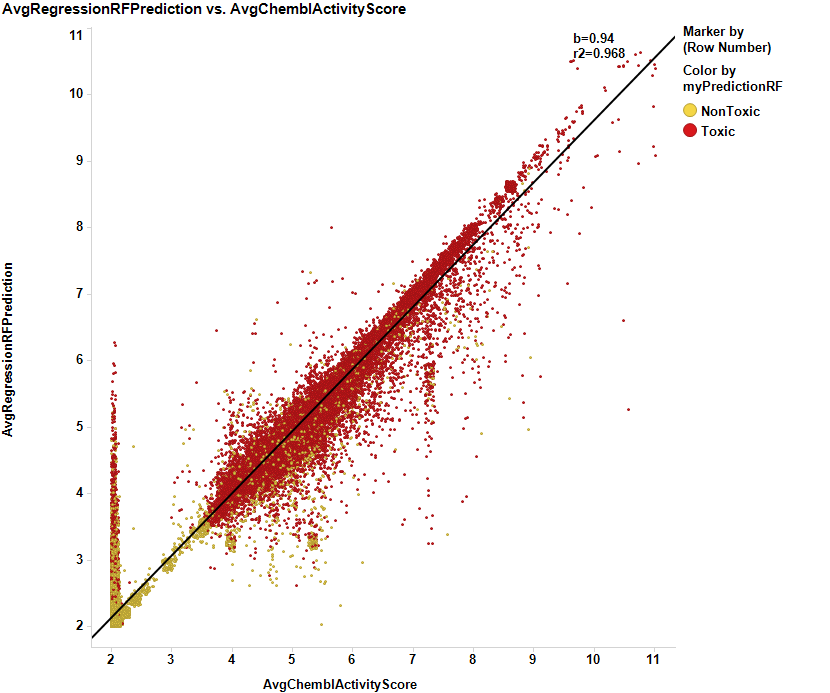
Regression, rather than classification has been the approach taken for cytotoxicity, as a mere cytotoxicity flag could lead to discarding compounds with a much higher potency in a particular assay than the score predicted for cell death or growth. With a predicted potency value, we can calculate a therapeutic index when these data are joined to other predictions.
The graph shows the individual correlation results of regressions calculated in six separated experiments.
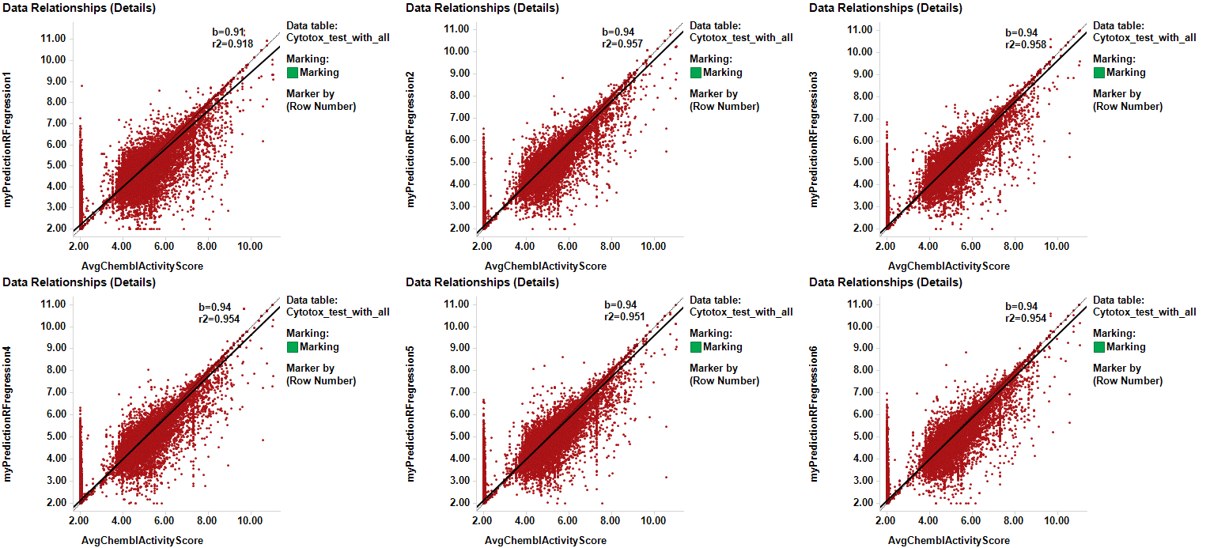
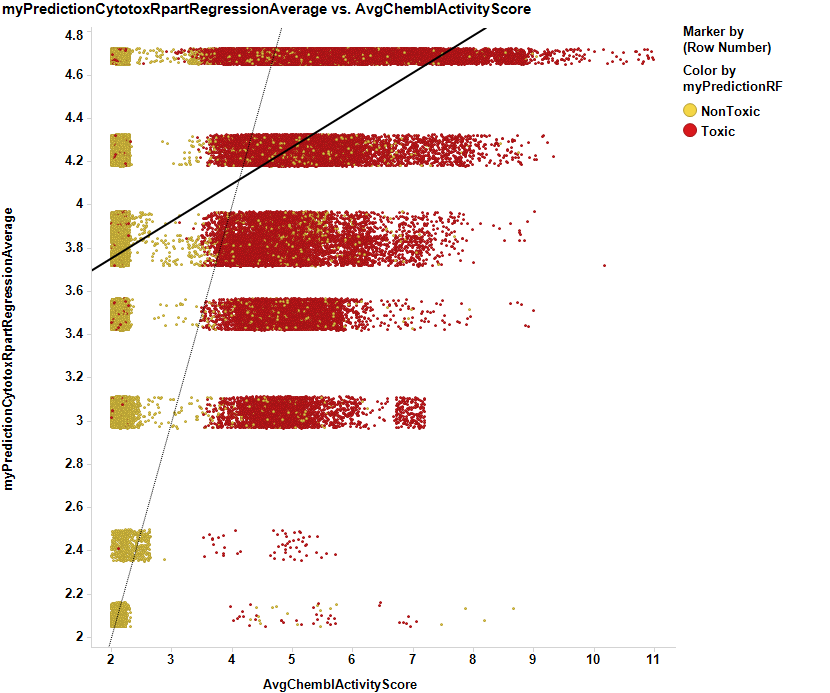
Decision tree predictions result in poor quality indicators, with a strong bias to underestimate potency.
Average random forests regression for cytotoxicity. Each prediction is the average per row of 6 independent regressions. The correlation coefficients for the averaged predictions related to independent predictions is improved.
 s leo.
IIn general, correlation between estimations and actual data are quite good, with an outstanding confirmation rate for activity scores, above 6. An average of 3 regression results will be taken for the predictions to be carried out in the overall dataset.