All the interactions of these proteins linked to SARS pathways annotated in Reactome DB with actual or predicted SARS active compounds.
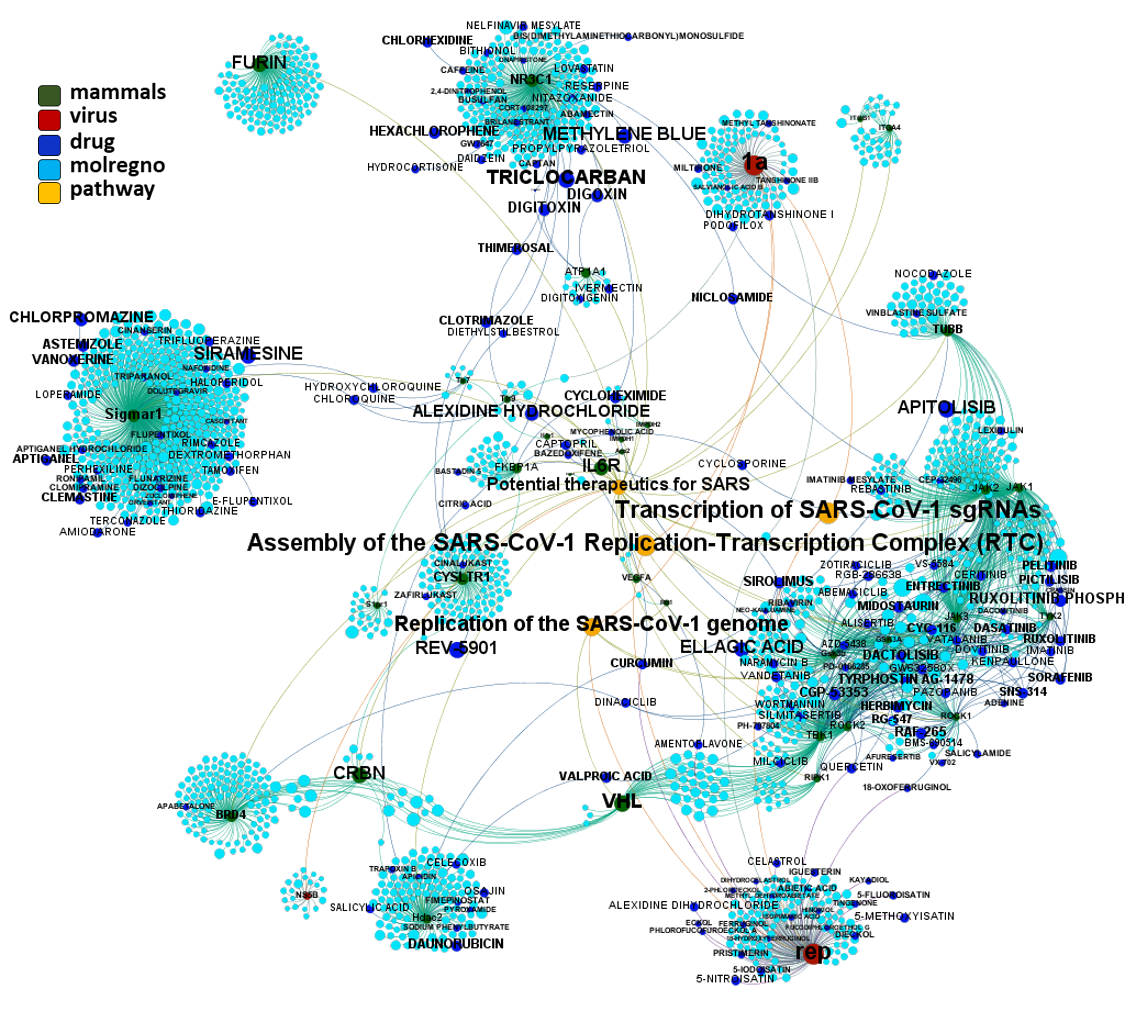
All proteins linked to SARS pathways annotated in Reactome DB interaction map. Protein colors by organism.
Note how SARS pathways from reactome contain proteins identified by drTarget algorithms as relevant for coronavirus infections.
| geneName | protName | avgSARSScore | kindOfValue | organismType | Degree | protein_class_name |
| rep | Replicase polyprotein 1ab | 5.23983187 | actual | virus | 147 | Enzyme |
| 1a | Replicase polyprotein 1a | 5.146501741 | actual | virus | 101 | Enzyme |
| VHL | von Hippel-Lindau disease tumor suppressor | 4.412667156 | actualAndPredicted | mammals | 43 | Unclassified protein |
| FURIN | Furin | 3.804257957 | predicted | mammals | 169 | Serine protease S8B subfamily |
| CRBN | Protein cereblon | 4.397967462 | actualAndPredicted | mammals | 19 | Unclassified protein |
| Sigmar1 | Sigma non-opioid intracellular receptor 1 | 2.816706135 | actualAndPredicted | mammals | 692 | Membrane receptor, Other membrane protein |
| NR3C1 | Glucocorticoid receptor | 2.841753598 | actualAndPredicted | mammals | 348 | Nuclear hormone receptor subfamily 3 group C member 1 |
| CYSLTR1 | Cysteinyl leukotriene receptor 1 | 3.065313119 | actualAndPredicted | mammals | 182 | Leukotriene receptor |
| BRD4 | Bromodomain-containing protein 4 | 2.729343003 | actualAndPredicted | mammals | 218 | Bromodomain |
| IL6R | Interleukin-6 receptor subunit alpha | 4.640871157 | actual | mammals | 1 | Membrane receptor, Secreted protein |
| JAK2 | Tyrosine-protein kinase JAK2 | 2.364319566 | actualAndPredicted | mammals | 328 | Tyrosine protein kinase JakA family, Tyrosine protein kinase JakB family |
| TUBB | Tubulin beta chain | 2.879798395 | actualAndPredicted | mammals | 92 | Structural protein |
| JAK1 | Tyrosine-protein kinase JAK1 | 2.409715954 | actualAndPredicted | mammals | 195 | Tyrosine protein kinase JakA family, Tyrosine protein kinase JakB family |
| JAK3 | Tyrosine-protein kinase JAK3 | 2.312167295 | actualAndPredicted | mammals | 197 | Tyrosine protein kinase JakA family, Tyrosine protein kinase JakB family |
| Hdac2 | Histone deacetylase 2 | 2.364636615 | actualAndPredicted | mammals | 173 | HDAC class I |
| FKBP1A | Peptidyl-prolyl cis-trans isomerase FKBP1A | 2.811545153 | actualAndPredicted | mammals | 57 | Isomerase |
| TBK1 | Serine/threonine-protein kinase TBK1 | 2.492399882 | actualAndPredicted | mammals | 113 | Other protein kinase IKK family |
| ATP1A1 | Sodium/potassium-transporting ATPase subunit alpha-1 | 3.00165687 | actualAndPredicted | mammals | 25 | Hydrolase, Sodium potassium ATPase |
Predicted activities have been aggregated at the protein level into different scores attending to their potency, frequency of protein-molecule interactions, and specificity based on positive records vs total number of active records. Network graphs show all ChEMBL interactions of predicted active molecules. Barcharts and scatter plots show the aggregated potency against SARS-CoV (SARS_Score) vs the number of distinct molecular interactions for each protein (expressed as logged degree). Most interesting proteins attending to any of these values have been flagged in the scatter plots. Additional details as described in respective captions.
And how are these proteins linked to SARS pathways annotated in Reactome DB ranked by their combination of scores.
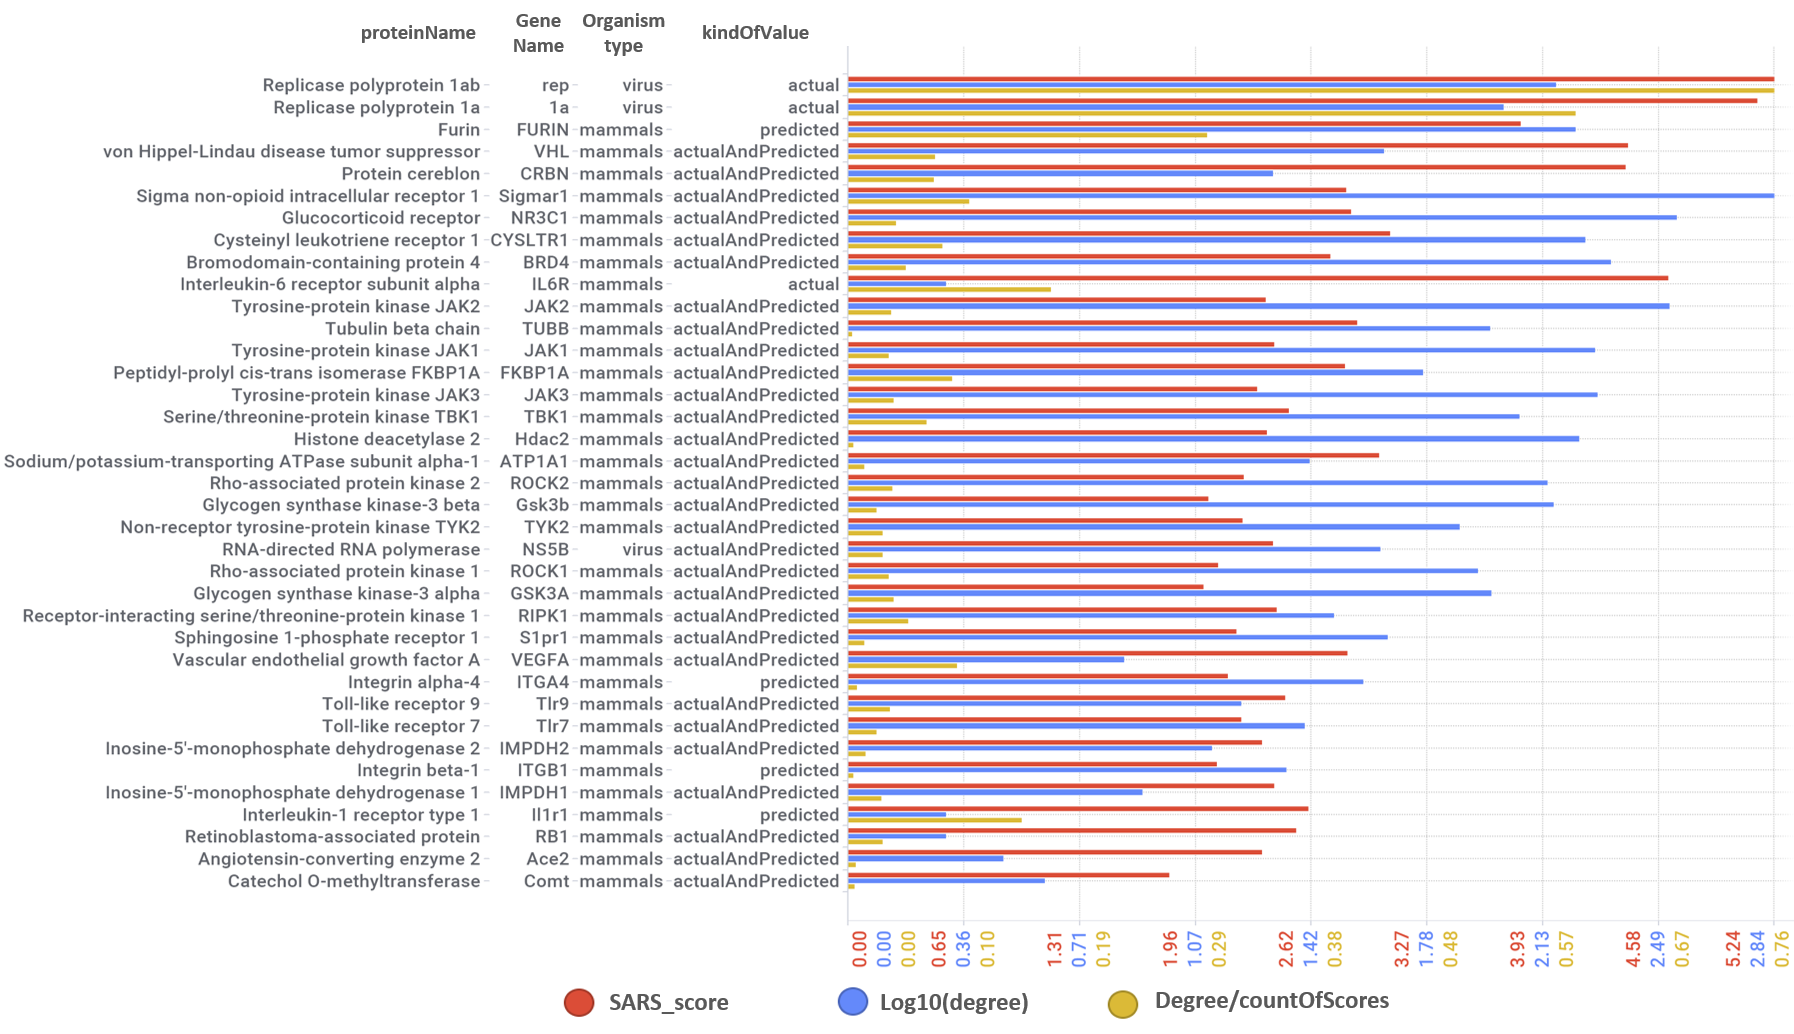
Log10(degree): logged number of interactions for each protein. SARS_Score: Aggregated score against coronavirus infection per protein. Size by Degree/CountOfScores represents the number of SARS active interactions vs total records per protein in ChEMBL.
Scatter plot flagging all ChEMBL proteins linked to SARS pathways annotated in Reactome DB. Note significant scores for SigmaR1, Jak & ROCK kinases, FURIN protease, viral replicases, FKBPs, histone deacetylase HDAC2, glucocorticoid receptor NR3C1, bromodomain protein BRD4, Ub-transference subunits like CRBN and VHL, leukotriene receptor CYSLTR1 and Interleukin-6 receptor.
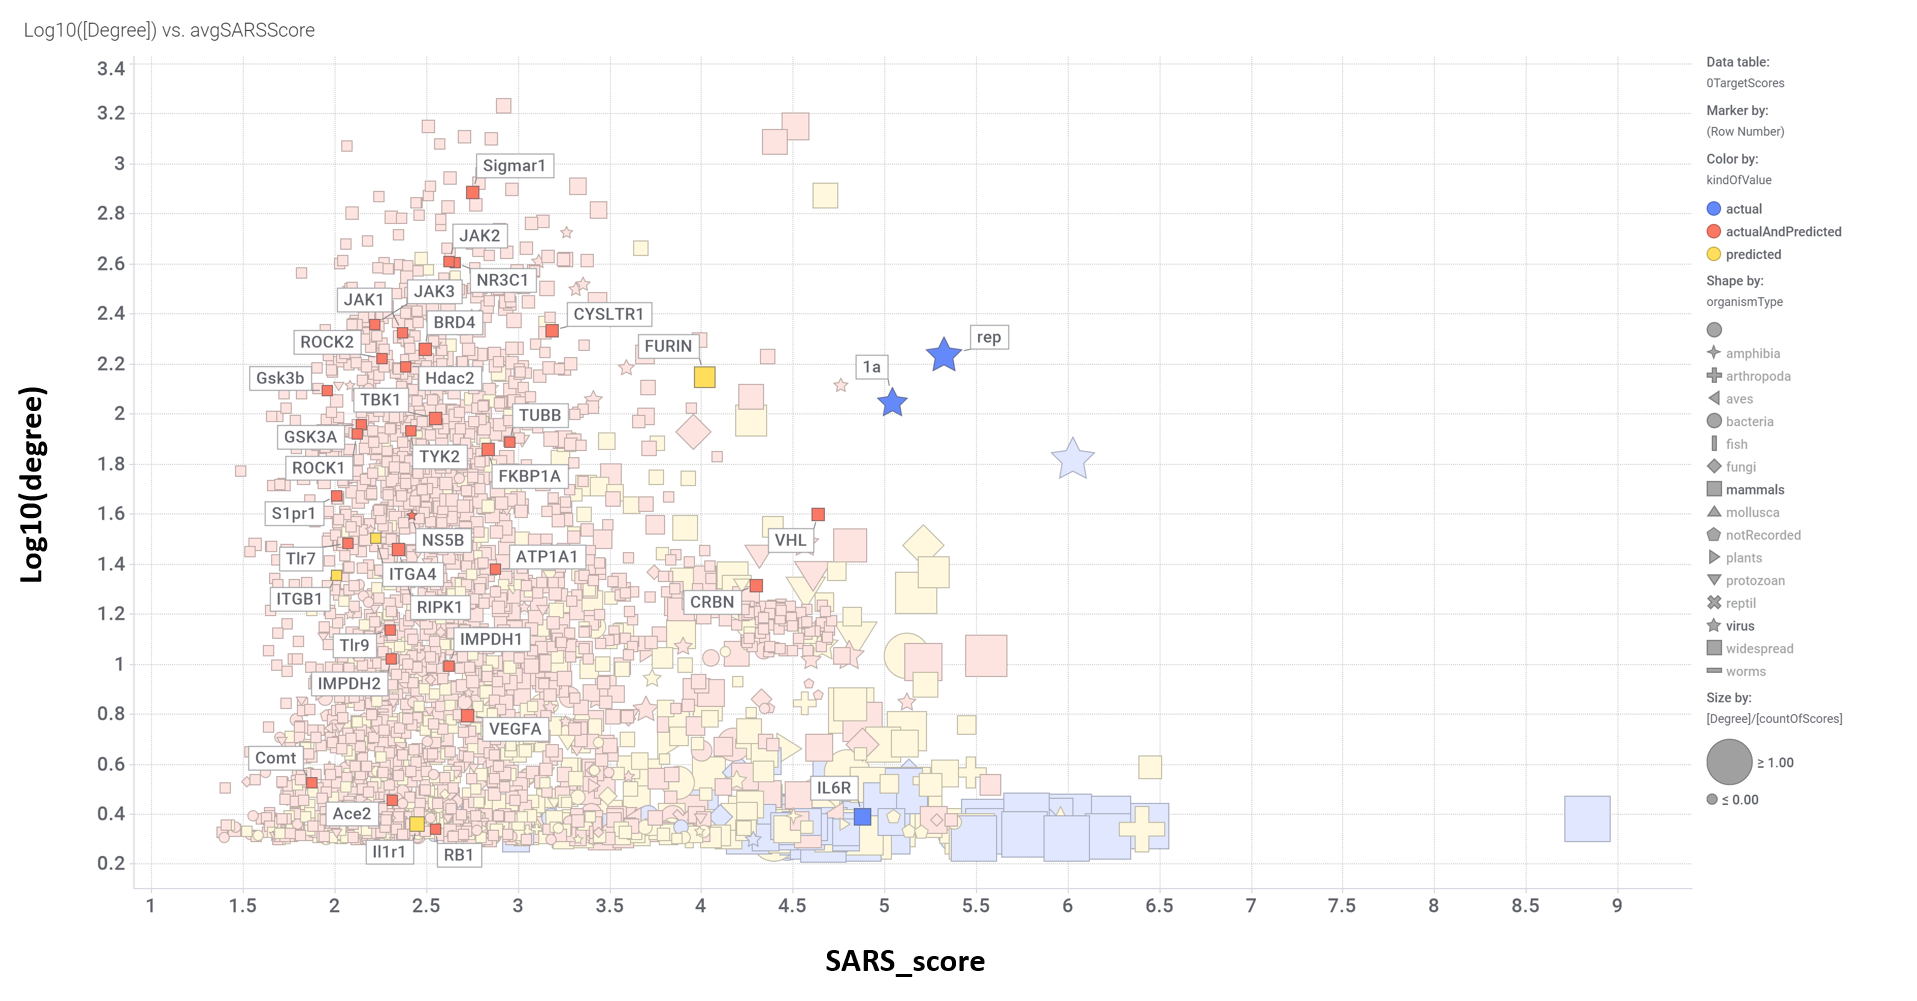
Aggregated SARS scores at the protein level: Log10(degree): logged number of interactions for each protein. SARS_Score: Aggregated score against coronavirus infection per protein. Size by Degree/CountOfScores represents the number of SARS actiove interactions vs total records per protein in ChEMBL. Color by condition of elements involved in score aggregation; they can be built from actual, predicted values or a combination of both. Shape indicates the organism type as described in the legend.