In this module, we will focus on the identification of promising protein targets for drugs intended to treat coronavirus infections.
The analysis is based in a machine learning exercise carried out on SARS viruses experimental records stored in ChEMBL and PubChem DBs and described in the Prediction of activity section in this web site.
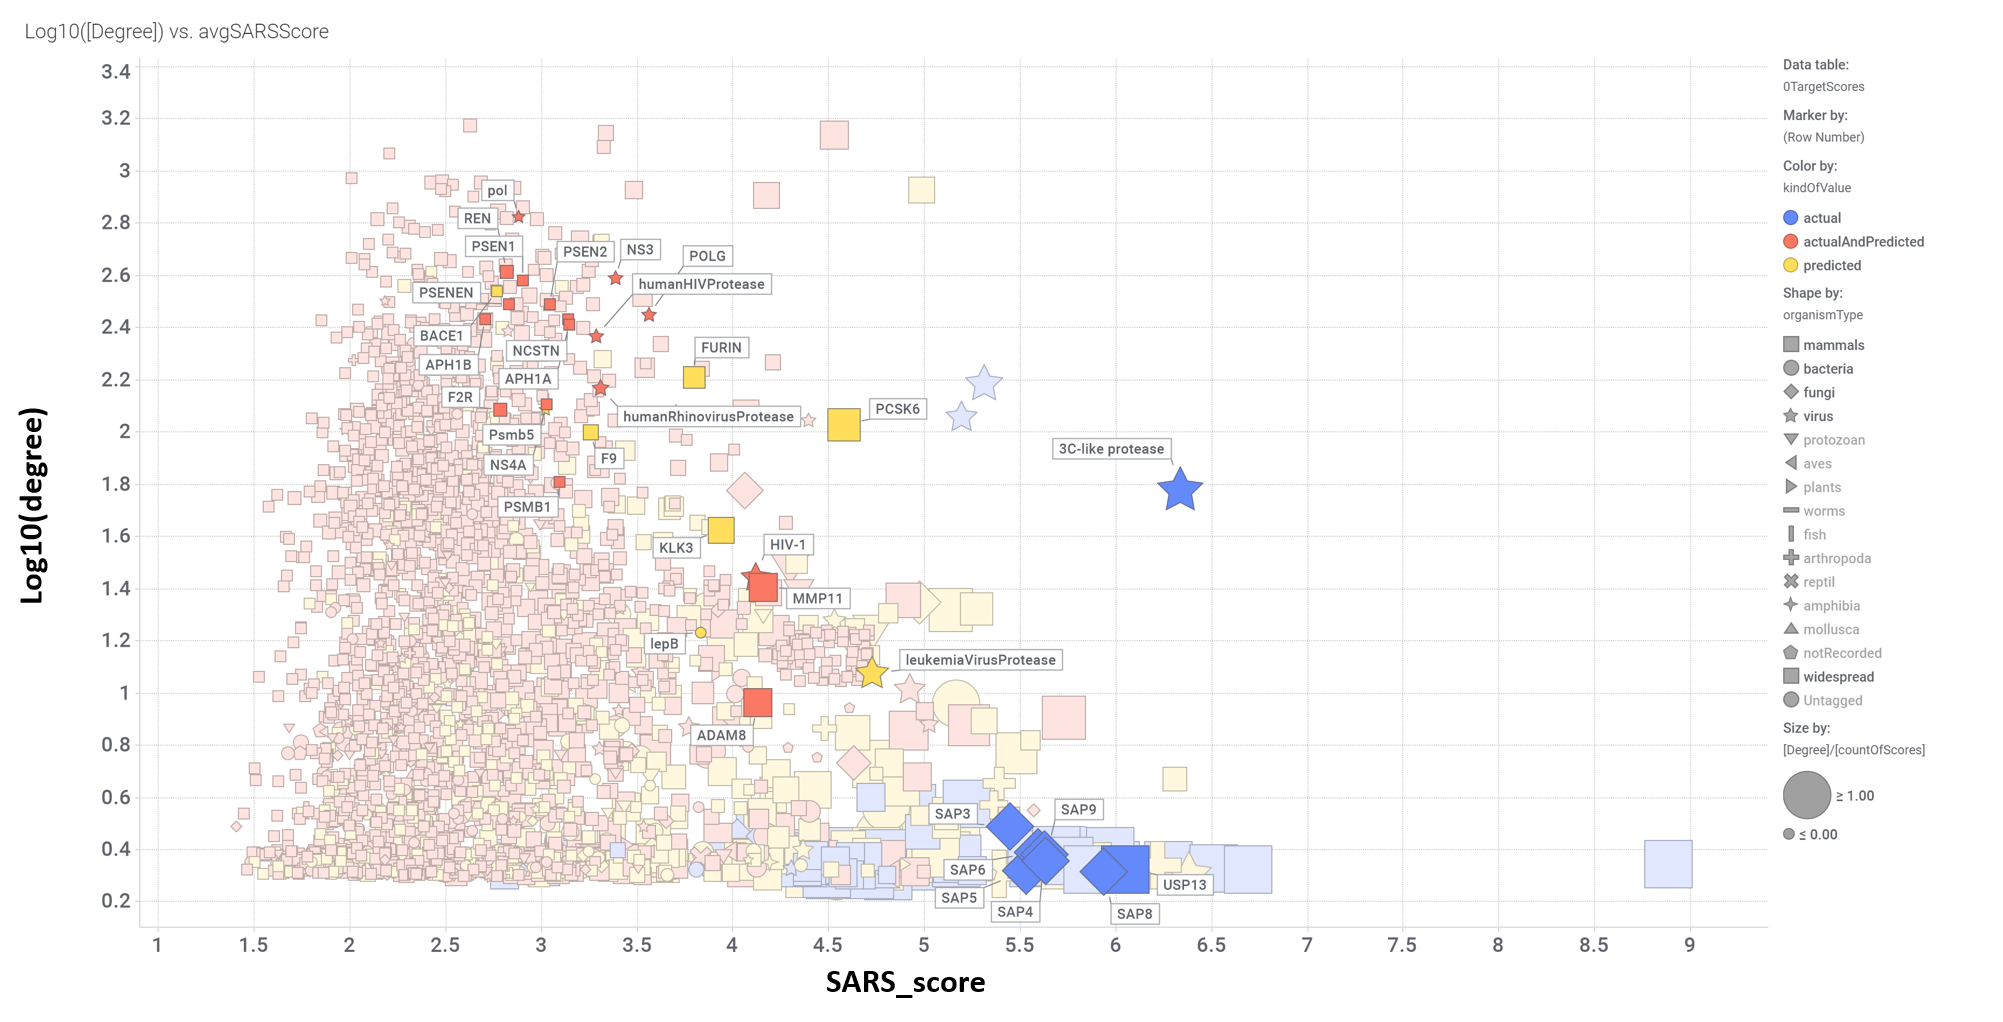
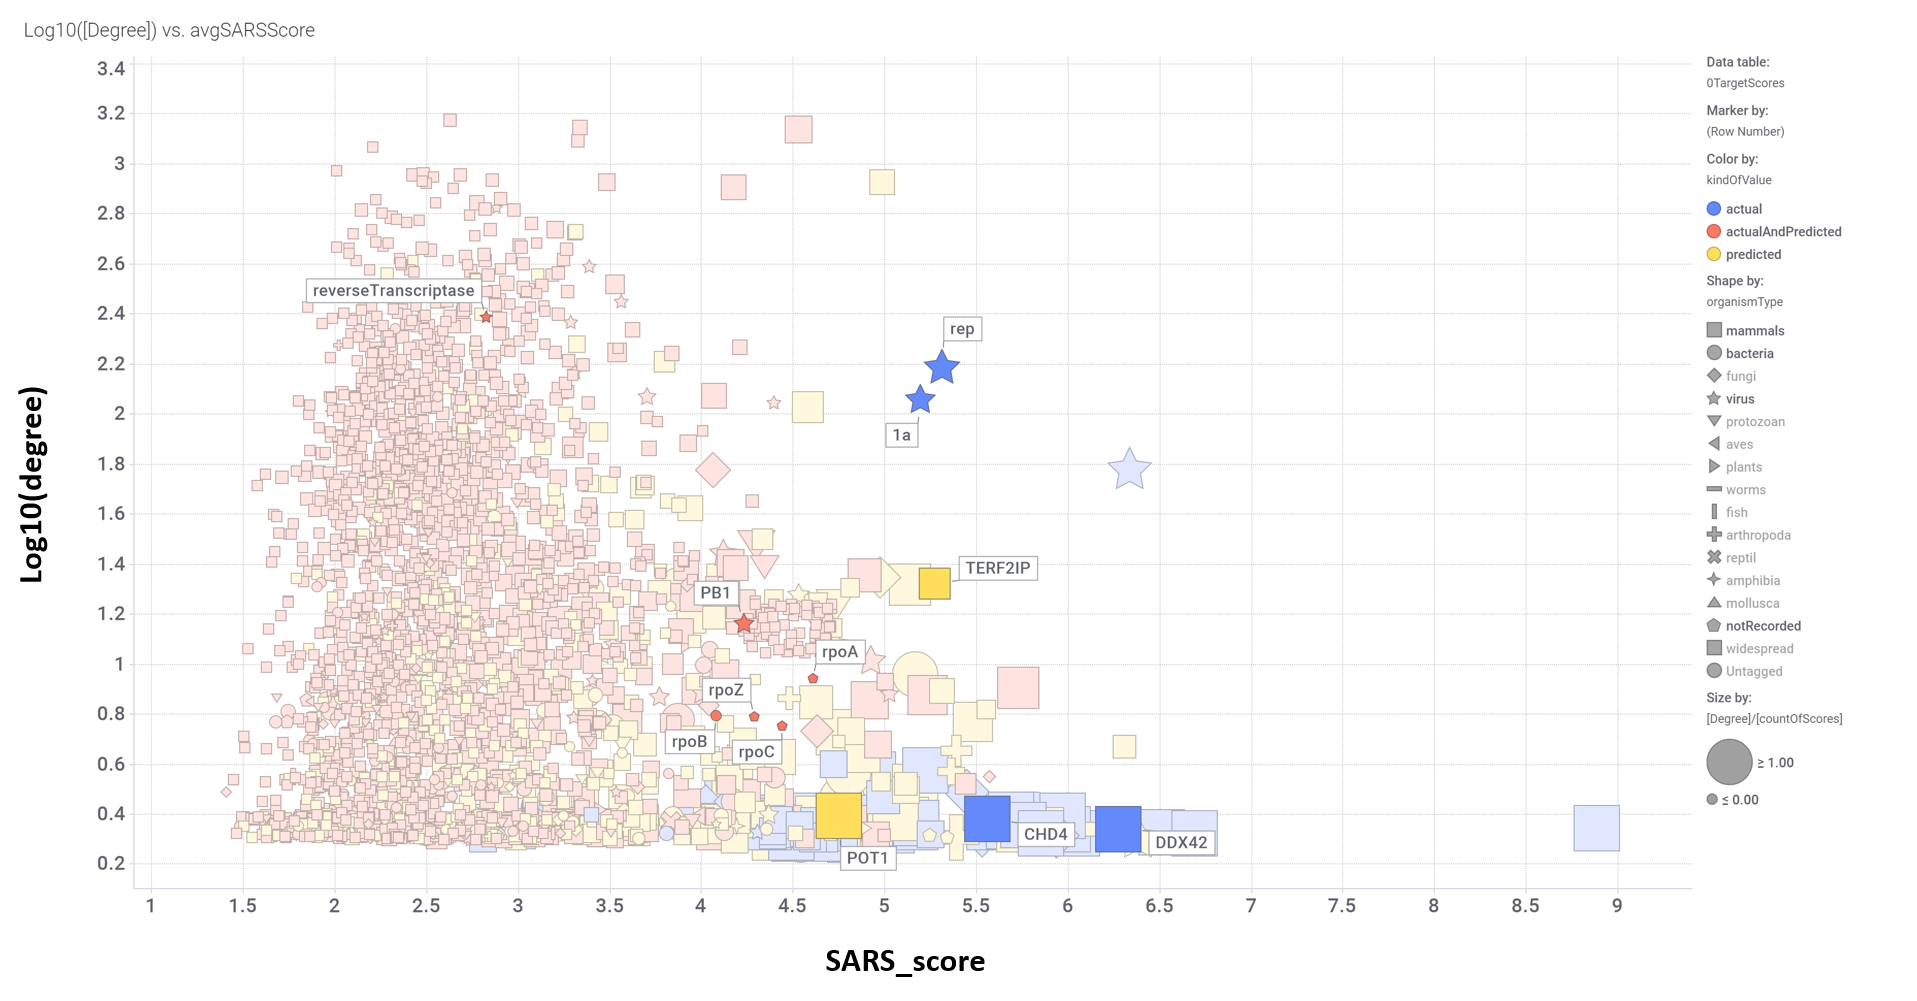
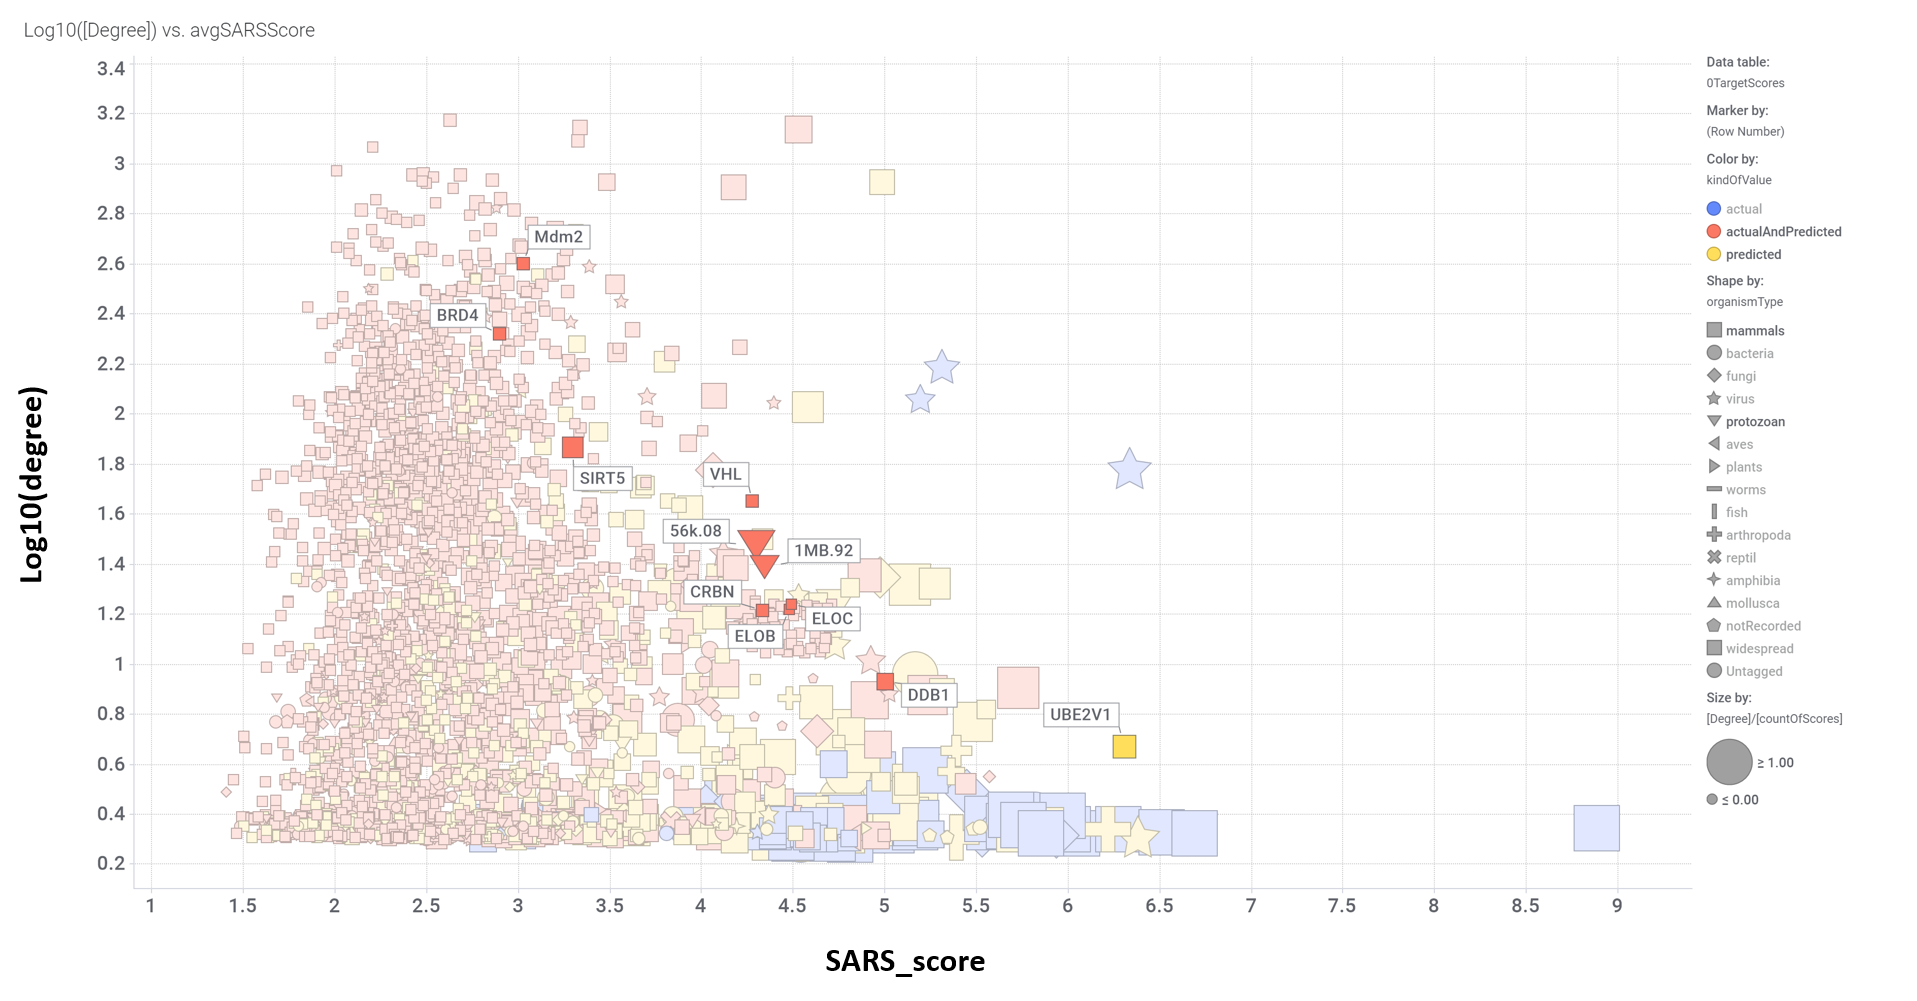
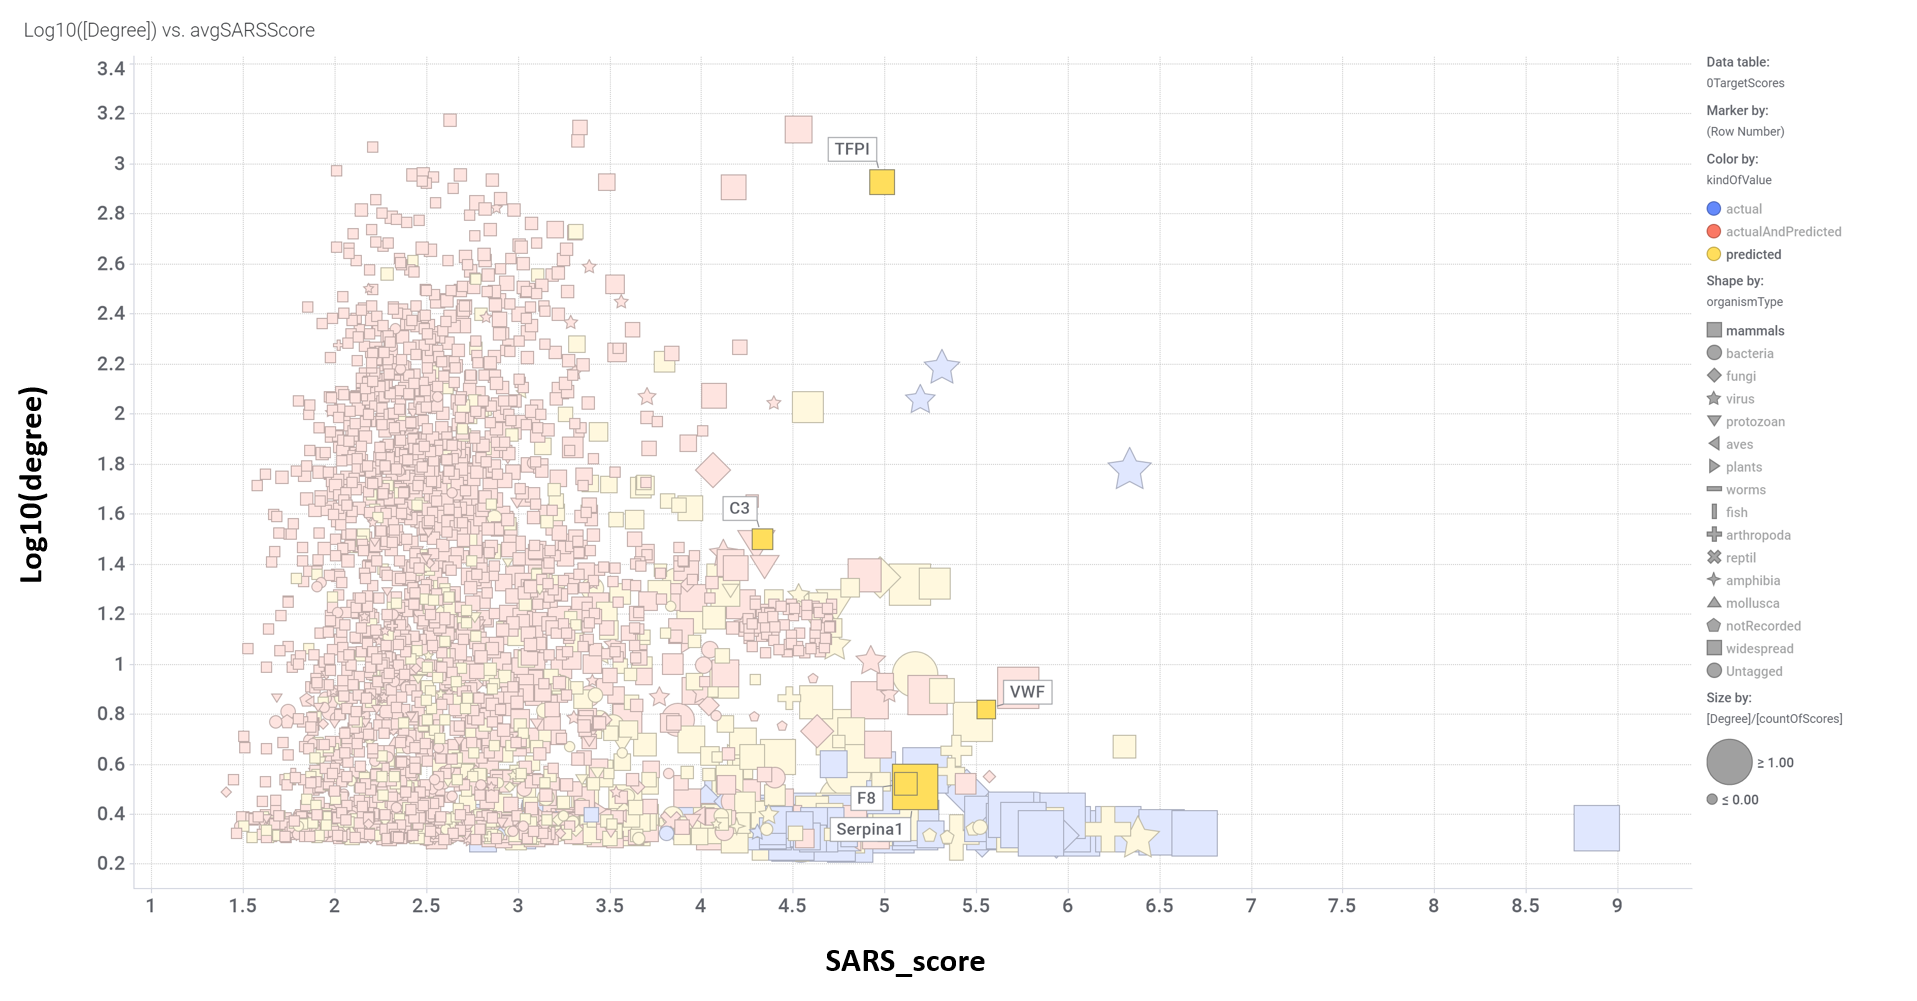
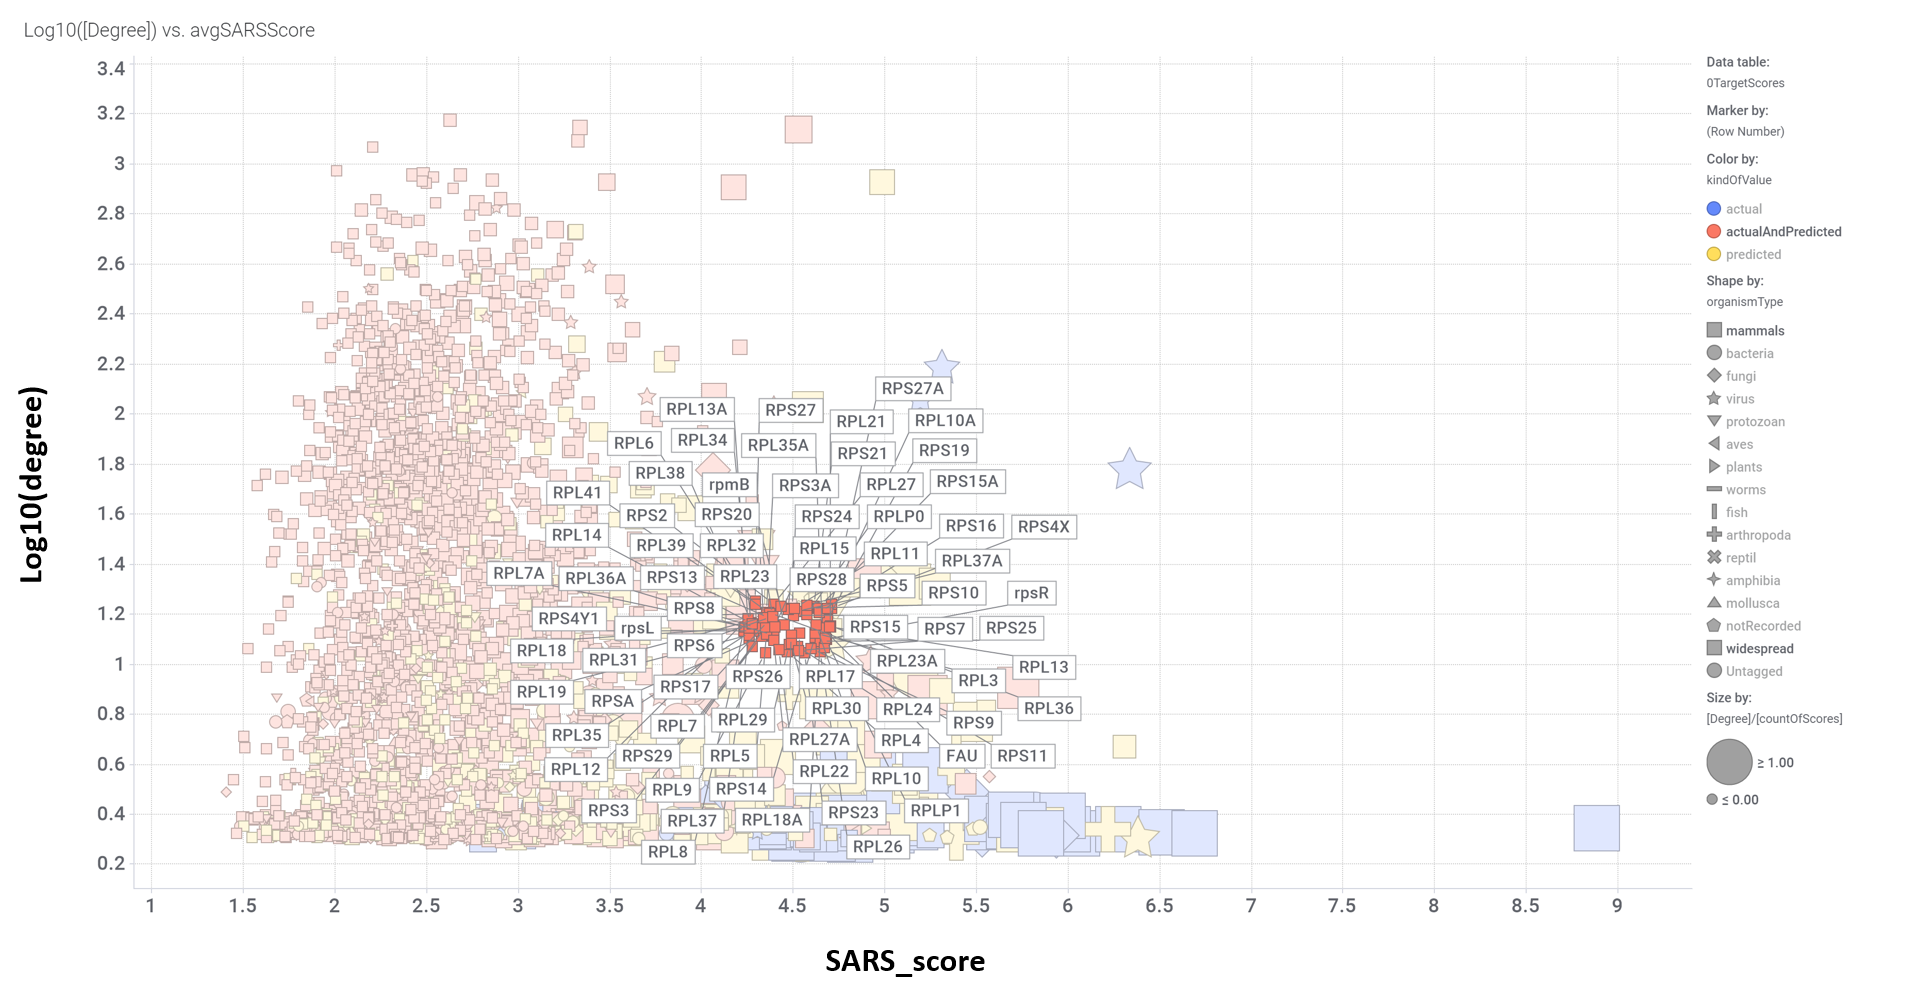
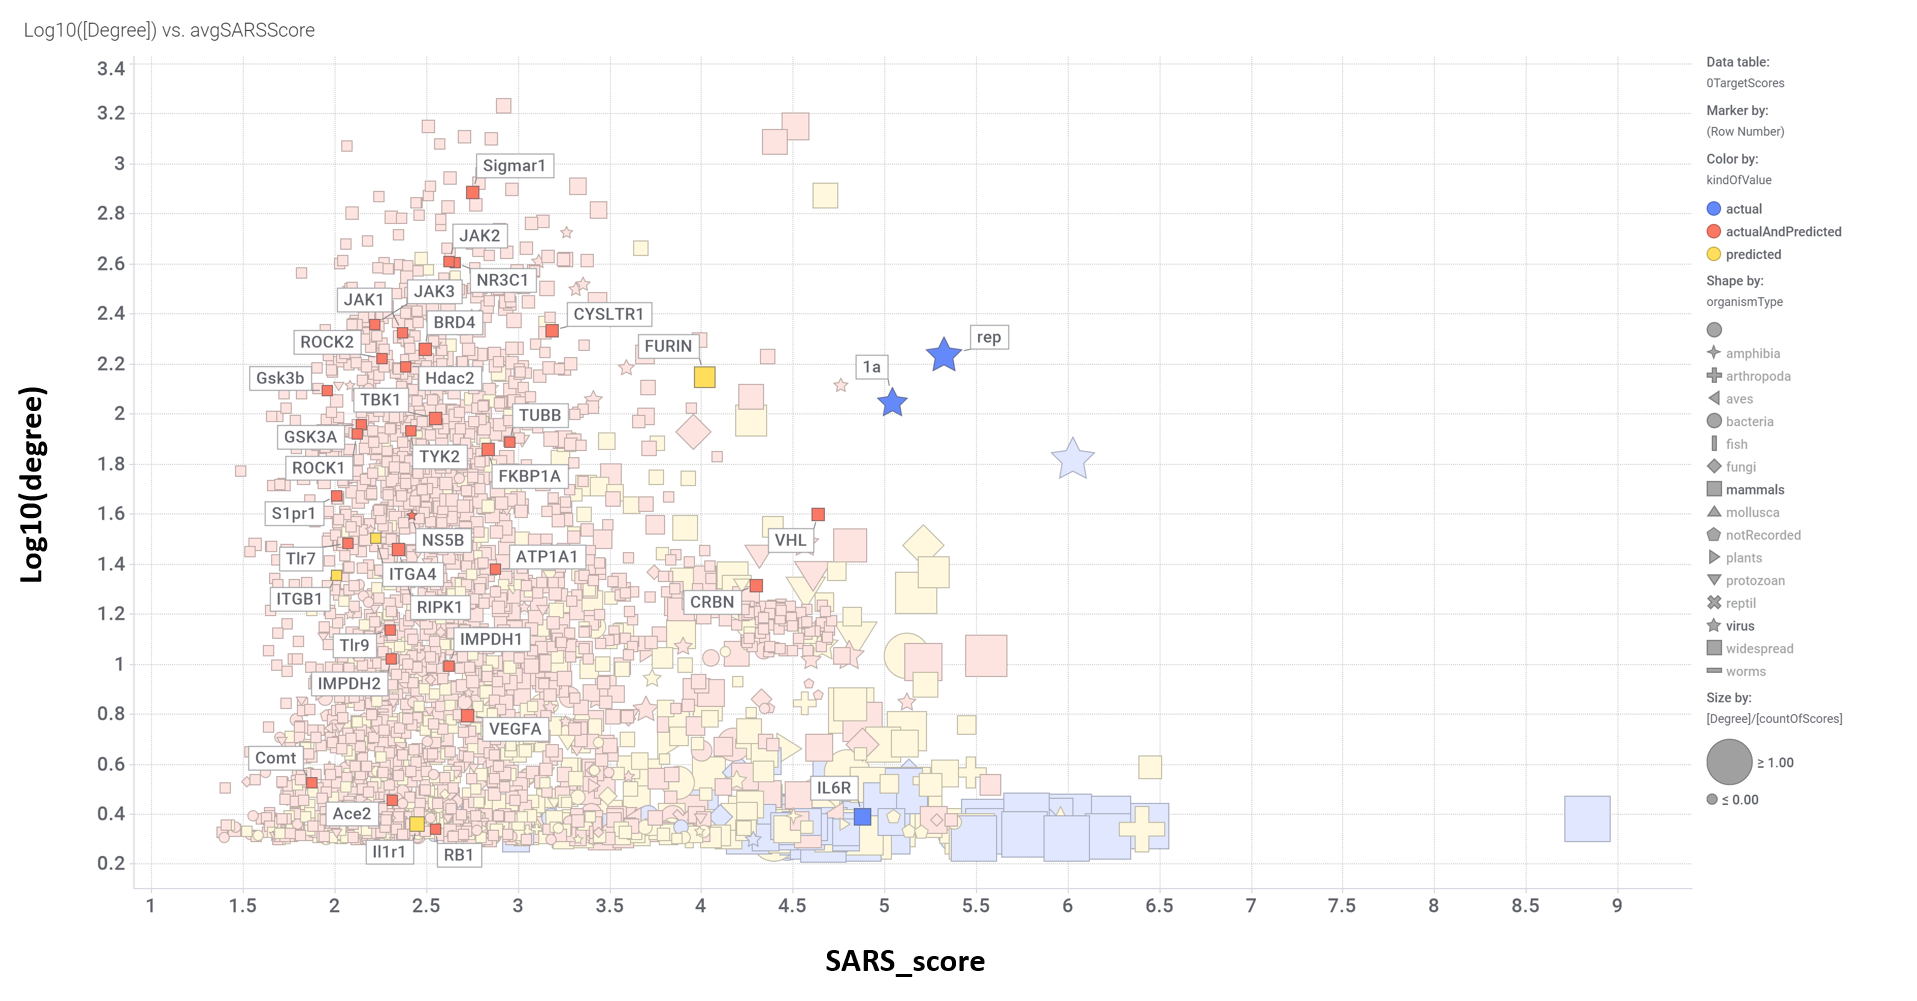
Predicted activities have been aggregated at the protein level into different scores attending to their potency, frequency of protein-molecule interactions, and specificity based on positive records vs total number of active records. The scatter plot below shows the aggregated potency against SARS-CoV (SARS_Score) vs the number of distinct molecular interactions for each protein (expressed as logged degree). Most interesting proteins attending to any of these values have been flagged. Additional details as described in caption.
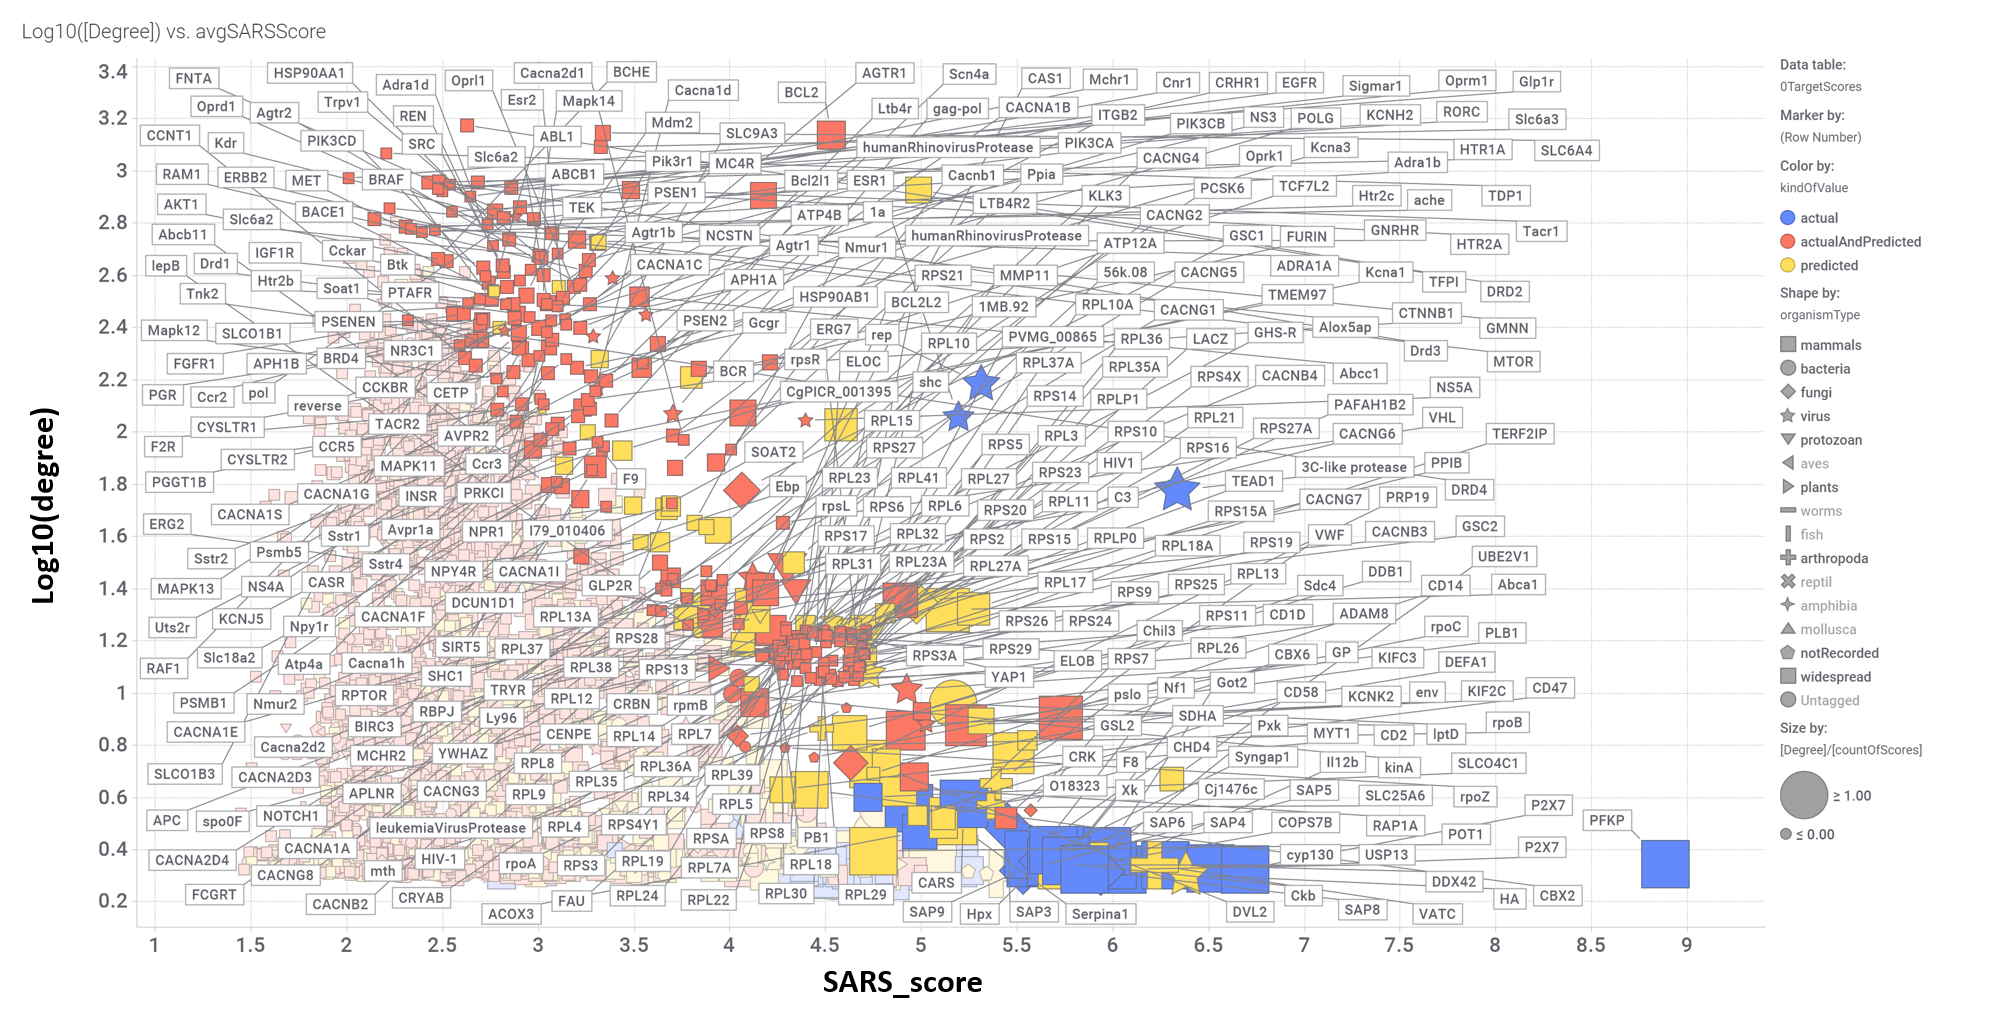
Aggregated SARS scores at the protein level: Log10(degree): logged number of interactions for each protein. SARS_Score: Aggregated score against coronavirus infection per protein. Size by Degree/CountOfScores represents the number of SARS active interactions vs total records per protein in ChEMBL. Color by condition of elements involved in score aggregation; they can be built from actual, predicted values or a combination of both. Shape indicates the organism type as described in the legend.
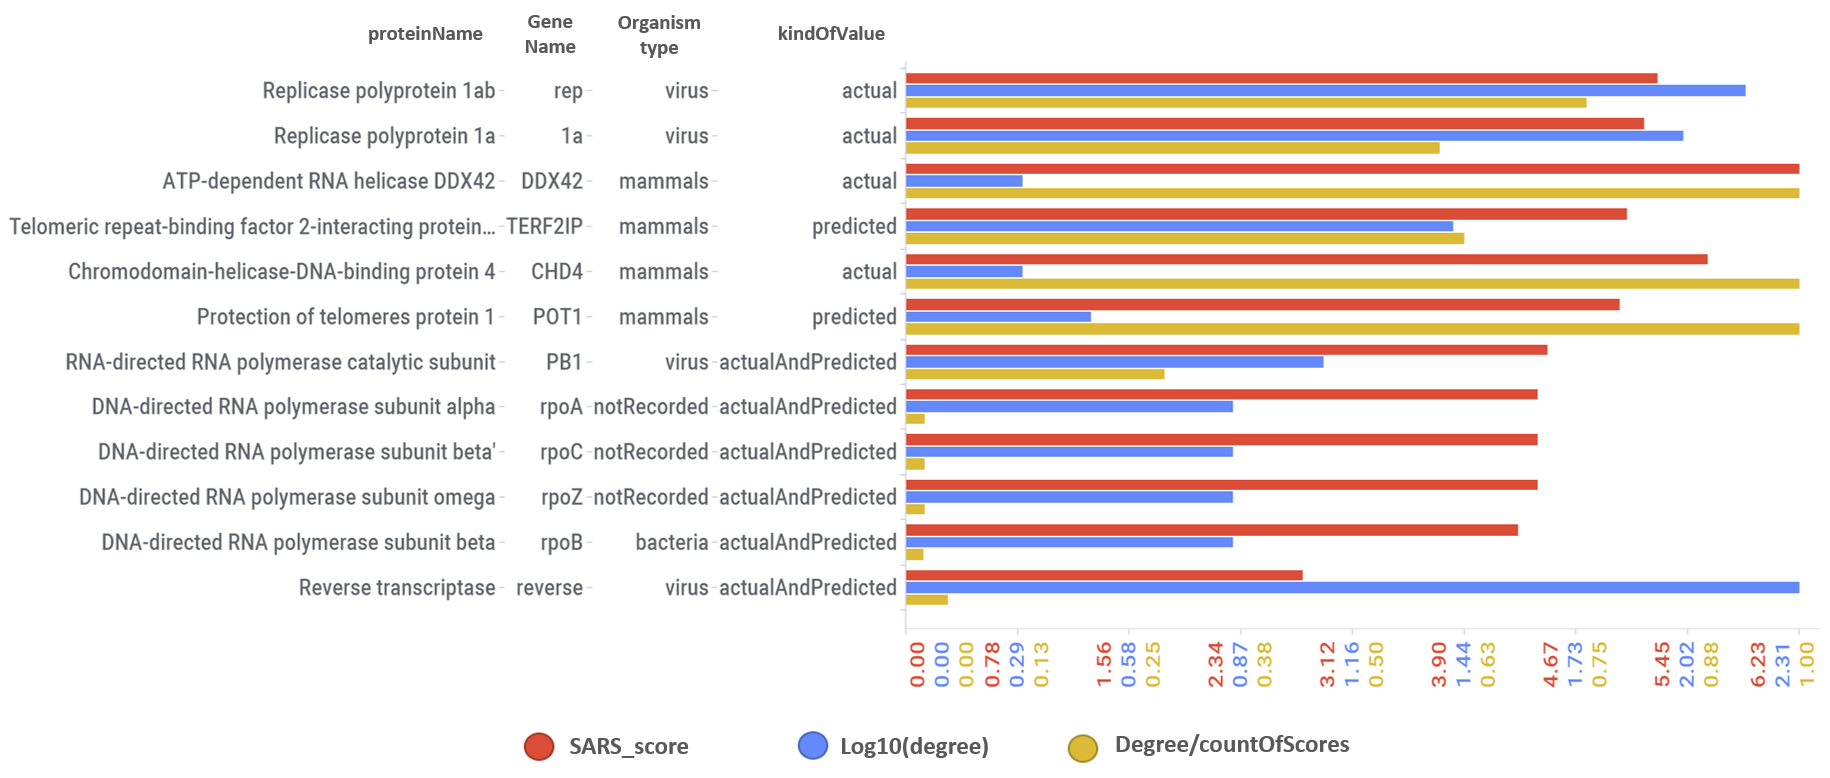
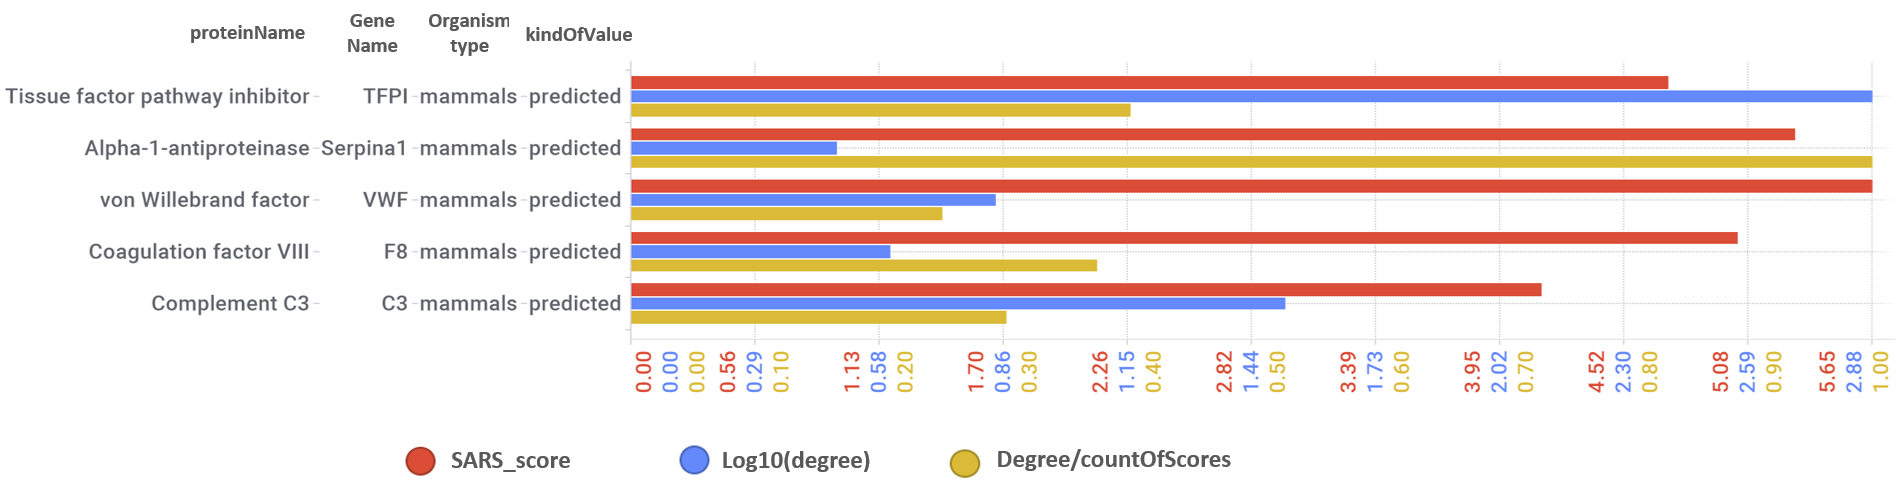
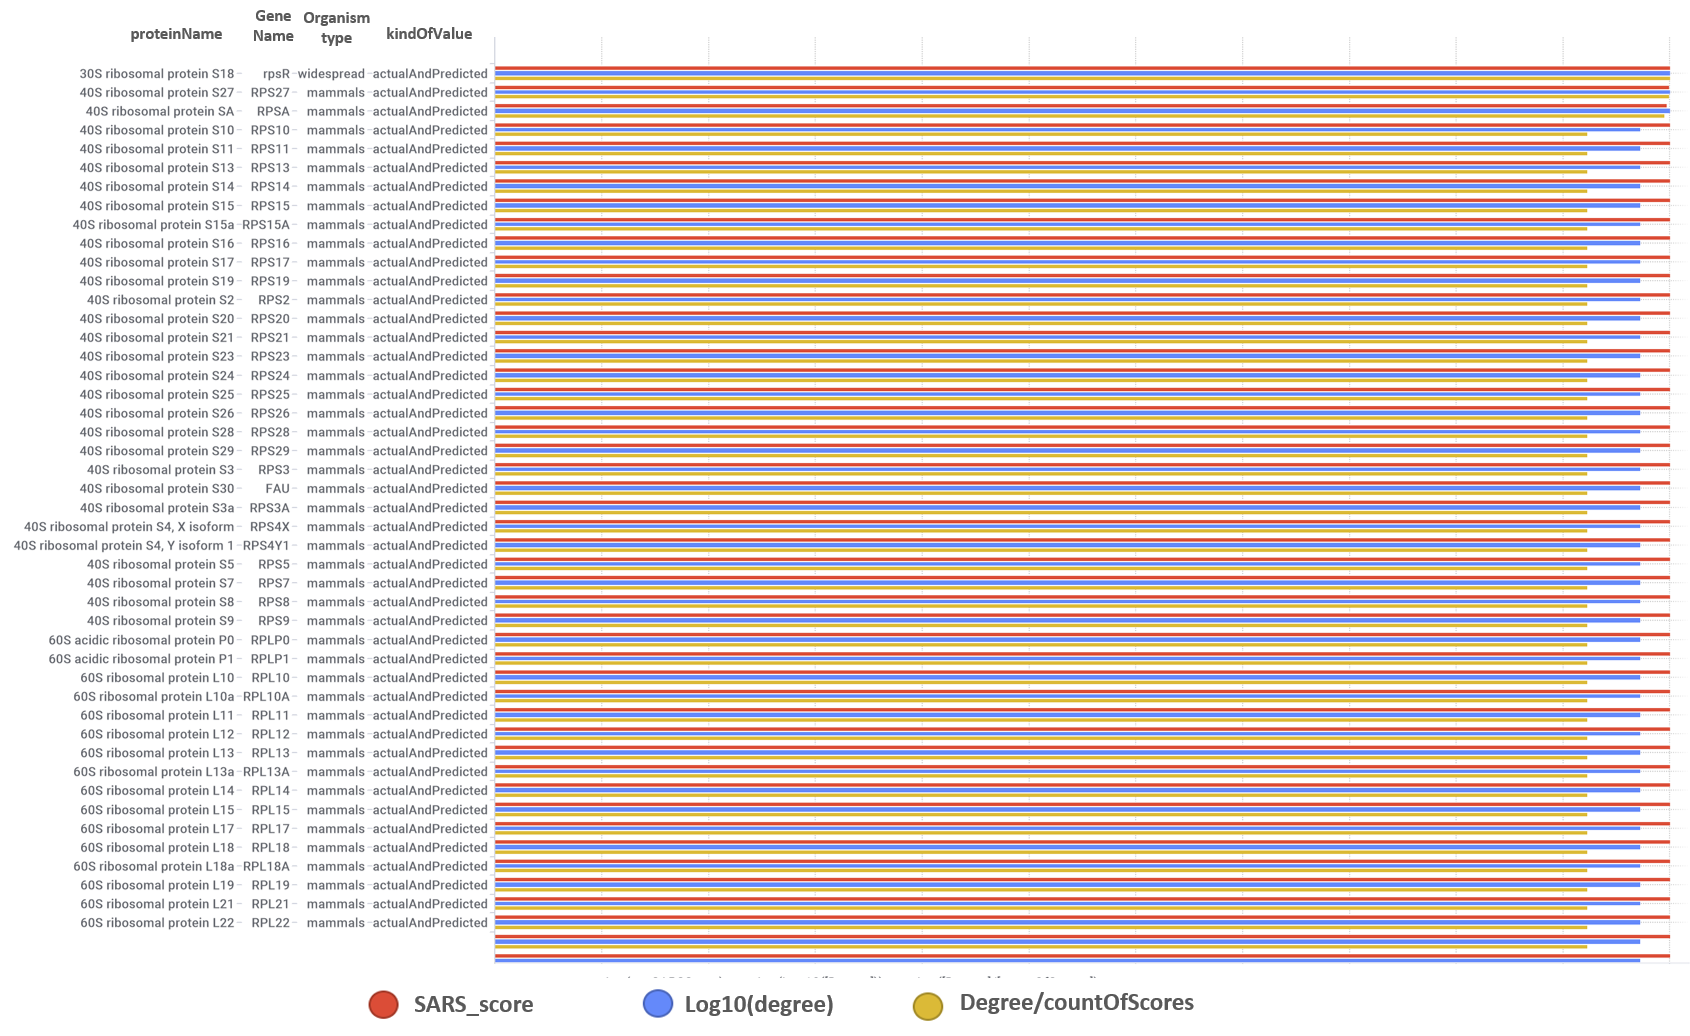
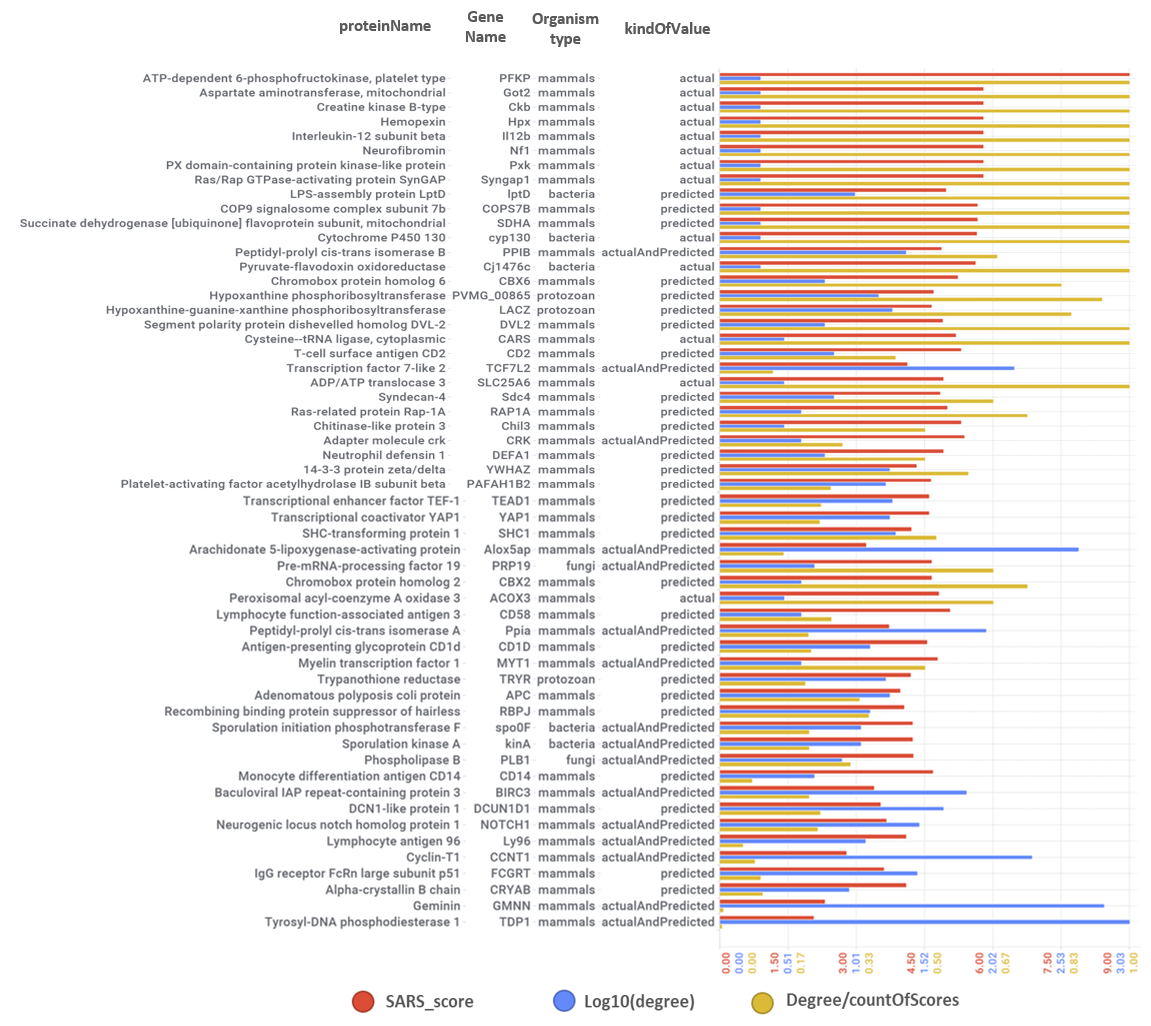
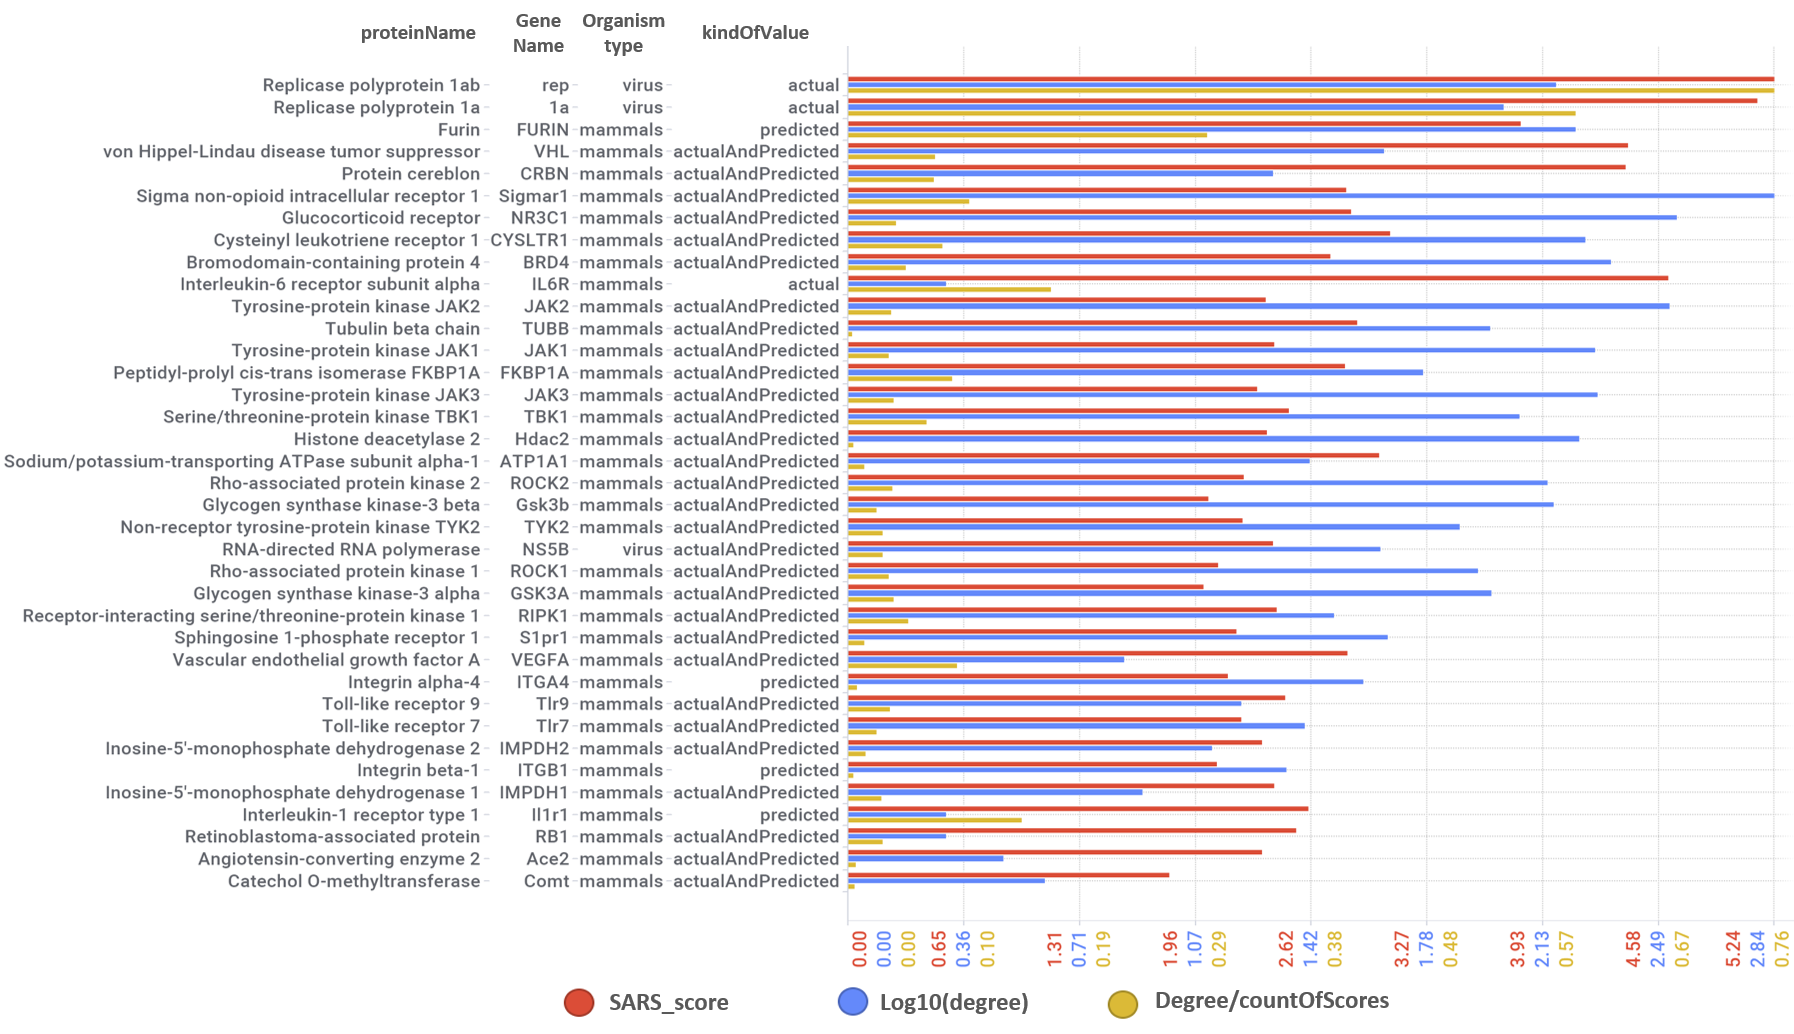
We can also see most relevant protein targets ranked by a combination of the three relevant scores: degree, SARS_Score and degre vs total number of records per protein (Degree/CountOfScores).
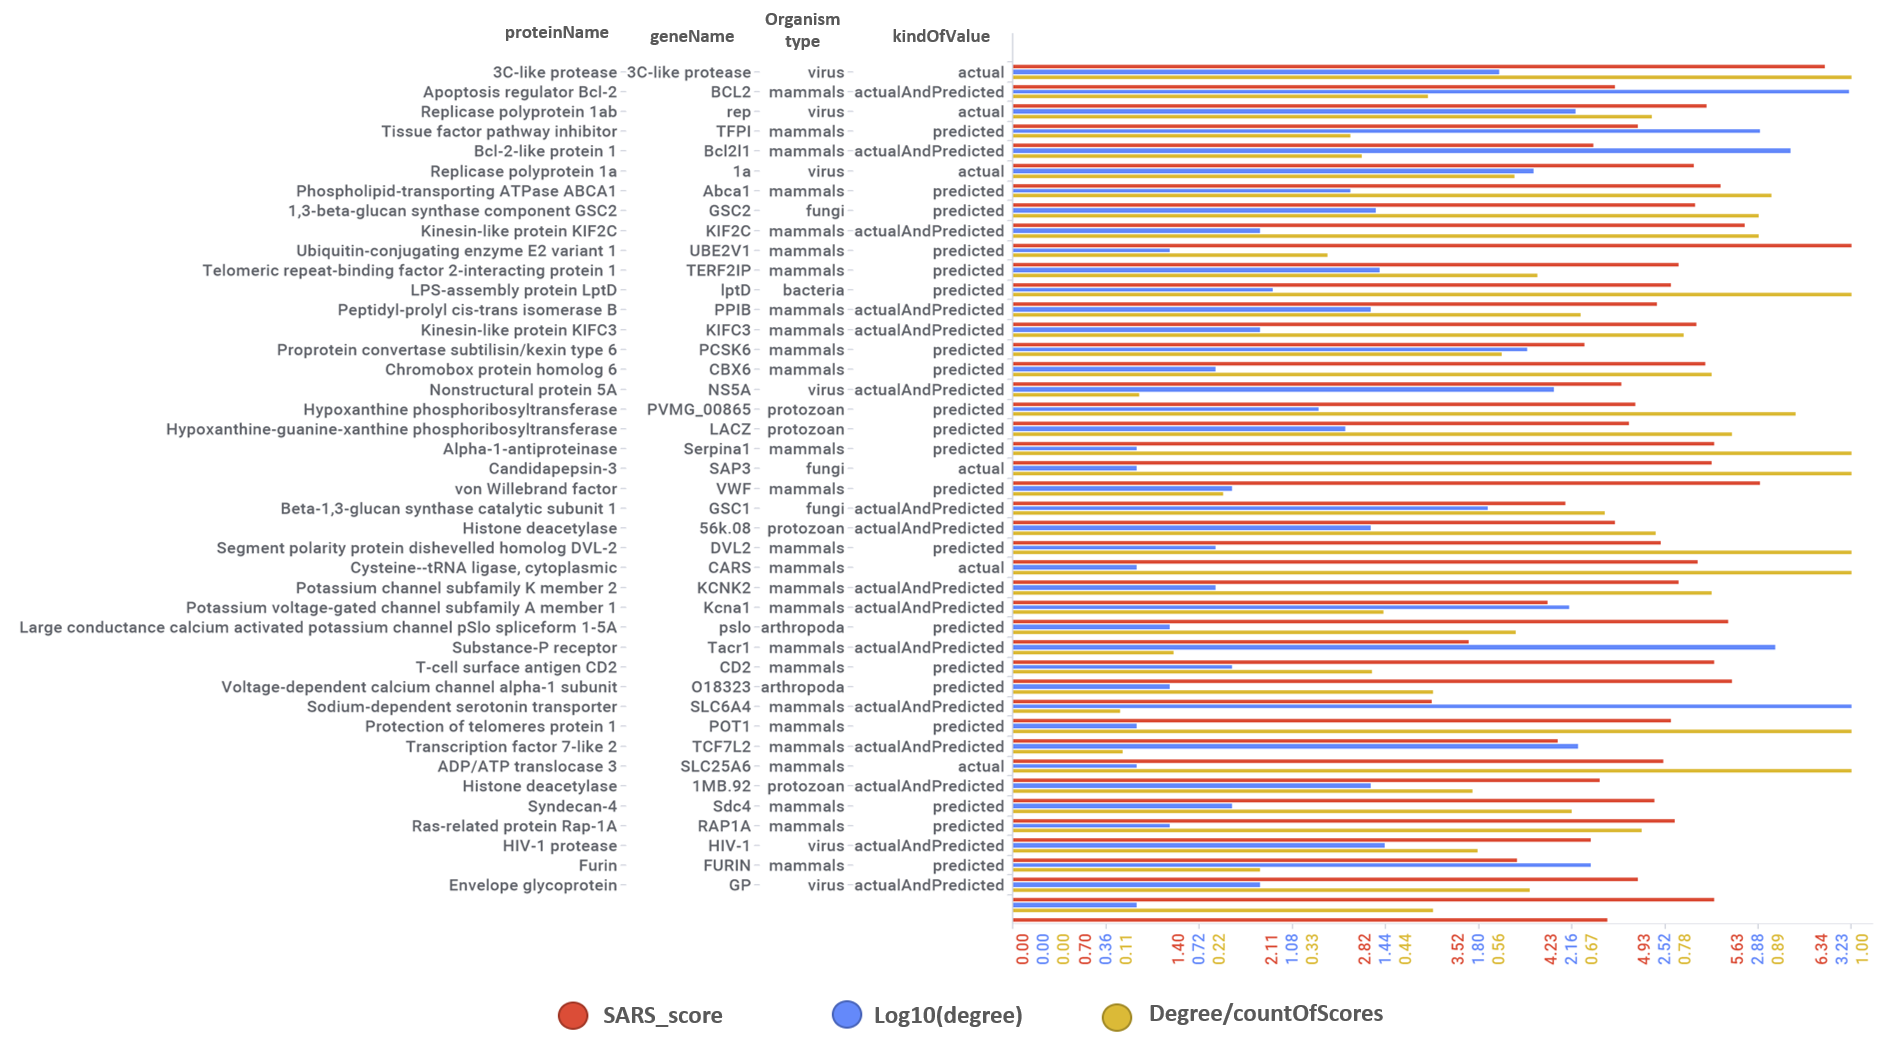
Log10(degree): logged number of interactions for each protein. SARS_Score: Aggregated score against coronavirus infection per protein. Size by Degree/CountOfScores represents the number of SARS active interactions vs total records per protein in ChEMBL.
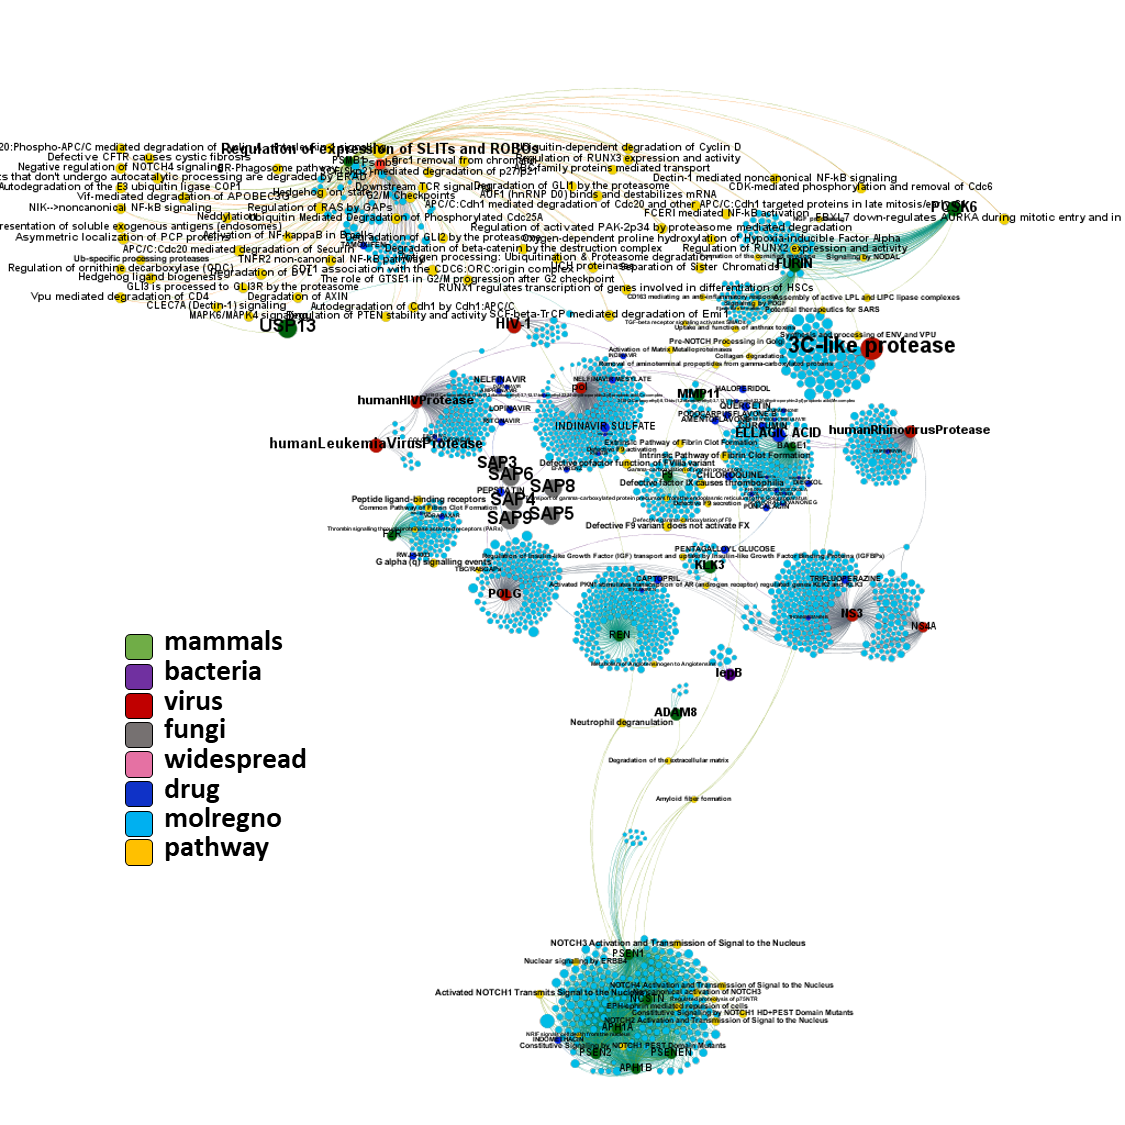
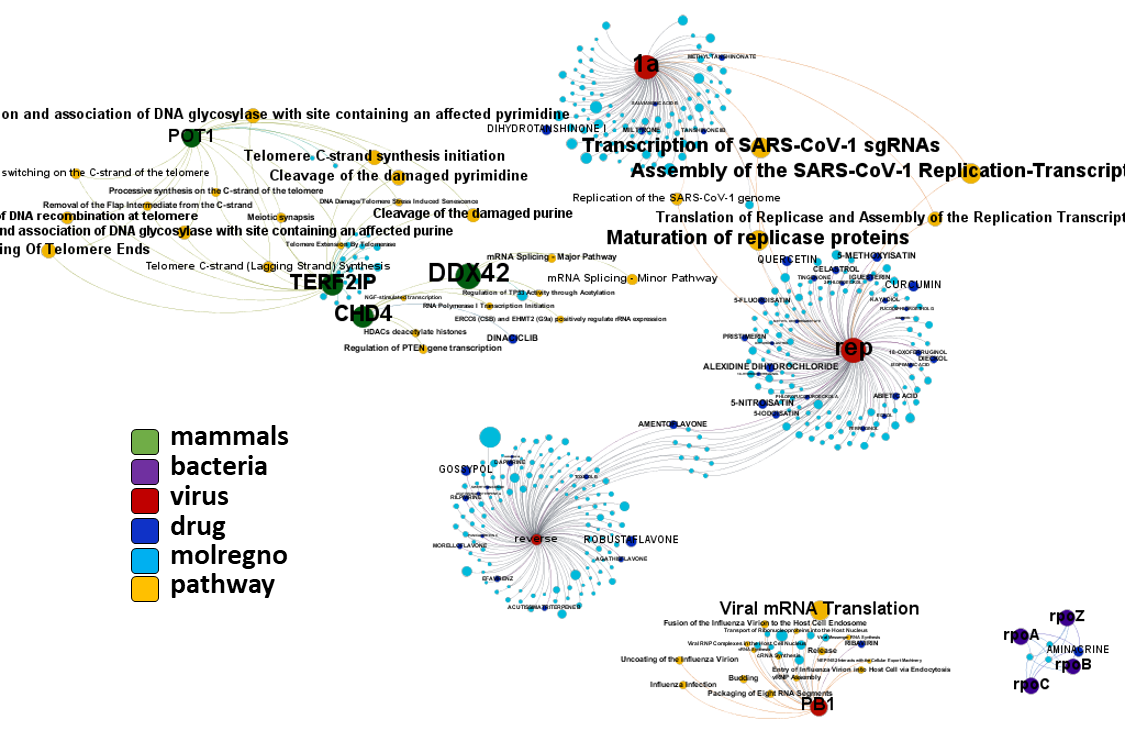
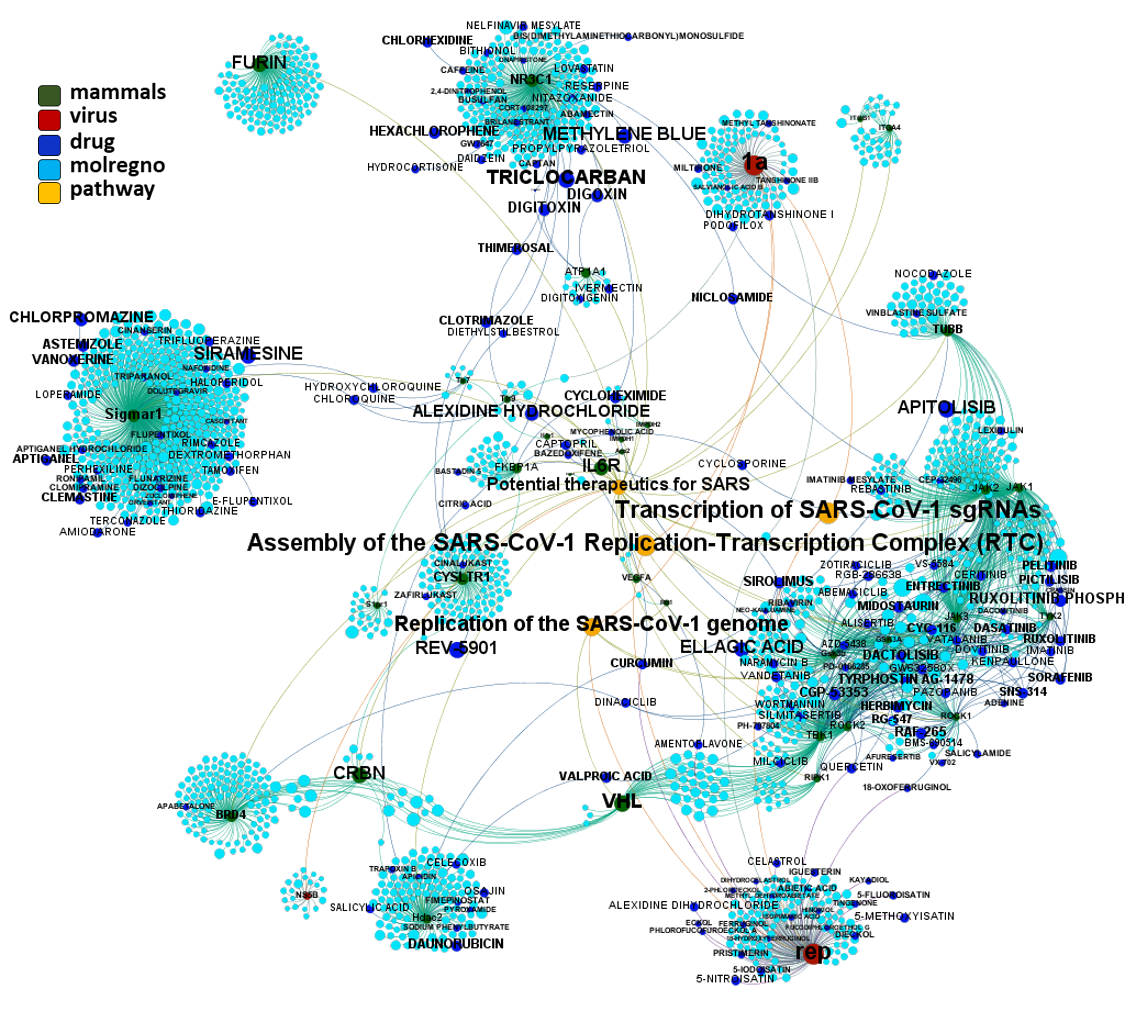
And now we can look at to all the interactions between predicted active molecules and protein targets in ChEMBL to determine main nodes of activity (bottom ledft interactions graph) or clusters/modules of specific interactions
(bottom righ interactions graph).
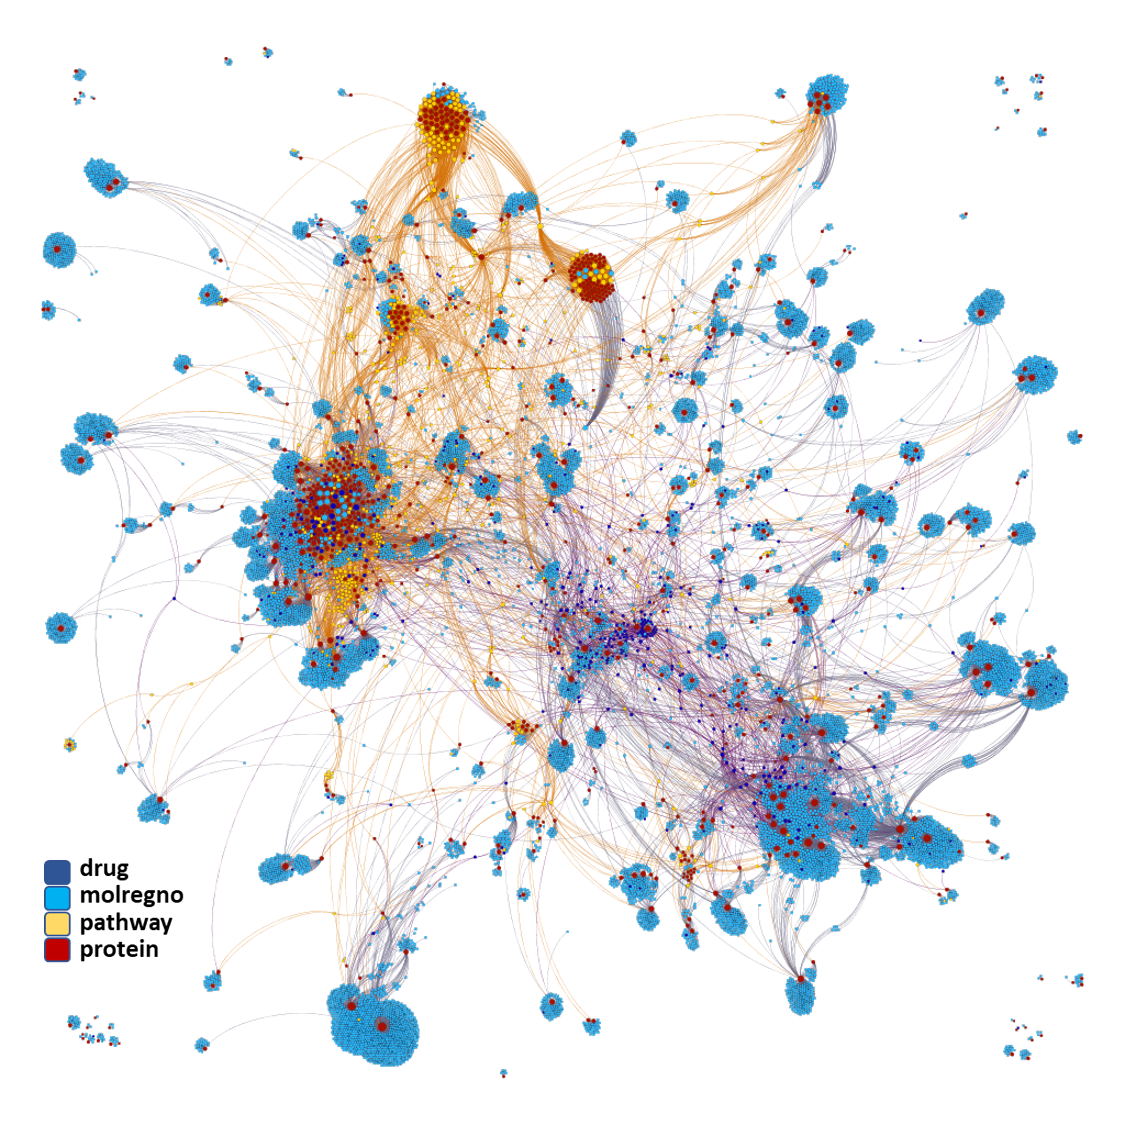
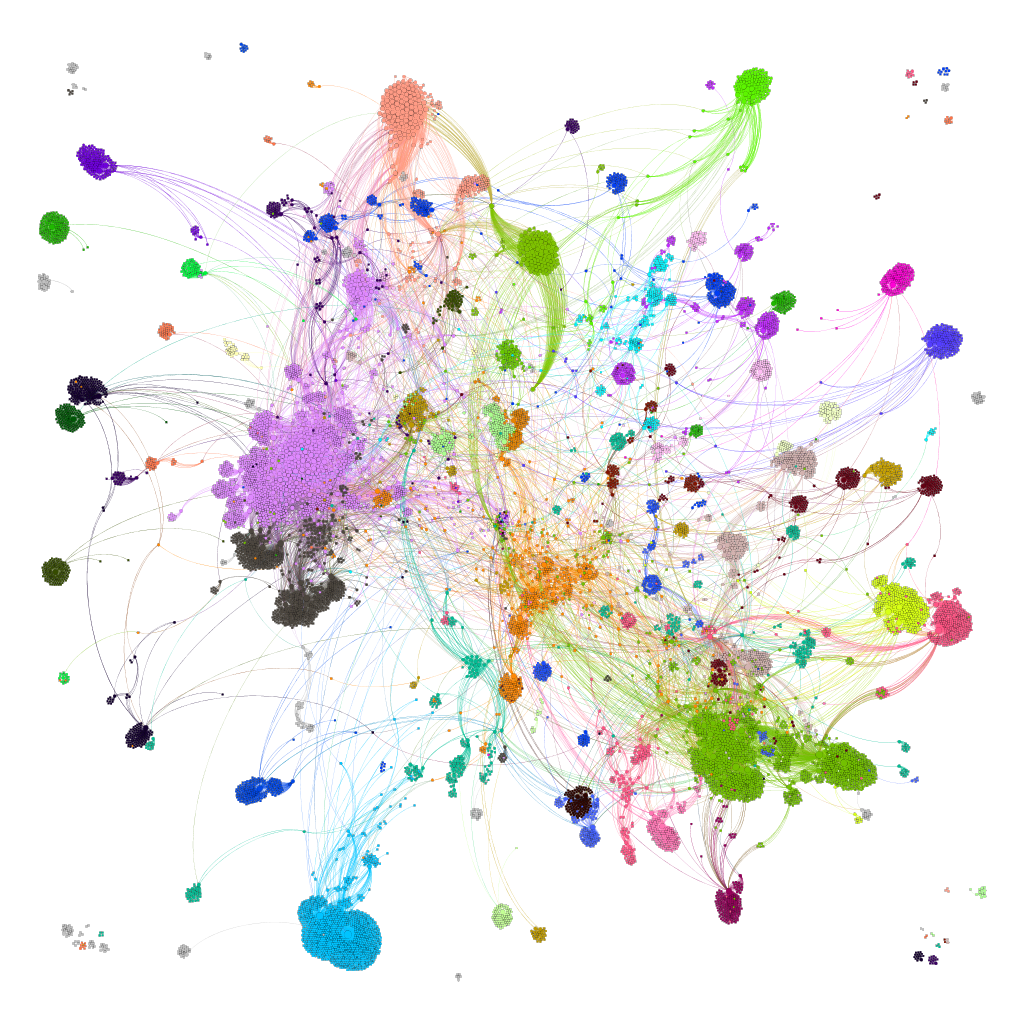
And use these interactions maps to classify activities in different groups based on closest relations between compounds and proteins. We can highlight protein groups with relevant scores for SASRS infection: Proteases, GPCRs, ion channels, kinases, transporters, nucleic acids binding proteins, steroid metabolism enzymes, ubiquitin-transference elements, bromodomain proteins, histone deacetylases and more.
To explore selective visualizations, just click on the tabs below.
- Proteases
- Transporters
- Fungal glucan synthases
- Kinesins
- G-protein coupled receptors
- Tyrosine protein kinases / growth factors
- DNA/RNA interacting proteins
- Ion channels
- Proteins involved in sterols synthesis
- Ubiquitin ligase components BRDs & HDACs
- Some sparse coagulation factors
- Serine/threonine and PI kinases
- Sigma receptors
- Nuclear steroid hormone receptors
- Heat shock proteins
- Ribosomal proteins
- Apoptosis regulator Bcl-2
- Ion pumps
- Adhesion proteins
- Gonadotropin-releasing hormone receptor GNRHR
- Acetyl and butiryl cholinesterases
- Other viral proteins.
- Non-classified proteins.
- Proteins linked to SARS reactome pathways.
Scatter plot flagging best ranked proteases.
Aggregated SARS scores at the protein level: Log10(degree): logged number of interactions for each protein. SARS_Score: Aggregated score against coronavirus infection per protein. Size by Degree/CountOfScores represents the number of SARS actiove interactions vs total records per protein in ChEMBL. Color by condition of elements involved in score aggregation; they can be built from actual, predicted values or a combination of both. Shape indicates the organism type as described in the legend.
And how are these proteases ranked by their combination of scores.

Log10(degree): logged number of interactions for each protein. SARS_Score: Aggregated score against coronavirus infection per protein. Size by Degree/CountOfScores represents the number of SARS active interactions vs total records per protein in ChEMBL.
And all the interactions of these proteases with actual or predicted SARS active compounds alongside the pathways in which they are involved.
Proteases-ChEMBL compounds interactions graph. Color by organism type.
Scatter plot flagging best ranked transporters.
Aggregated SARS scores at the protein level: Log10(degree): logged number of interactions for each protein. SARS_Score: Aggregated score against coronavirus infection per protein. Size by Degree/CountOfScores represents the number of SARS actiove interactions vs total records per protein in ChEMBL. Color by condition of elements involved in score aggregation; they can be built from actual, predicted values or a combination of both. Shape indicates the organism type as described in the legend.
And how are these transporters ranked by their combination of scores.
Log10(degree): logged number of interactions for each protein. SARS_Score: Aggregated score against coronavirus infection per protein. Size by Degree/CountOfScores represents the number of SARS active interactions vs total records per protein in ChEMBL.
And all the interactions of these transporters with actual or predicted SARS active compounds.
Protein-compounds/pathways interaction graph for transporters.
Scatter plot flagging best ranked glucan synthases .
.
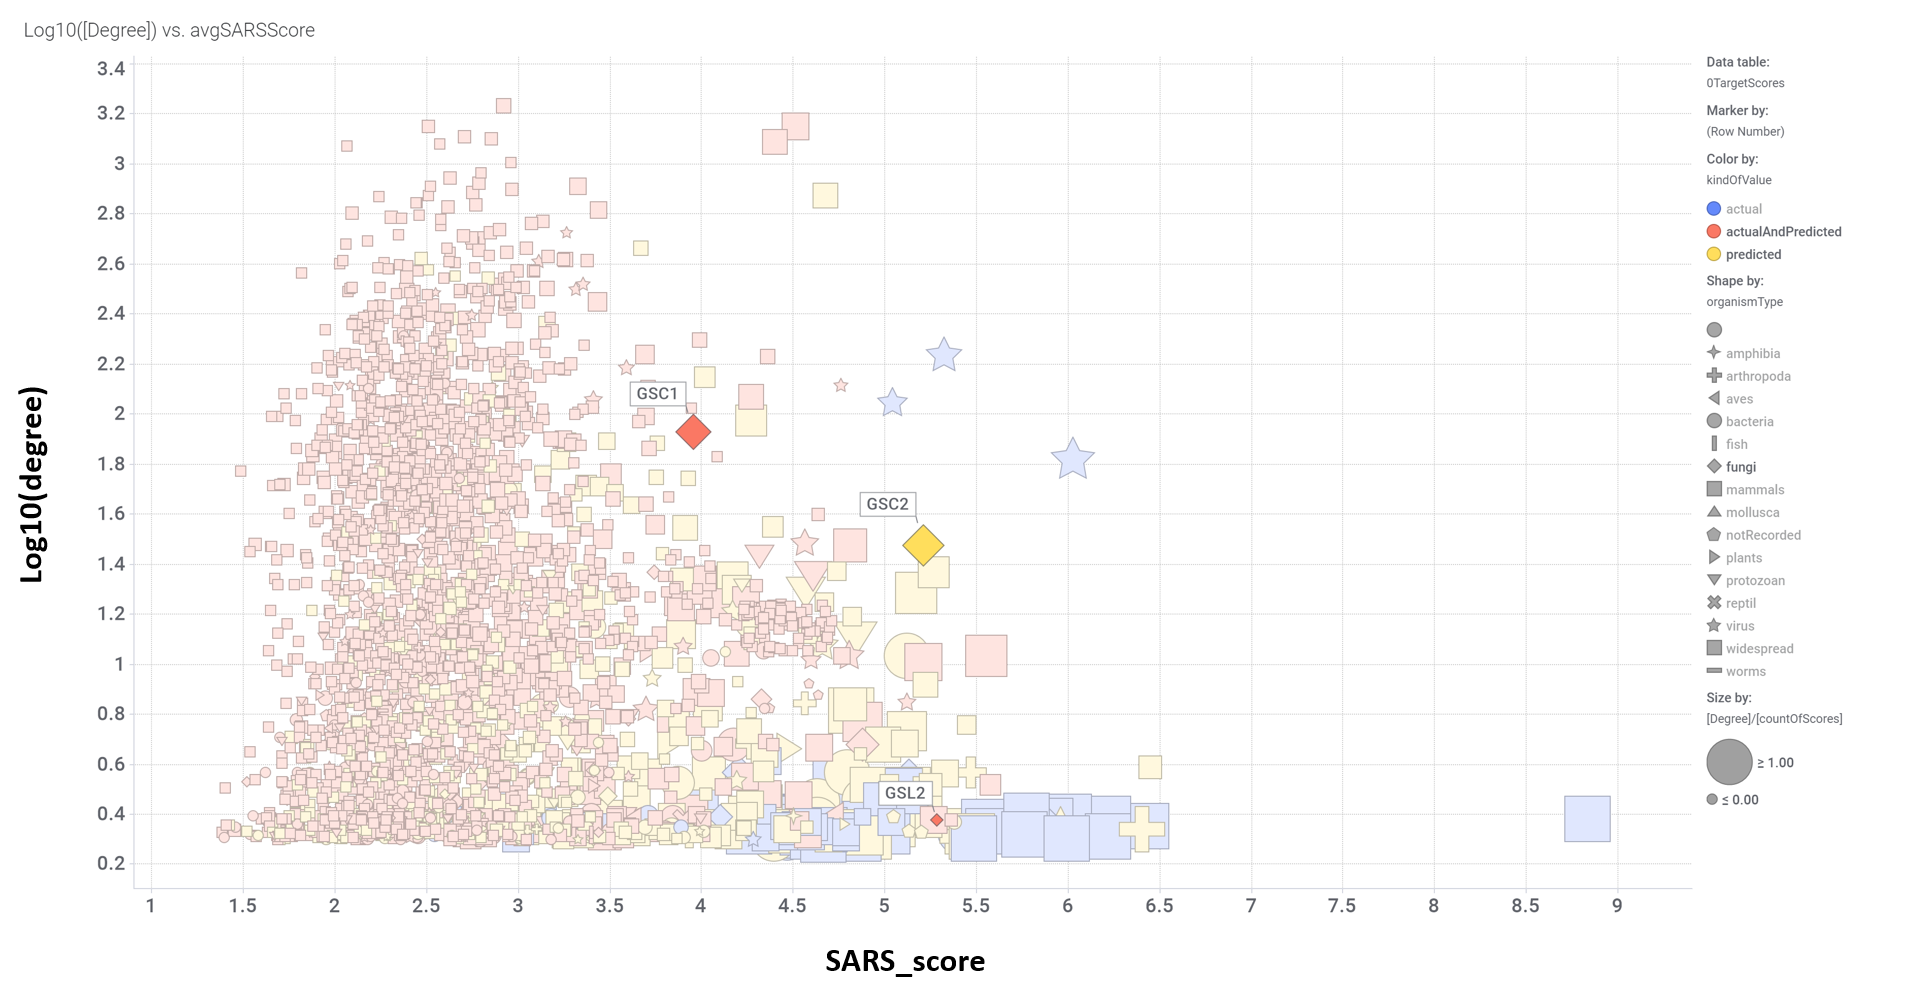
Aggregated SARS scores at the protein level: Log10(degree): logged number of interactions for each protein. SARS_Score: Aggregated score against coronavirus infection per protein. Size by Degree/CountOfScores represents the number of SARS actiove interactions vs total records per protein in ChEMBL. Color by condition of elements involved in score aggregation; they can be built from actual, predicted values or a combination of both. Shape indicates the organism type as described in the legend.
And how are these glucan synthases ranked by their combination of scores.
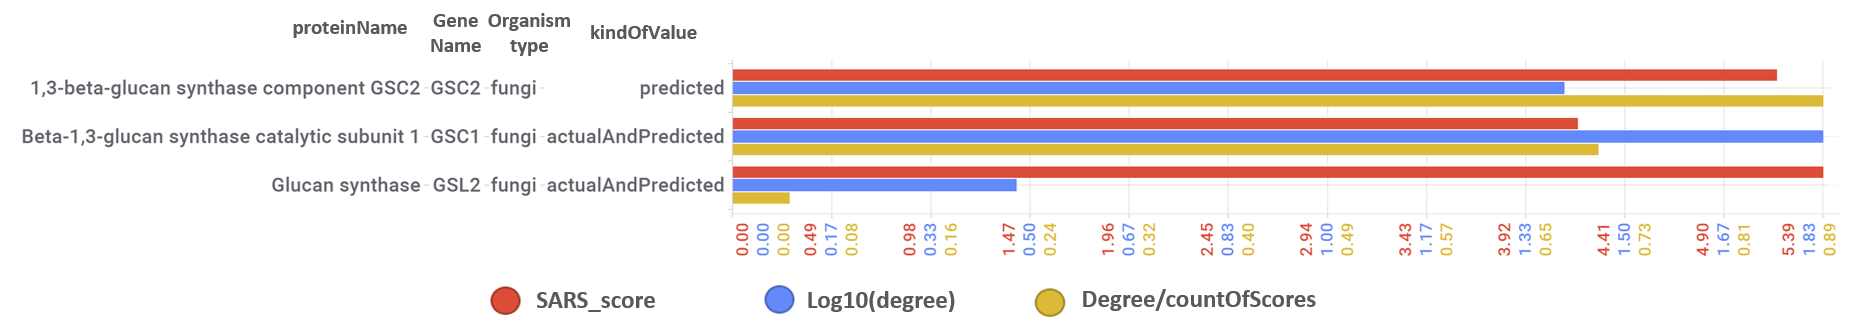
Log10(degree): logged number of interactions for each protein. SARS_Score: Aggregated score against coronavirus infection per protein. Size by Degree/CountOfScores represents the number of SARS active interactions vs total records per protein in ChEMBL.
And all the interactions of these glucan synthases with actual or predicted SARS active compounds.
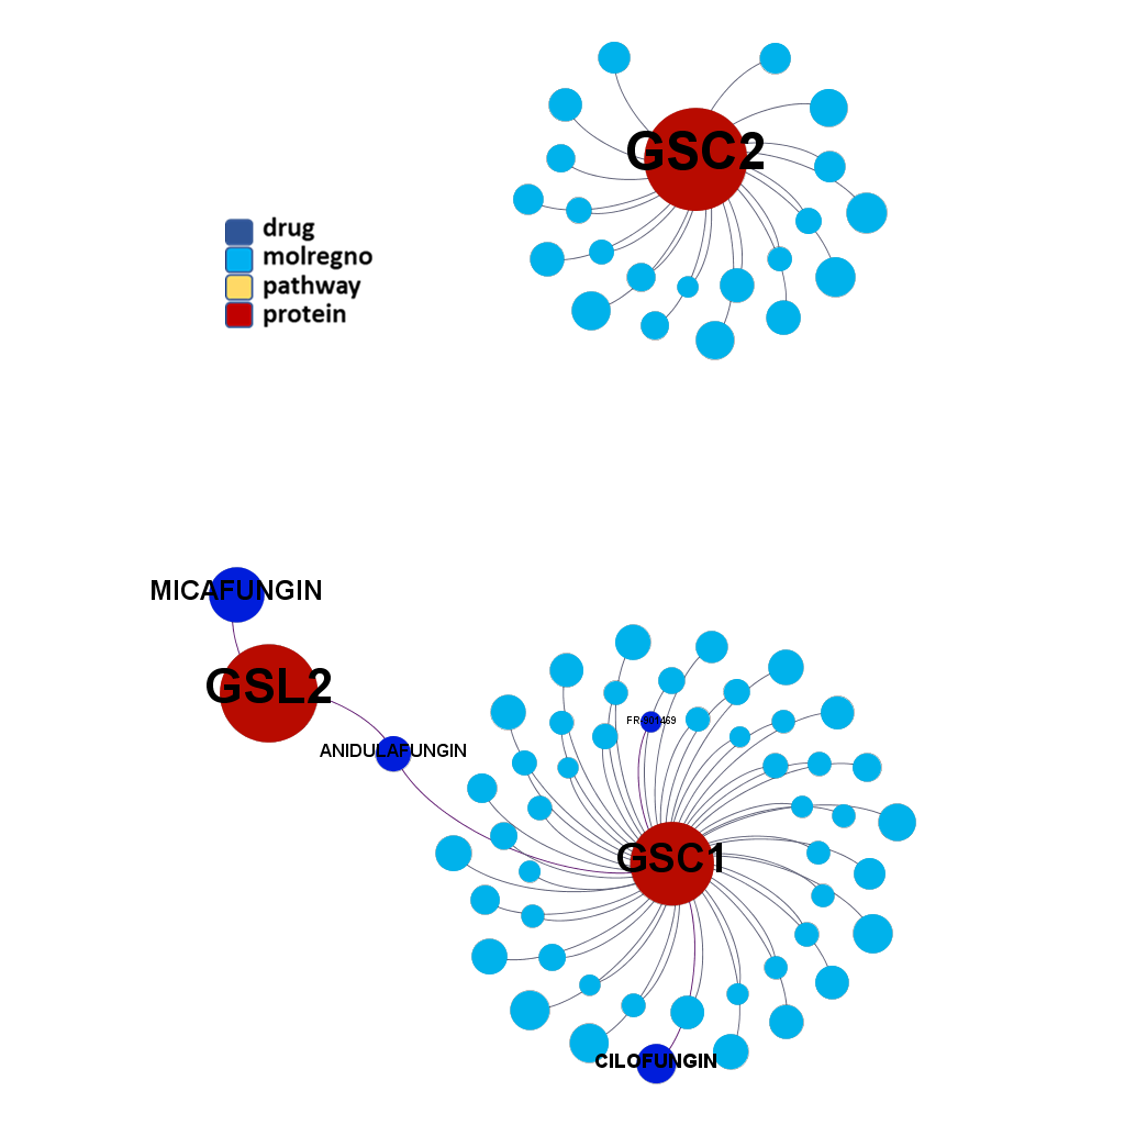
Molecular interactions graph for glucan synthases with ChEMBL compounds and Reactome Pathways.
Scatter plot flagging best ranked kinesins .
.
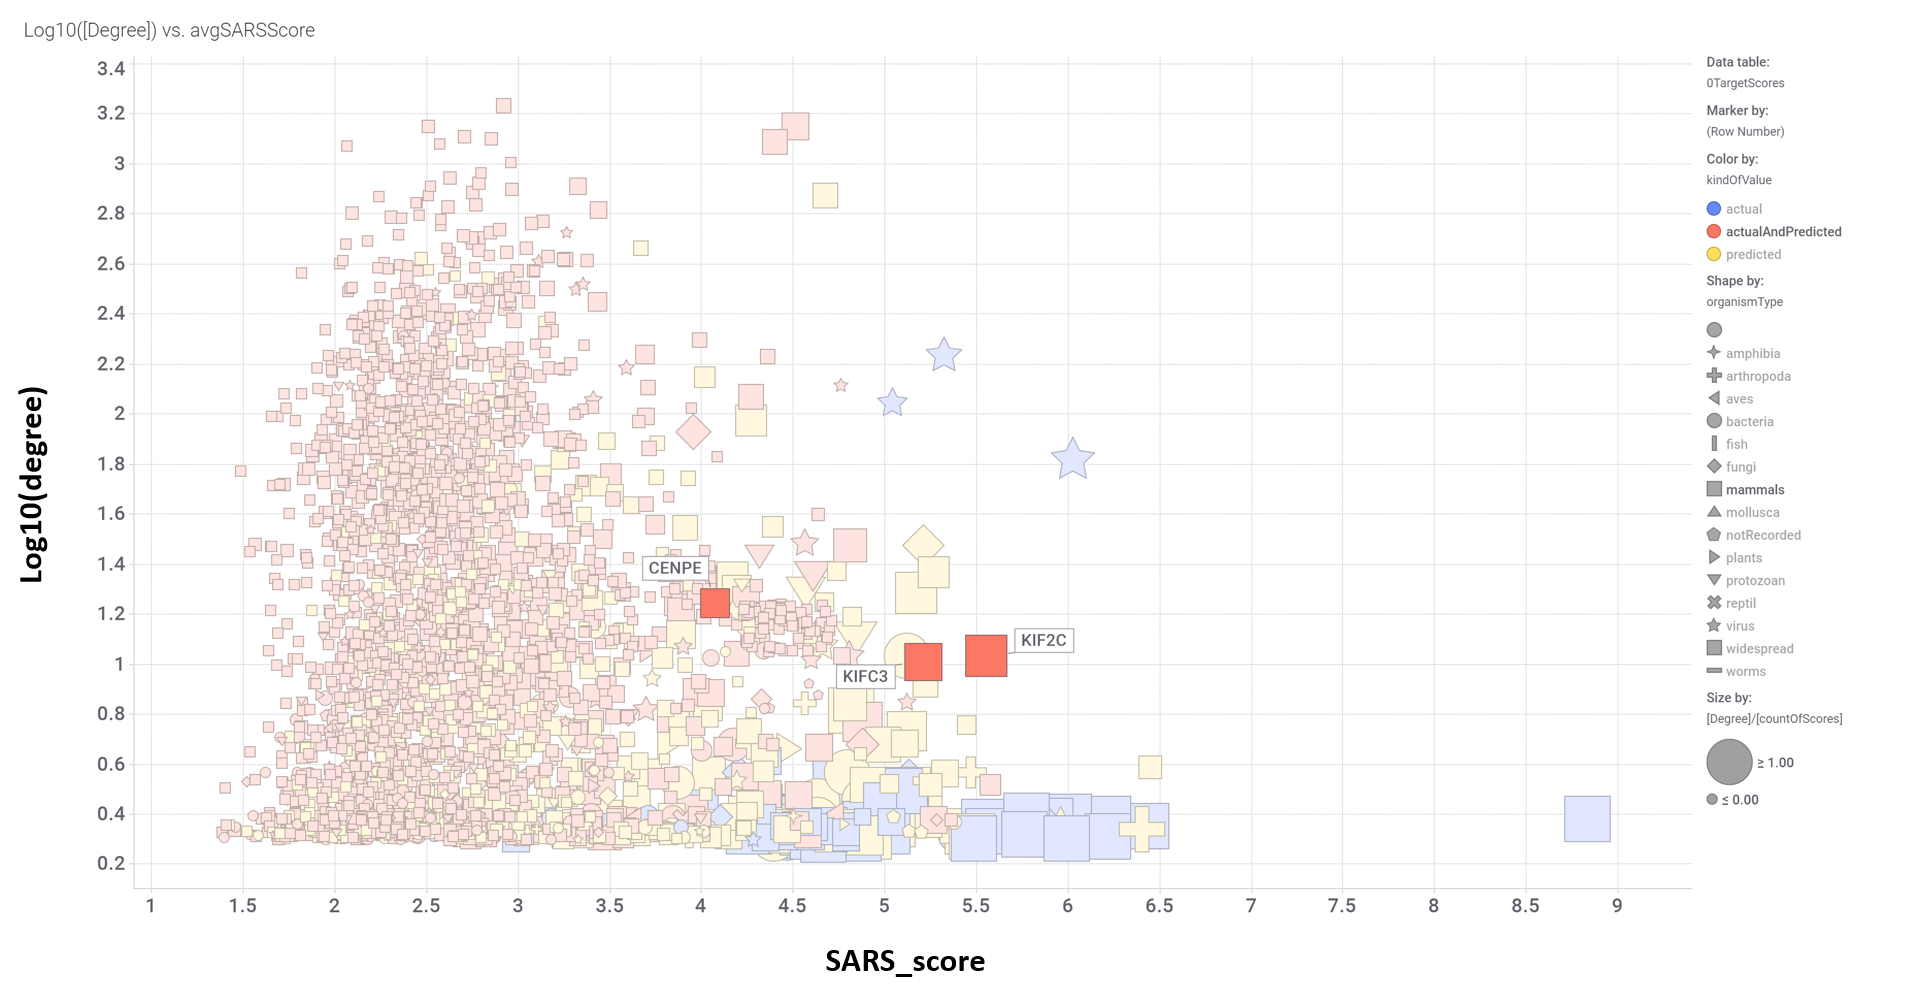
Aggregated SARS scores at the protein level: Log10(degree): logged number of interactions for each protein. SARS_Score: Aggregated score against coronavirus infection per protein. Size by Degree/CountOfScores represents the number of SARS actiove interactions vs total records per protein in ChEMBL. Color by condition of elements involved in score aggregation; they can be built from actual, predicted values or a combination of both. Shape indicates the organism type as described in the legend.
And how are these kinesins ranked by their combination of scores.

Log10(degree): logged number of interactions for each protein. SARS_Score: Aggregated score against coronavirus infection per protein. Size by Degree/CountOfScores represents the number of SARS active interactions vs total records per protein in ChEMBL.
And all the interactions of these kinesins with actual or predicted SARS active compounds.
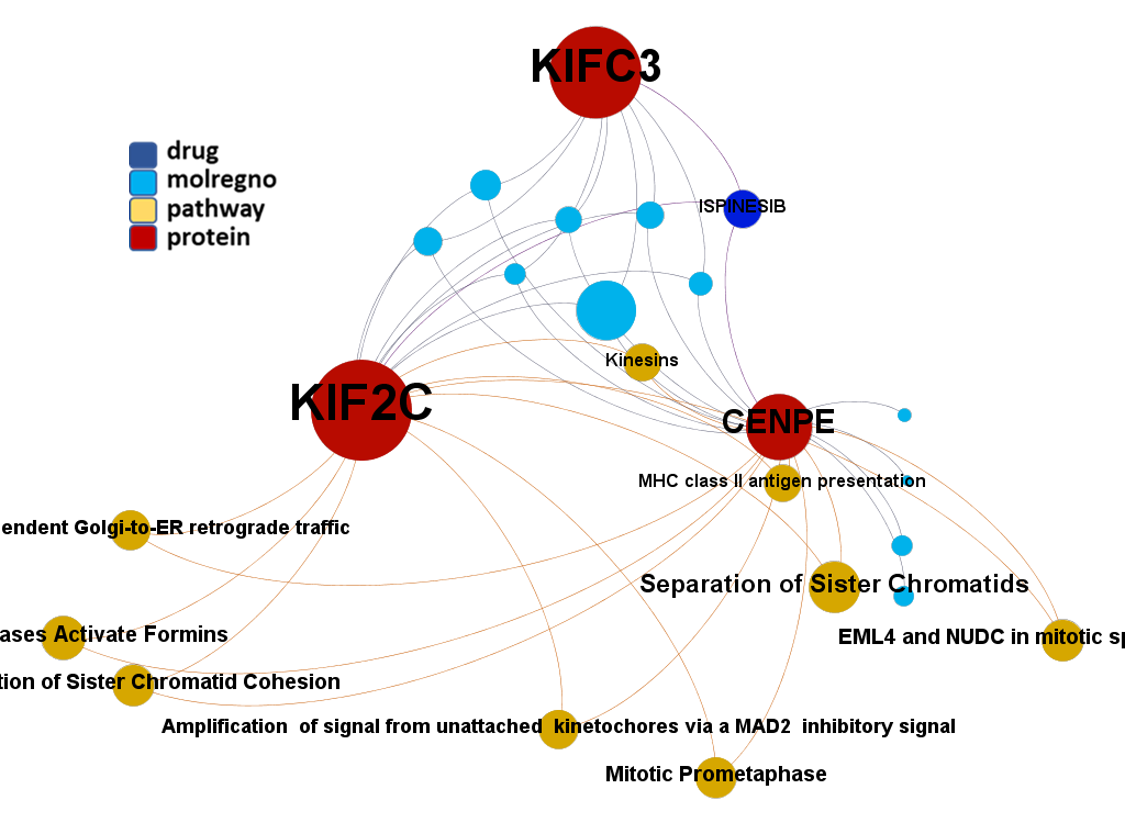
Molecular interactions graph for kinesins with ChEMBL compounds and Reactome Pathways.
Scatter plot flagging best ranked GPCRs.
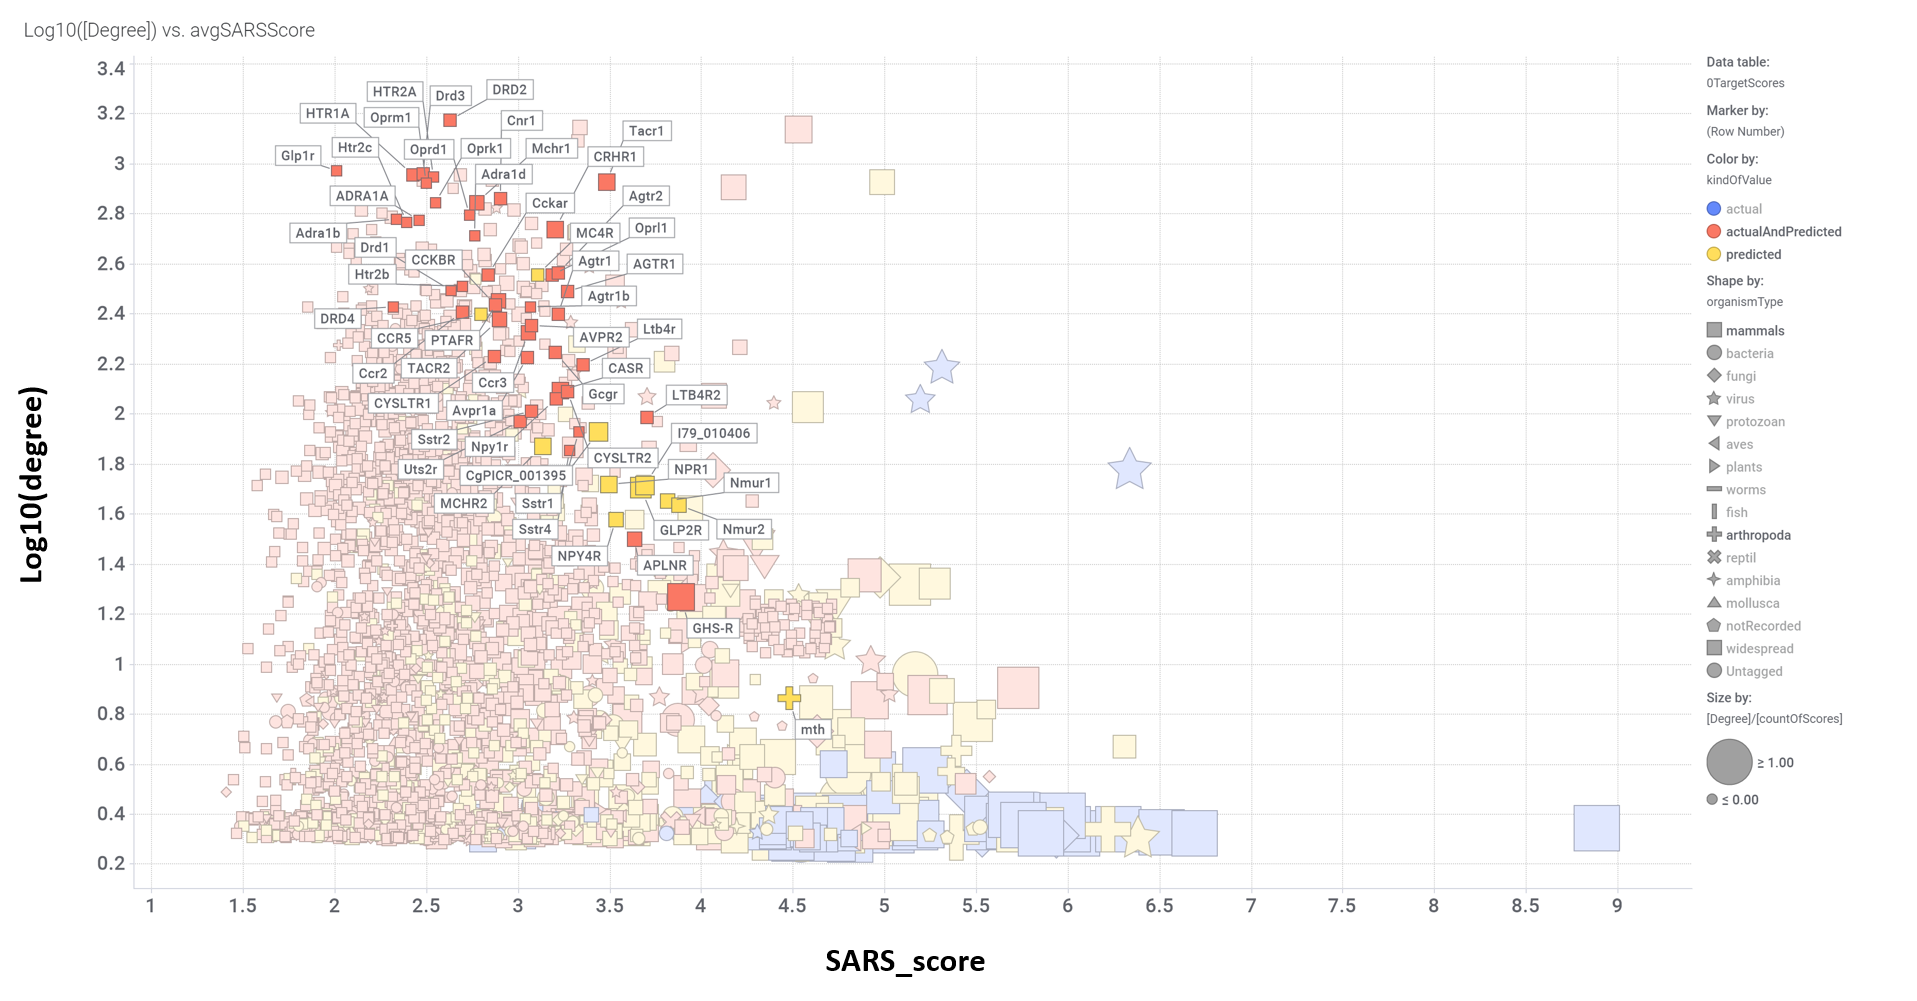
Aggregated SARS scores at the protein level: Log10(degree): logged number of interactions for each protein. SARS_Score: Aggregated score against coronavirus infection per protein. Size by Degree/CountOfScores represents the number of SARS actiove interactions vs total records per protein in ChEMBL. Color by condition of elements involved in score aggregation; they can be built from actual, predicted values or a combination of both. Shape indicates the organism type as described in the legend.
And how are these GPCRs ranked by their combination of scores.

Log10(degree): logged number of interactions for each protein. SARS_Score: Aggregated score against coronavirus infection per protein. Size by Degree/CountOfScores represents the number of SARS active interactions vs total records per protein in ChEMBL.
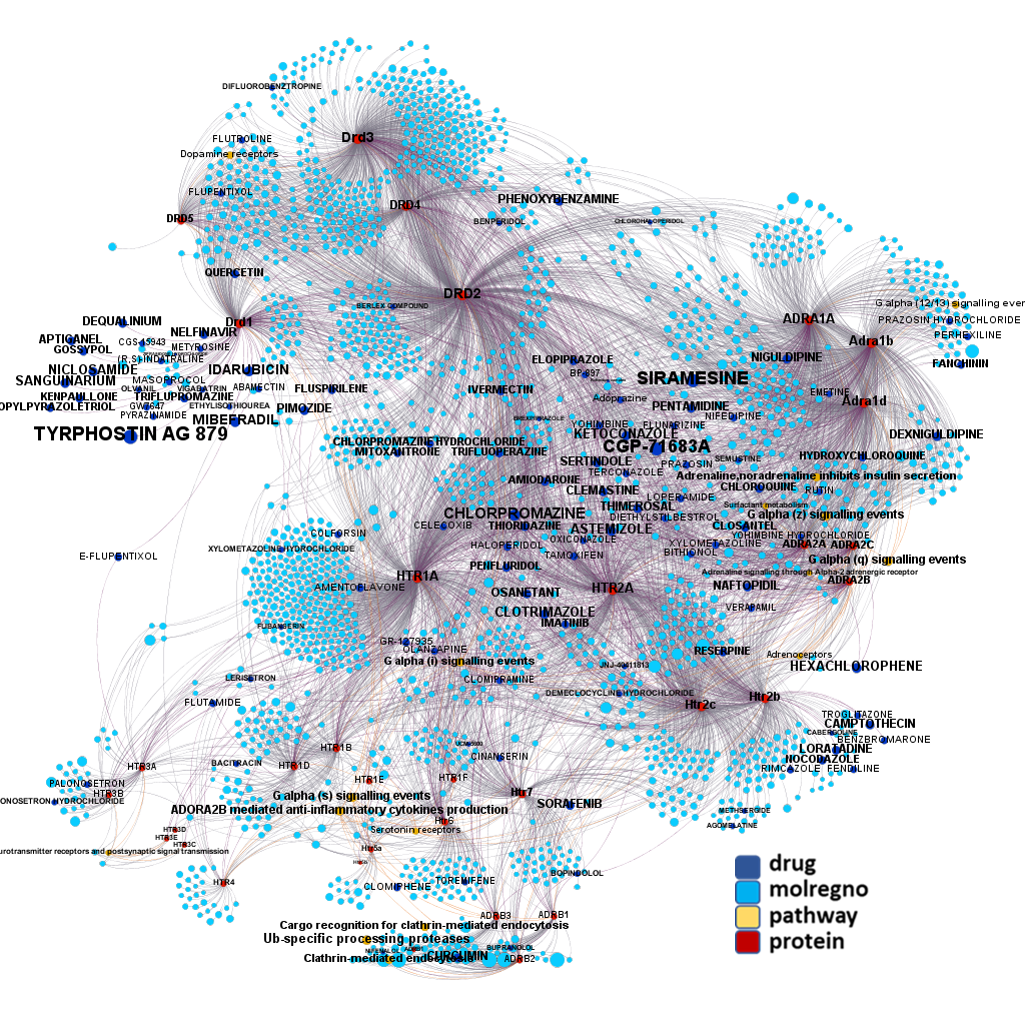
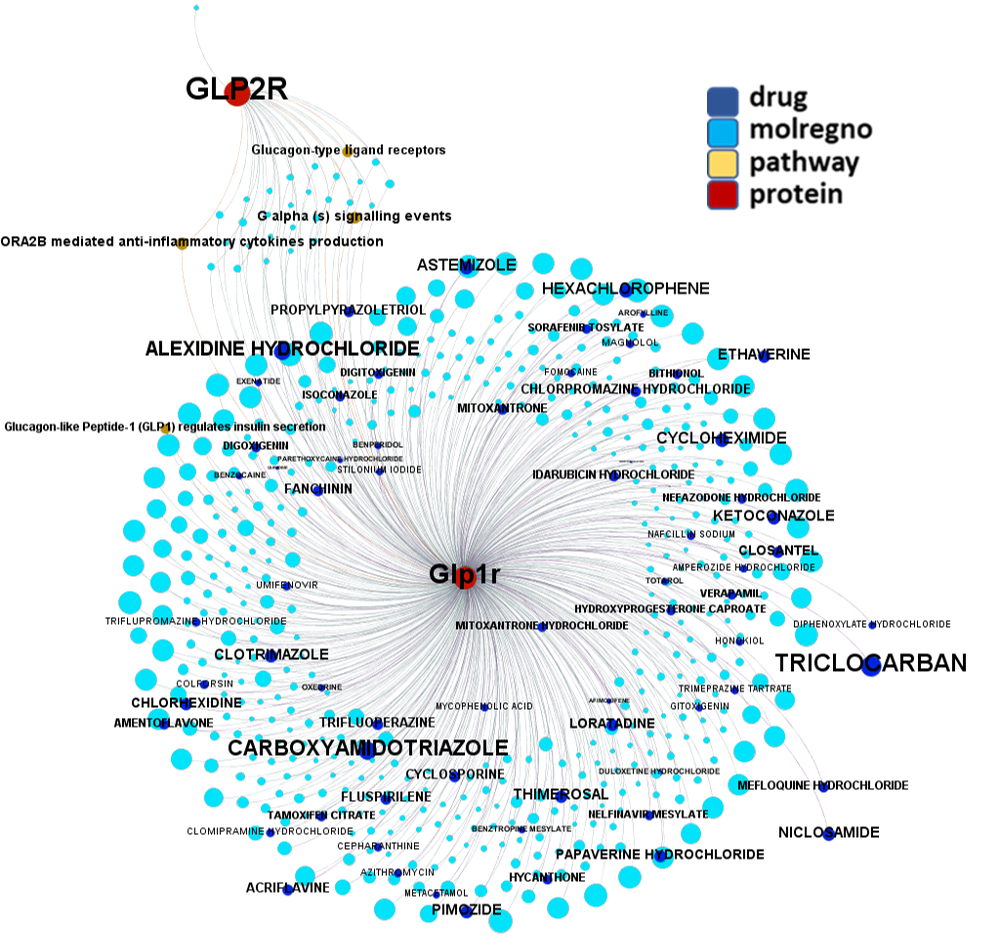
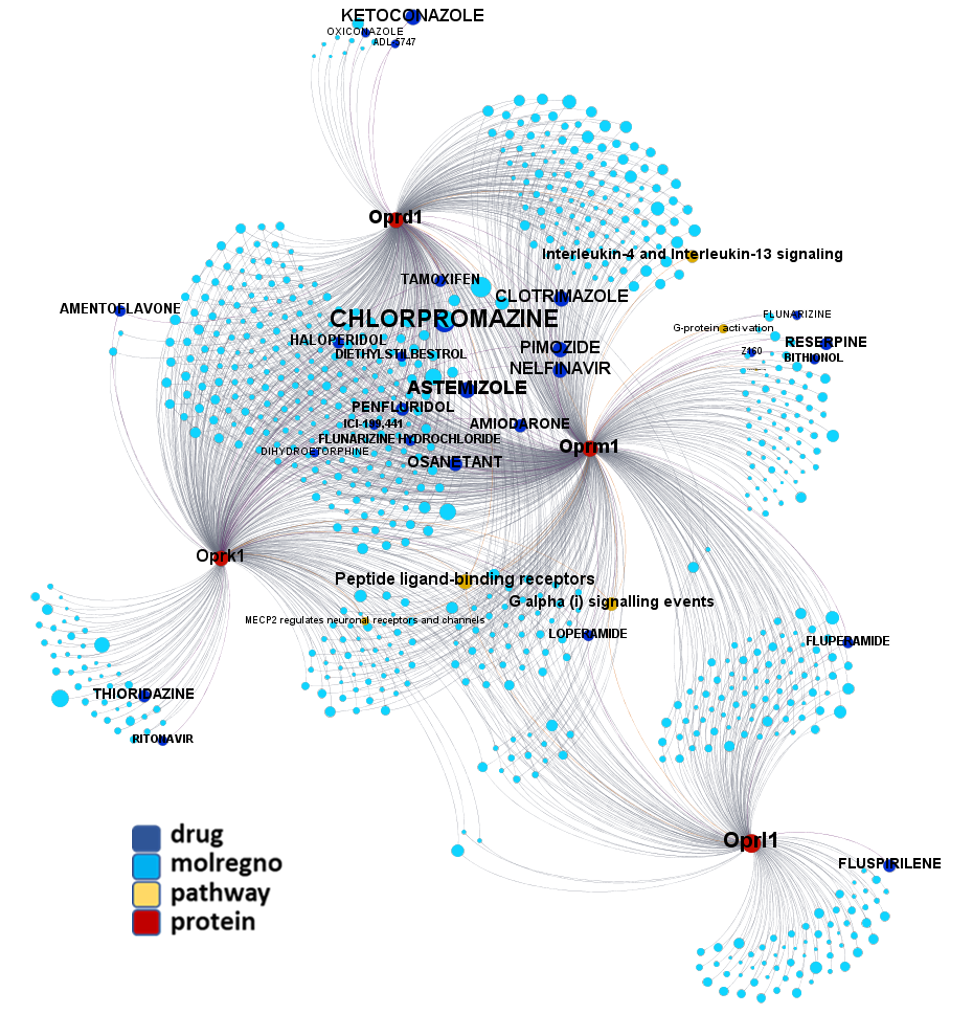
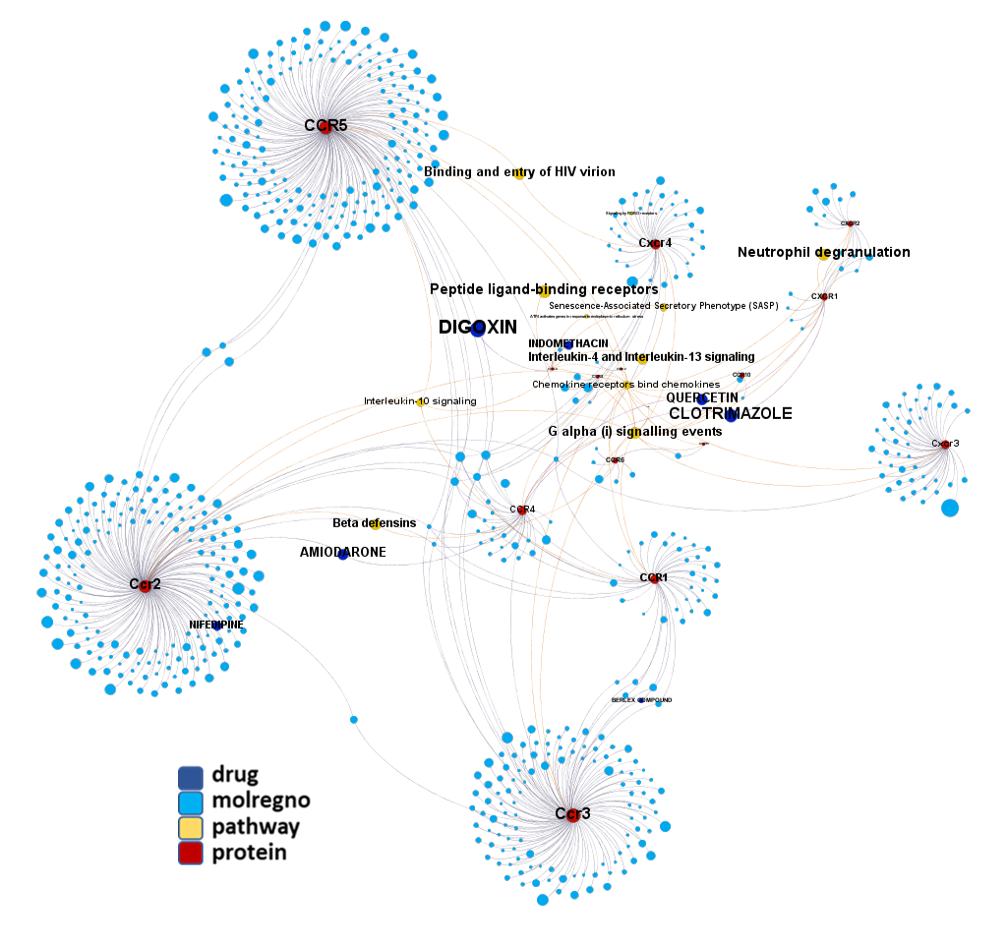
And all the interactions of these GPCRs with actual or predicted SARS active compounds.
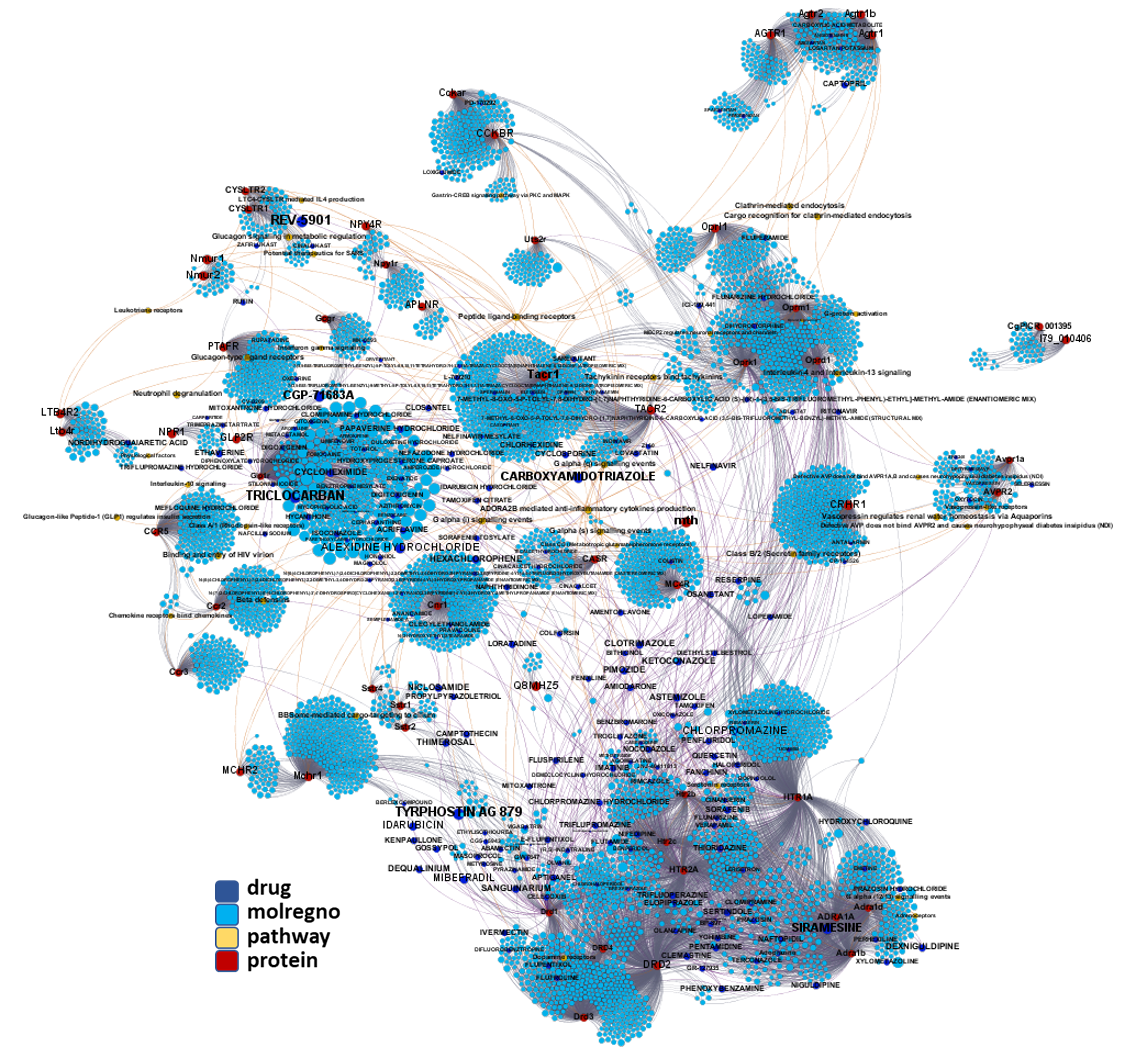
Protein-compounds/pathways interaction graph for G-protein coupled receptors.
Adrenergic, serotonin and dopamine receptors
Glucagon-like peptide receptors

Opioid receptors
Cannabinoid receptors

Angiotensin receptors

Melanin-concentrating hormone receptors
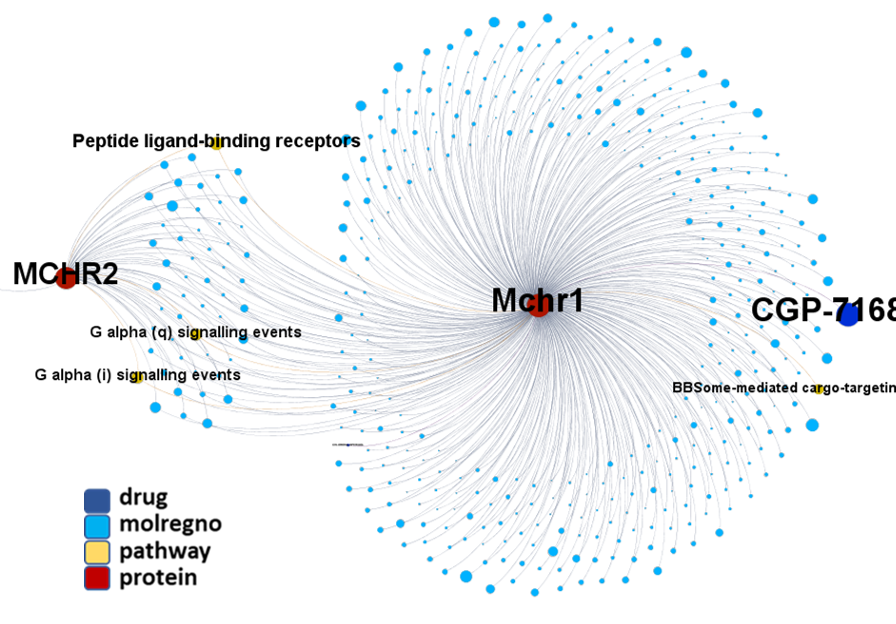
Chemokine receptors
Scatter plot flagging best ranked tyrosine kinases.

Aggregated SARS scores at the protein level: Log10(degree): logged number of interactions for each protein. SARS_Score: Aggregated score against coronavirus infection per protein. Size by Degree/CountOfScores represents the number of SARS actiove interactions vs total records per protein in ChEMBL. Color by condition of elements involved in score aggregation; they can be built from actual, predicted values or a combination of both. Shape indicates the organism type as described in the legend.
And how are these tyrosine kinases ranked by their combination of scores.
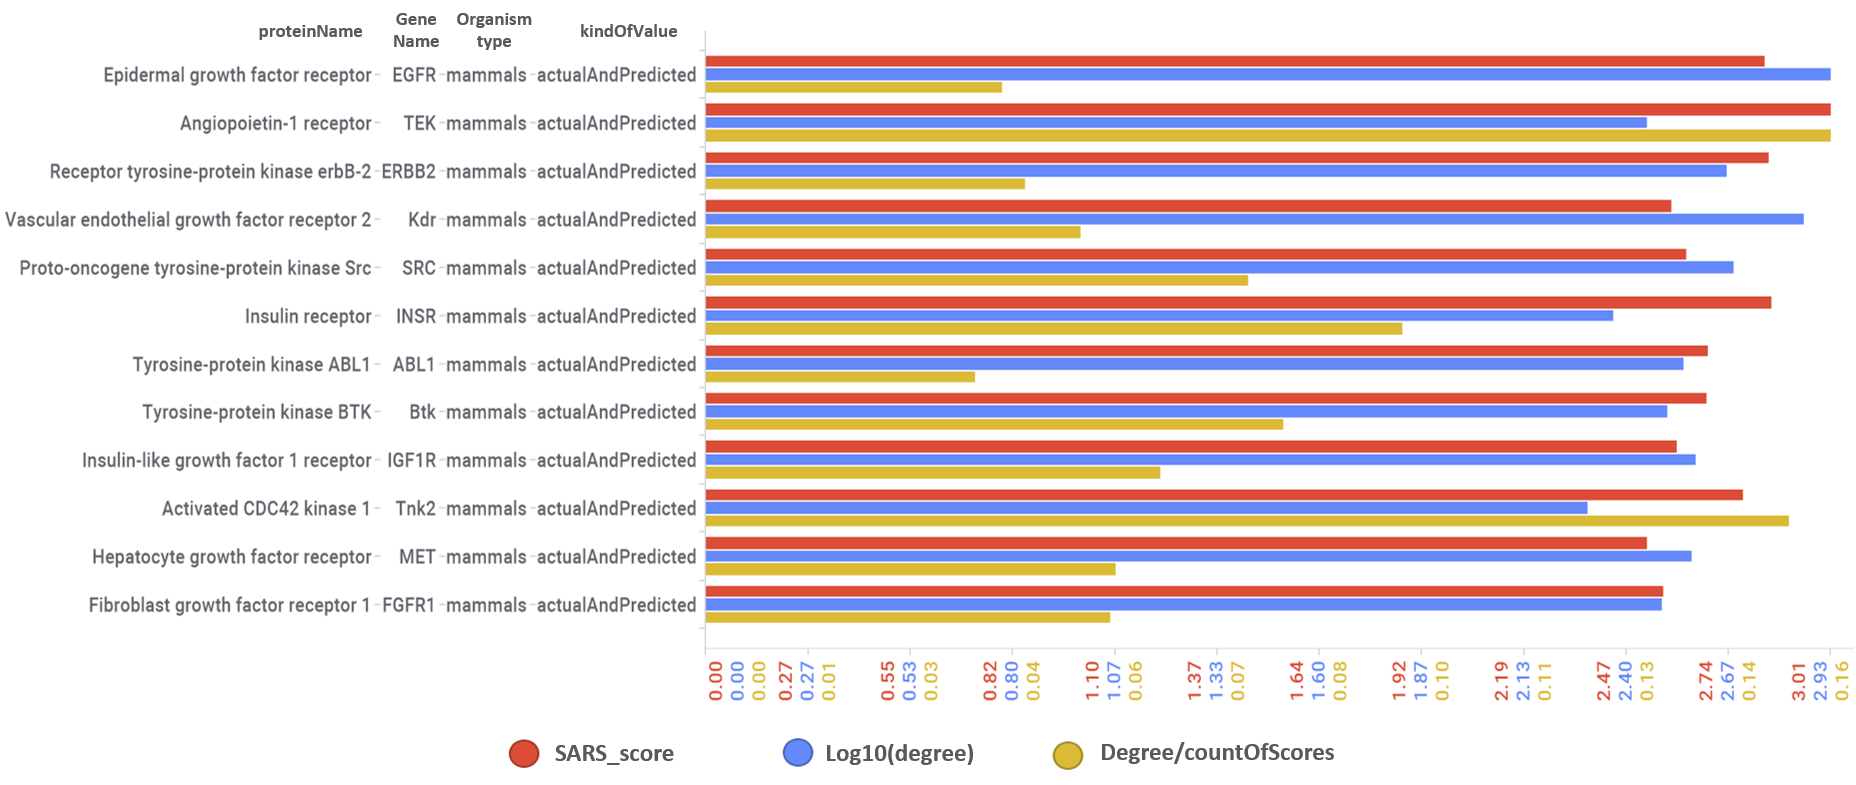
Log10(degree): logged number of interactions for each protein. SARS_Score: Aggregated score against coronavirus infection per protein. Size by Degree/CountOfScores represents the number of SARS active interactions vs total records per protein in ChEMBL.
And all the interactions of these tyrosine kinases with actual or predicted SARS active compounds.
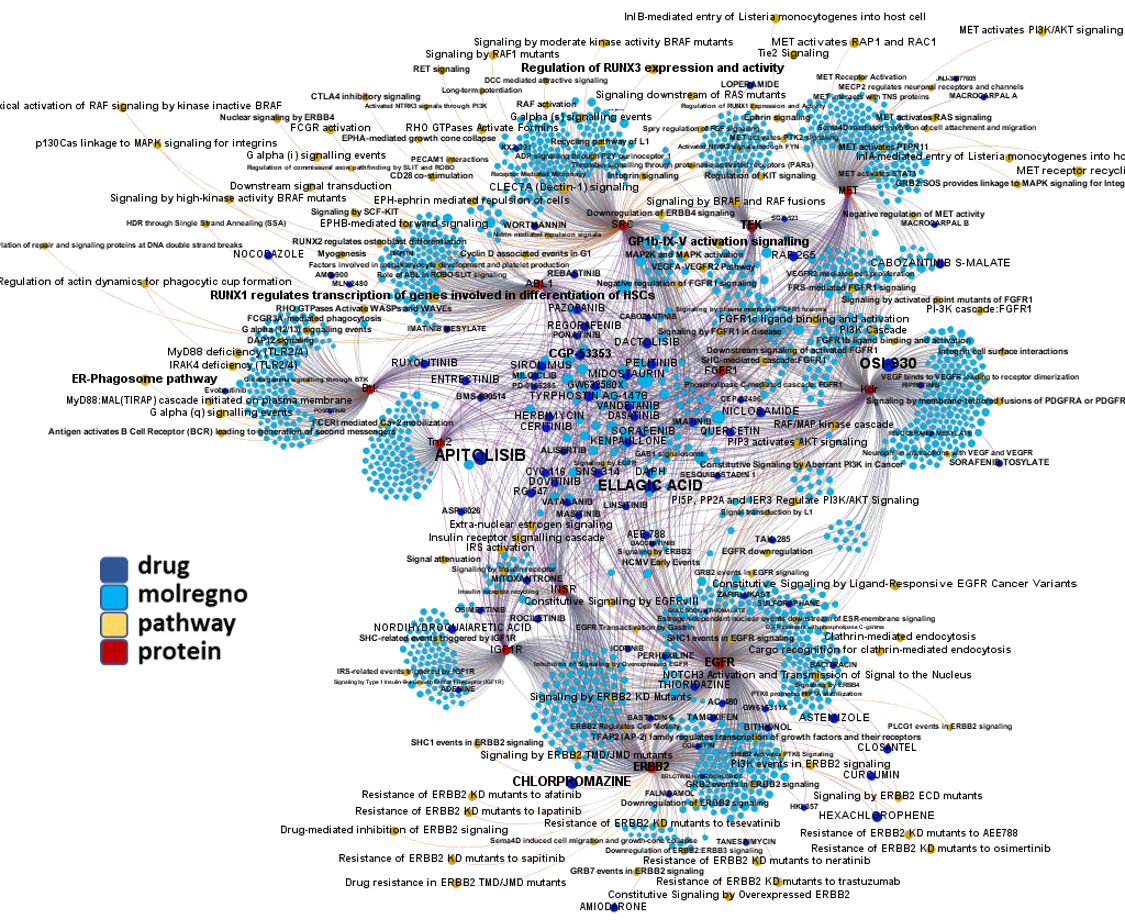
Protein-compounds/pathways interaction graph for Tyrosine kinases.
Scatter plot flagging best ranked DNA/RNA interacting proteins.
Aggregated SARS scores at the protein level: Log10(degree): logged number of interactions for each protein. SARS_Score: Aggregated score against coronavirus infection per protein. Size by Degree/CountOfScores represents the number of SARS actiove interactions vs total records per protein in ChEMBL. Color by condition of elements involved in score aggregation; they can be built from actual, predicted values or a combination of both. Shape indicates the organism type as described in the legend.
And how are these DNA/RNA interacting proteins ranked by their combination of scores.
Log10(degree): logged number of interactions for each protein. SARS_Score: Aggregated score against coronavirus infection per protein. Size by Degree/CountOfScores represents the number of SARS active interactions vs total records per protein in ChEMBL.
And all the interactions of these DNA/RNA interacting proteins with actual or predicted SARS active compounds.
RNA/DNA-binding proteins interaction map. Protein colors by organism.
Scatter plot flagging best ranked ion channels.
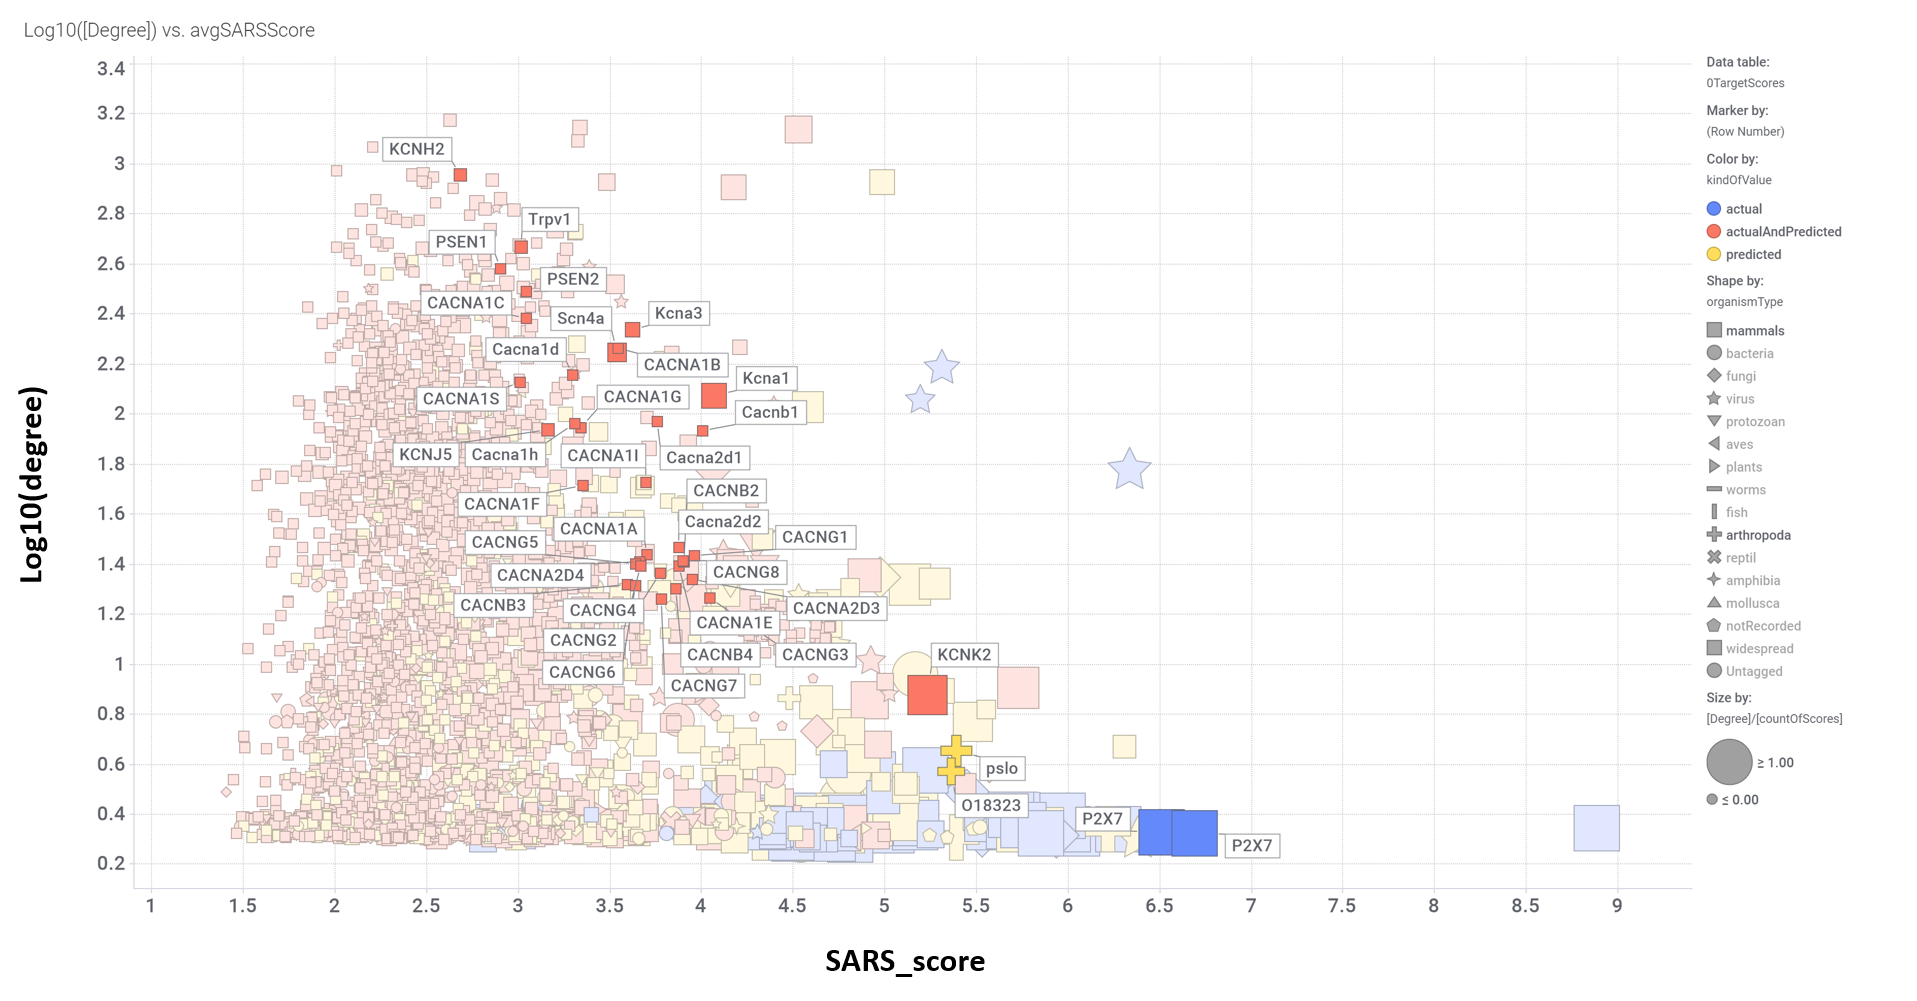
Aggregated SARS scores at the protein level: Log10(degree): logged number of interactions for each protein. SARS_Score: Aggregated score against coronavirus infection per protein. Size by Degree/CountOfScores represents the number of SARS actiove interactions vs total records per protein in ChEMBL. Color by condition of elements involved in score aggregation; they can be built from actual, predicted values or a combination of both. Shape indicates the organism type as described in the legend.
And how are these ion channels ranked by their combination of scores.
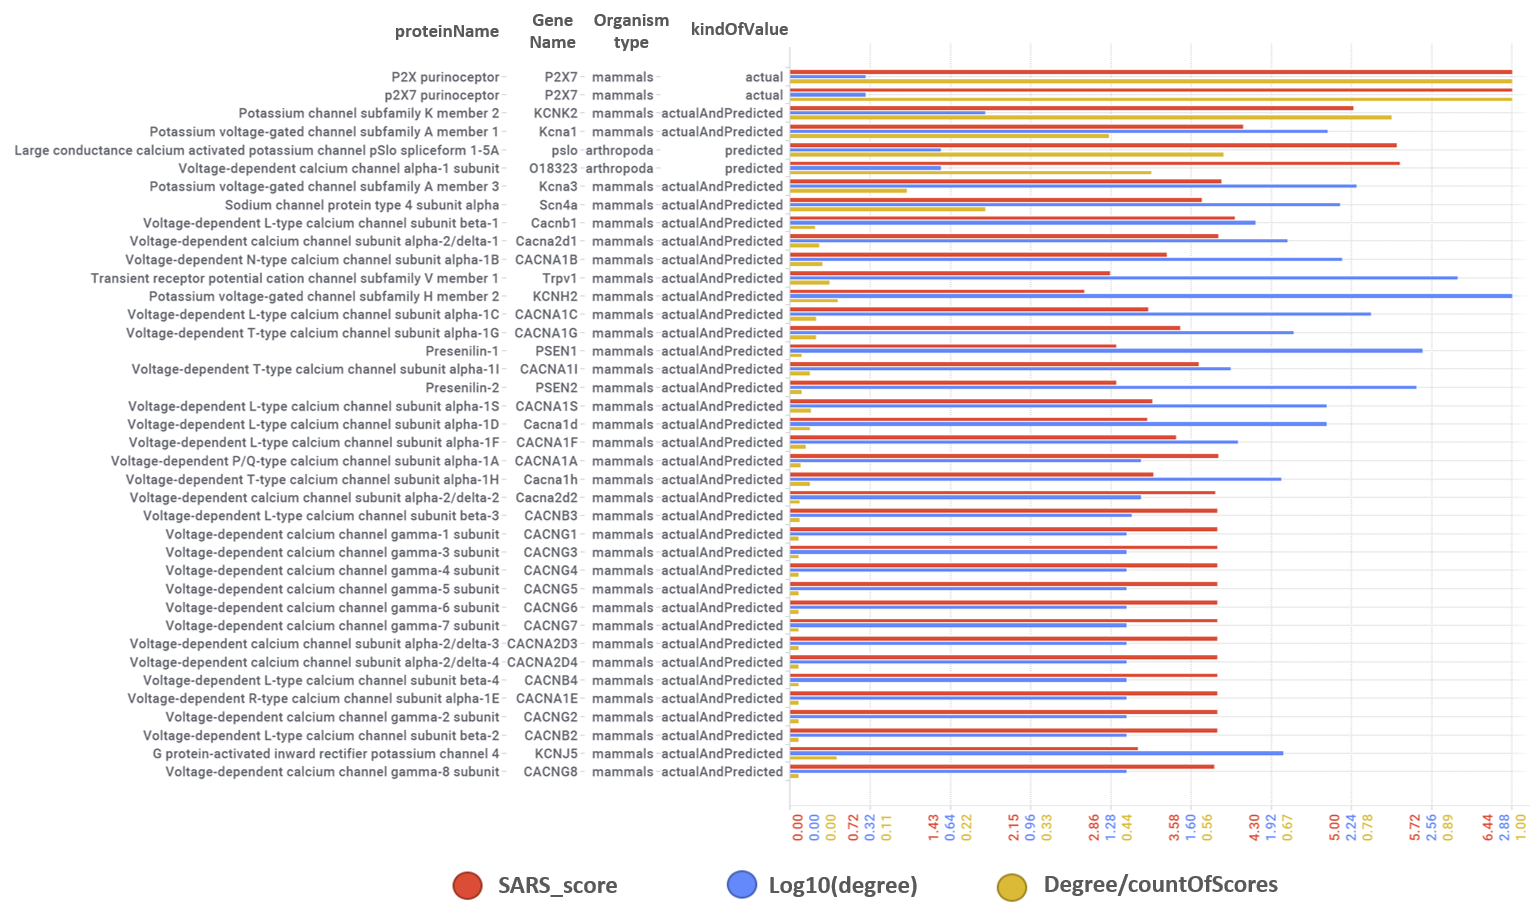
Log10(degree): logged number of interactions for each protein. SARS_Score: Aggregated score against coronavirus infection per protein. Size by Degree/CountOfScores represents the number of SARS active interactions vs total records per protein in ChEMBL.
And all the interactions of these ion channels with actual or predicted SARS active compounds.
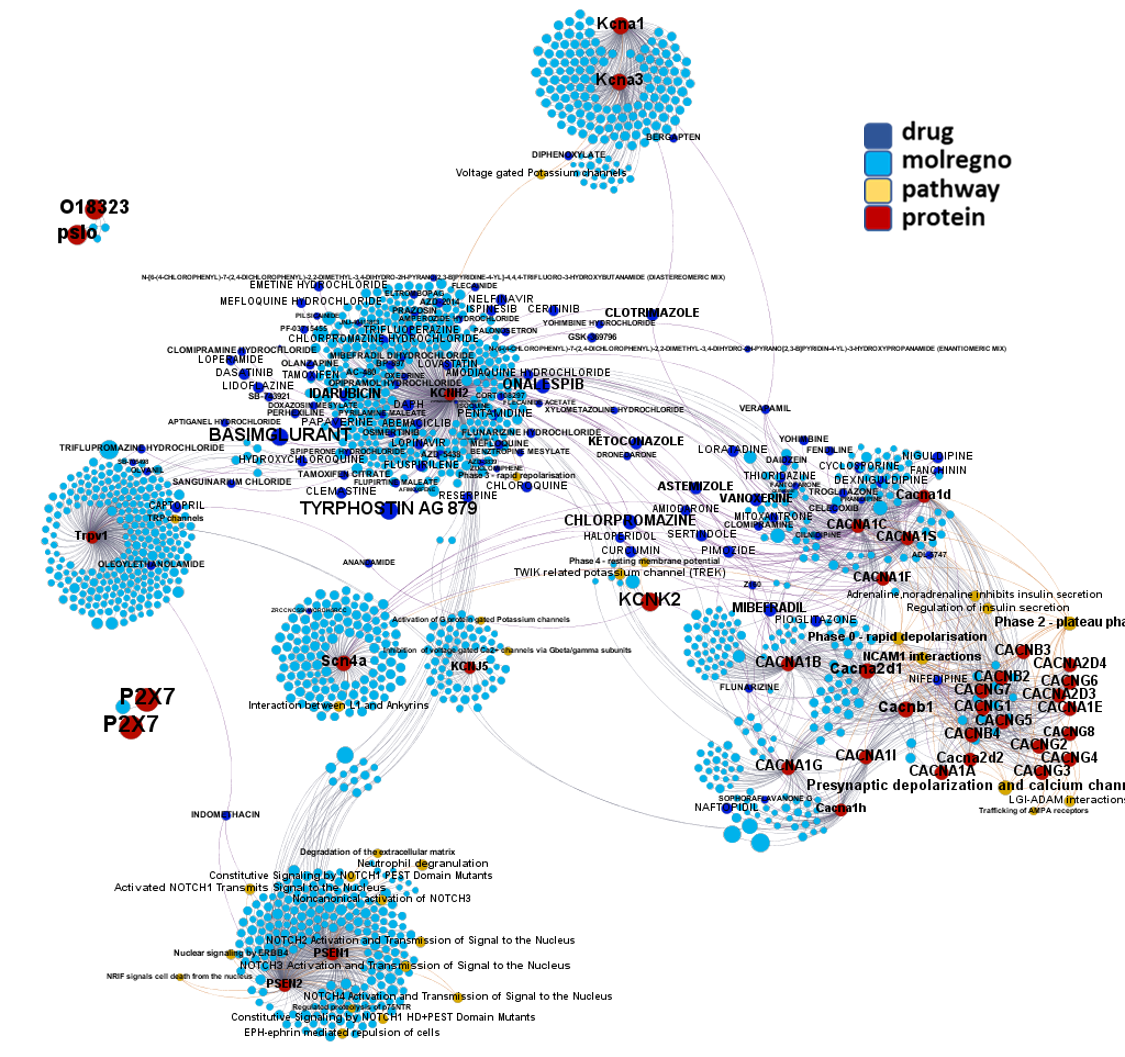
Protein-compounds/pathways interaction graph for ion channels.
Scatter plot flagging best ranked proteins involved in sterols synthesis from different groups of organisms.
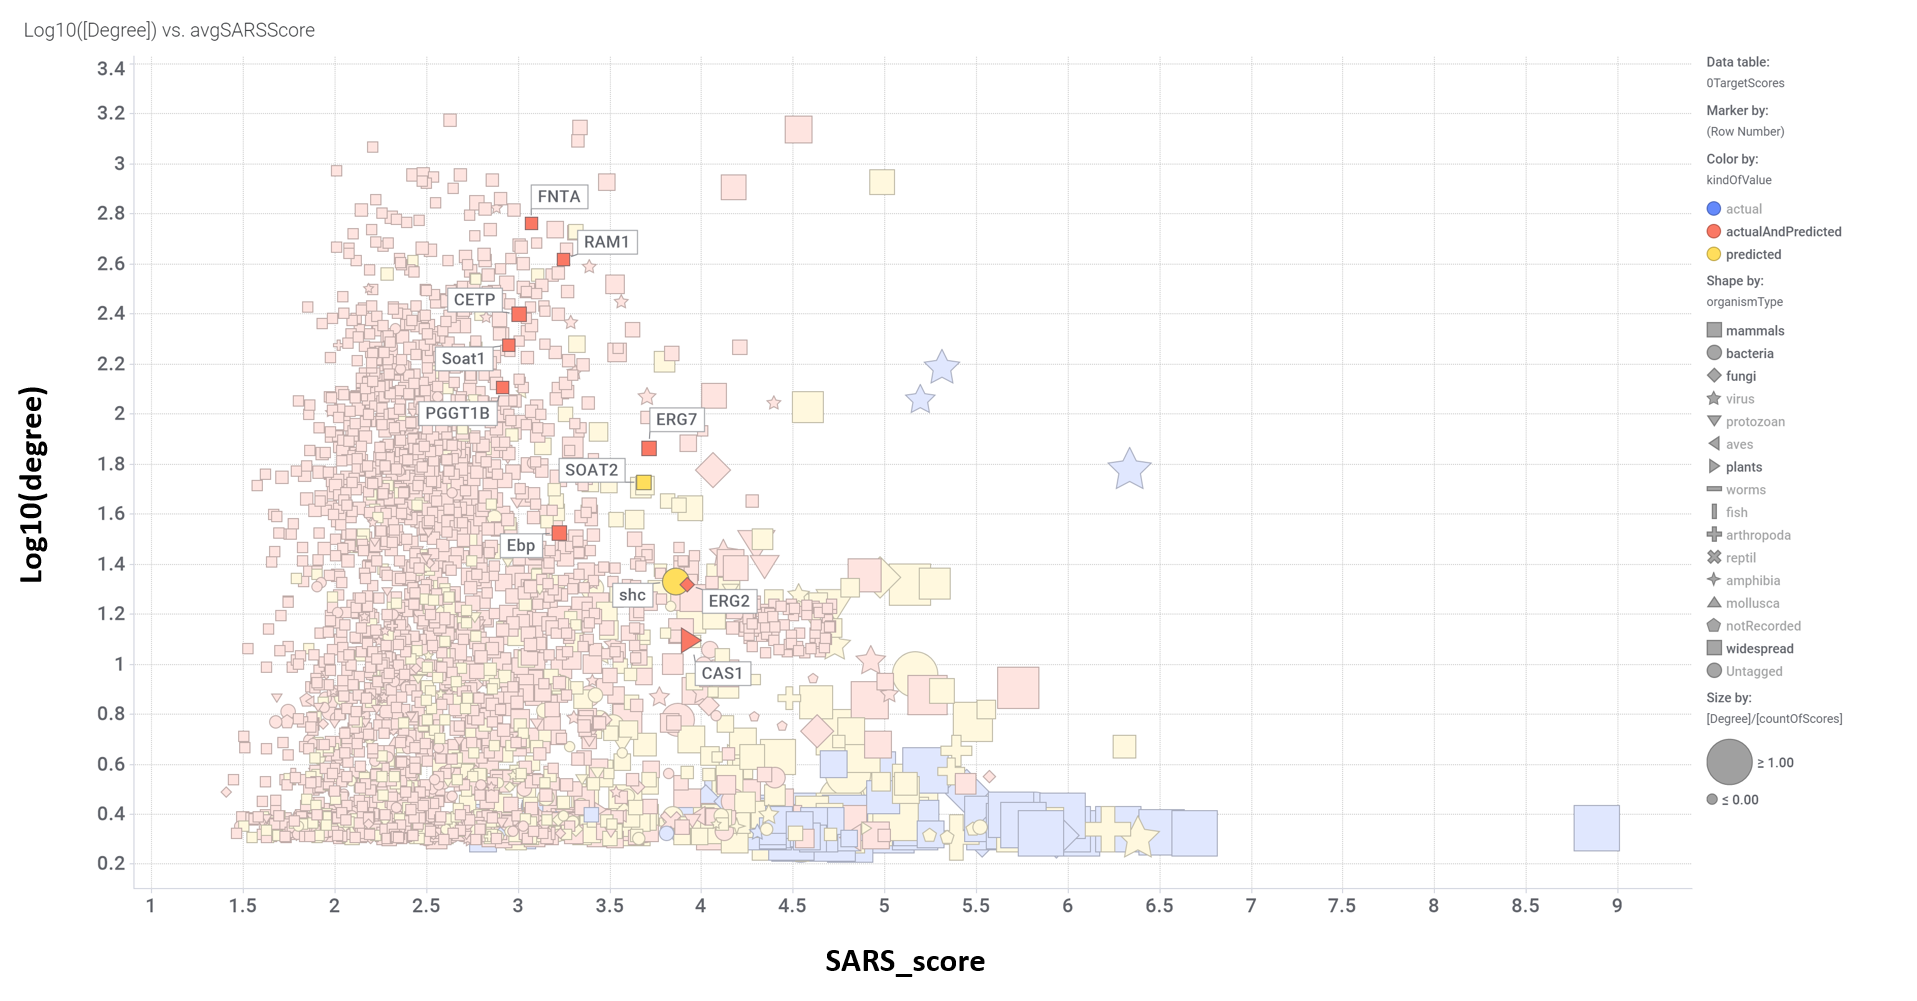
Aggregated SARS scores at the protein level: Log10(degree): logged number of interactions for each protein. SARS_Score: Aggregated score against coronavirus infection per protein. Size by Degree/CountOfScores represents the number of SARS actiove interactions vs total records per protein in ChEMBL. Color by condition of elements involved in score aggregation; they can be built from actual, predicted values or a combination of both. Shape indicates the organism type as described in the legend.
And how are these proteins involved in sterols synthesis ranked by their combination of scores.
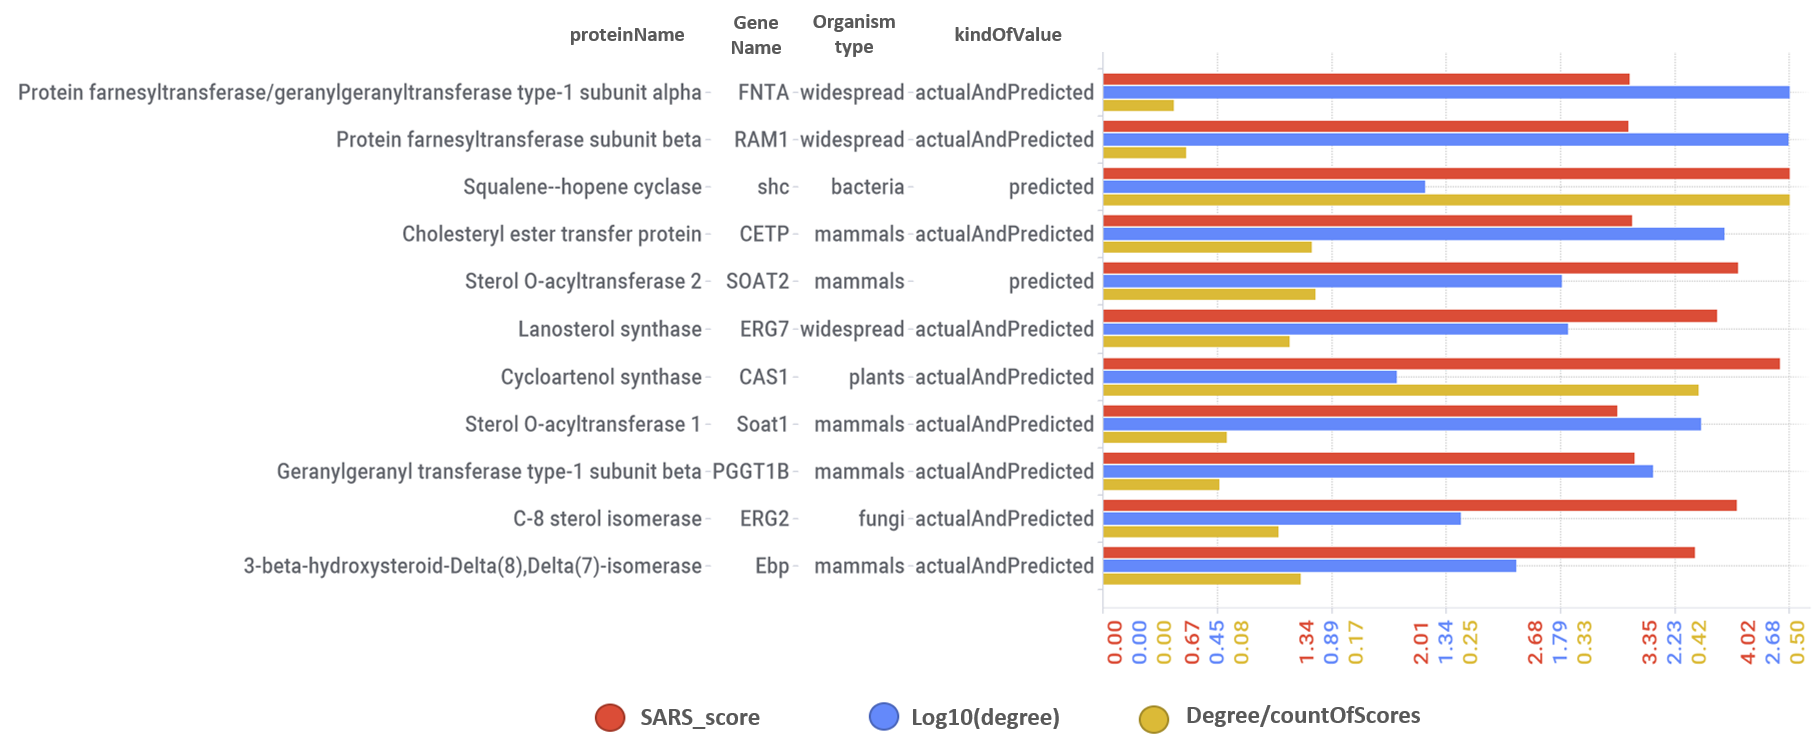
Log10(degree): logged number of interactions for each protein. SARS_Score: Aggregated score against coronavirus infection per protein. Size by Degree/CountOfScores represents the number of SARS active interactions vs total records per protein in ChEMBL.
And all the interactions of these proteins involved in sterols synthesis with actual or predicted SARS active compounds and the pathways they are involved in.
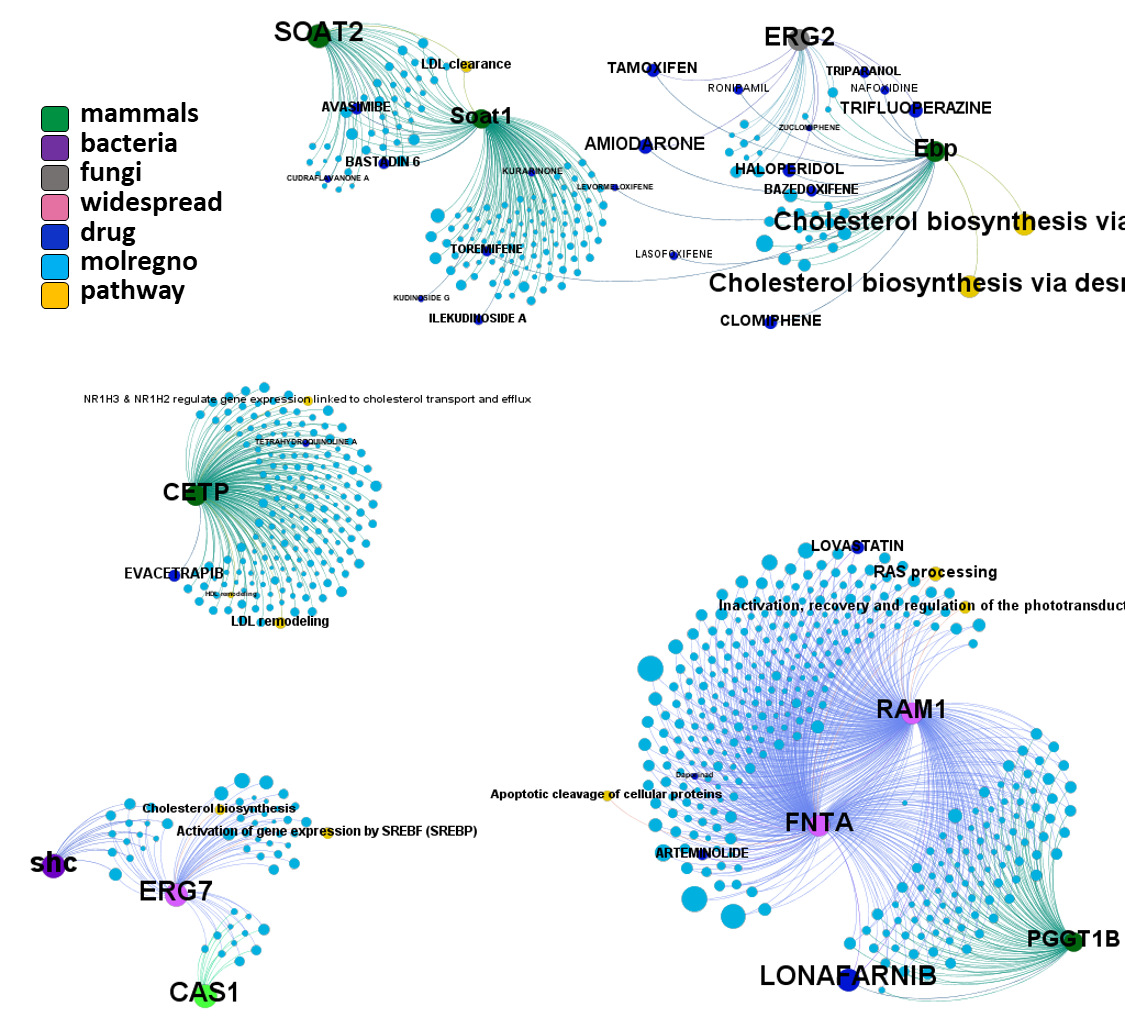
Sterol synthesis proteins interaction graph. Color by organism type.
Scatter plot flagging best ranked Ubiquitin tagging subunits, histone deacetylases and bromodomain proteins.
Aggregated SARS scores at the protein level: Log10(degree): logged number of interactions for each protein. SARS_Score: Aggregated score against coronavirus infection per protein. Size by Degree/CountOfScores represents the number of SARS actiove interactions vs total records per protein in ChEMBL. Color by condition of elements involved in score aggregation; they can be built from actual, predicted values or a combination of both. Shape indicates the organism type as described in the legend.
And how are these ubiquitin tagging subunits, histone deacetylases and bromodomain proteins ranked by their combination of scores.
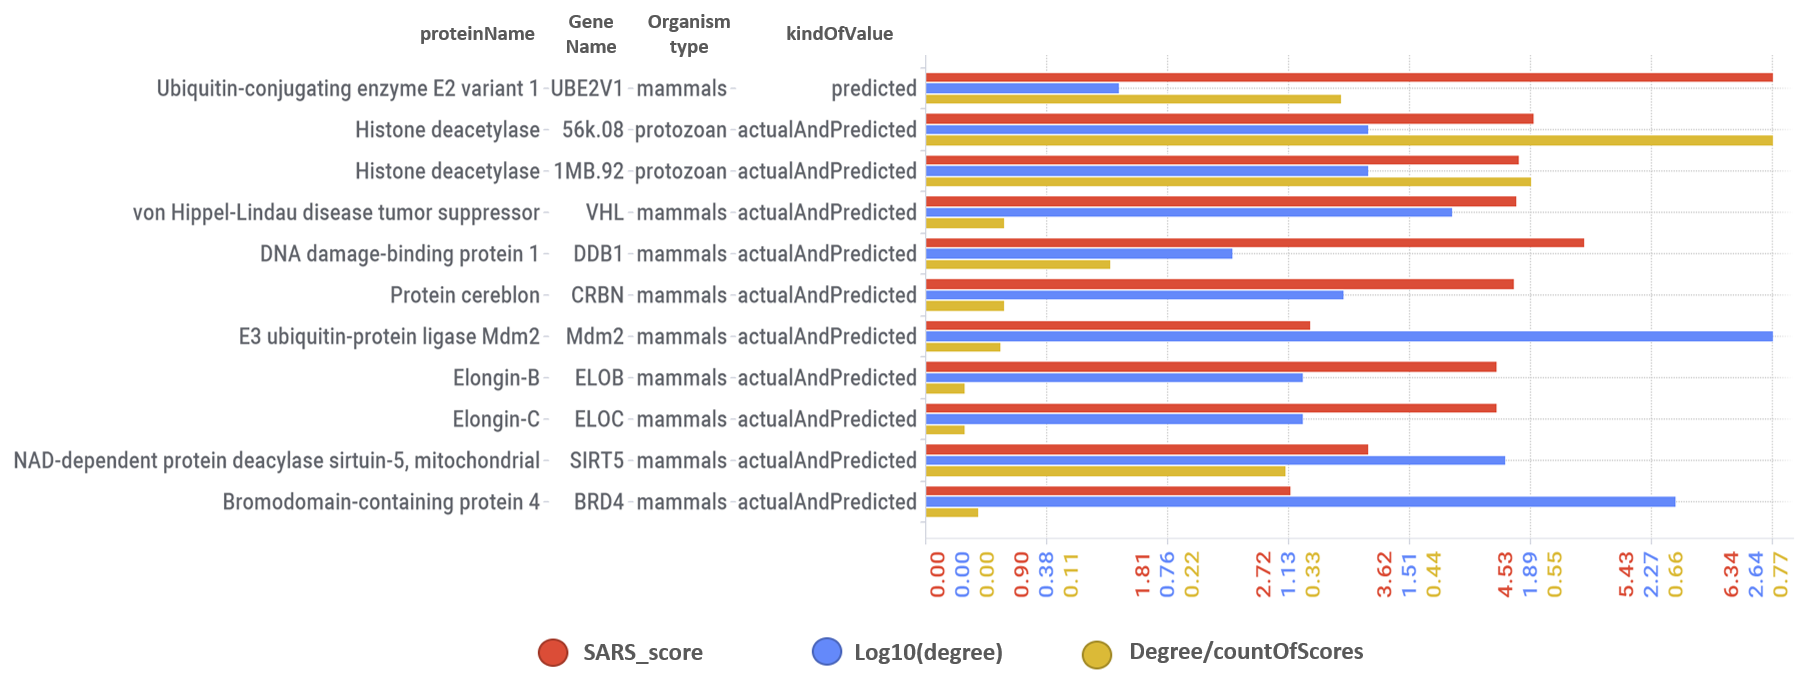
Log10(degree): logged number of interactions for each protein. SARS_Score: Aggregated score against coronavirus infection per protein. Size by Degree/CountOfScores represents the number of SARS active interactions vs total records per protein in ChEMBL.
And all the interactions of these ubiquitin tagging subunits, histone deacetylases and bromodomain proteins with actual or predicted SARS active compounds.
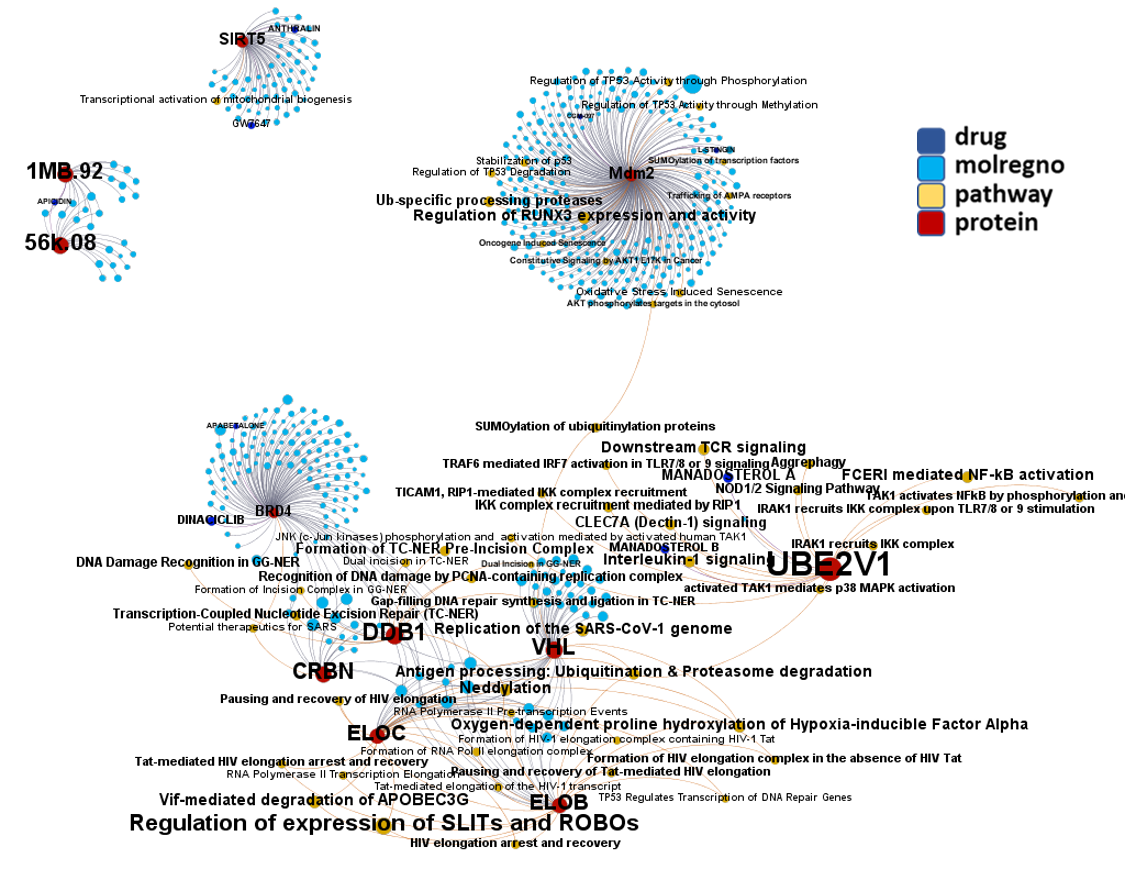
Molecular interactions reported in ChEMBL for ubiquitin tagging subunits, histone deacetylases and bromodomain proteins. Pathways added from Reactome.
Scatter plot flagging best ranked coagulation factors.
Aggregated SARS scores at the protein level: Log10(degree): logged number of interactions for each protein. SARS_Score: Aggregated score against coronavirus infection per protein. Size by Degree/CountOfScores represents the number of SARS actiove interactions vs total records per protein in ChEMBL. Color by condition of elements involved in score aggregation; they can be built from actual, predicted values or a combination of both. Shape indicates the organism type as described in the legend.
And how are these coagulation factors ranked by their combination of scores.
Log10(degree): logged number of interactions for each protein. SARS_Score: Aggregated score against coronavirus infection per protein. Size by Degree/CountOfScores represents the number of SARS active interactions vs total records per protein in ChEMBL.
And all the interactions of these coagulation factors with actual or predicted SARS active compounds.
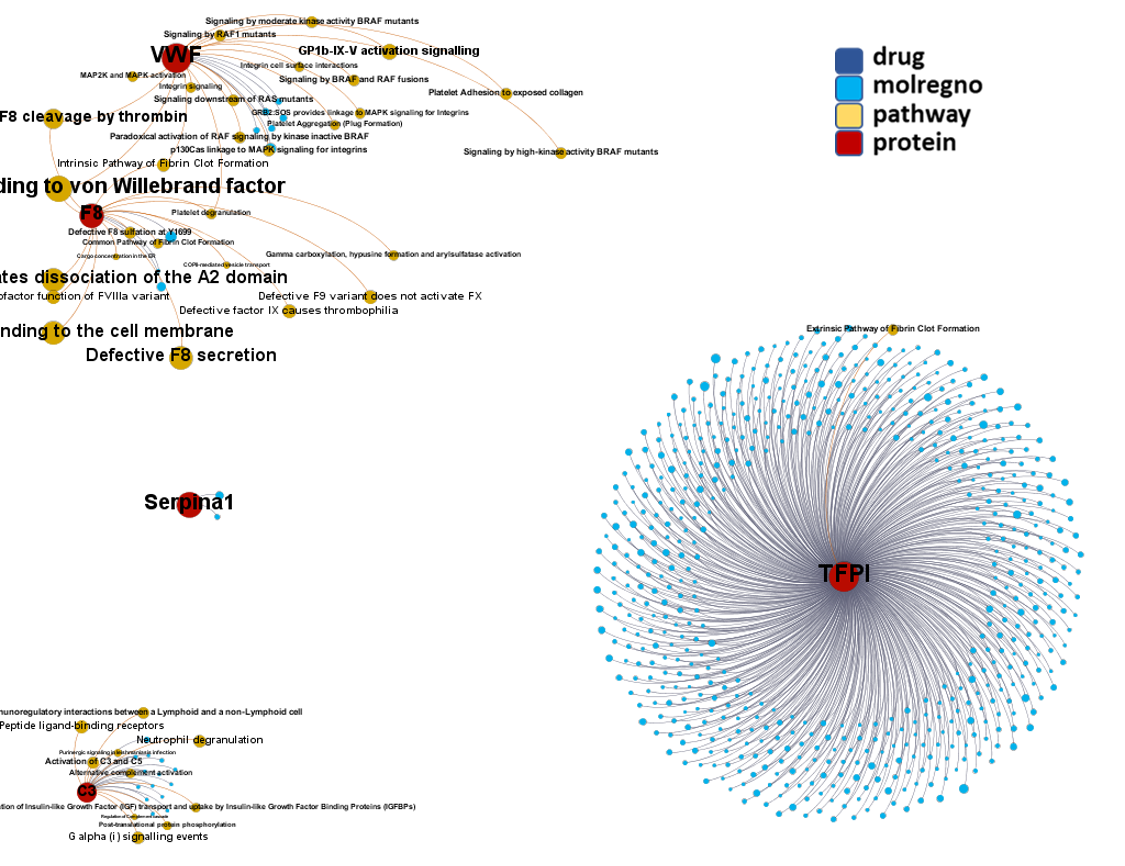
Molecular interactions graph for coagulation factors with ChEMBL compounds and Reactome Pathways. Protein nodes clolored by organism.
Scatter plot flagging best ranked serine/threonine and PI kinases.
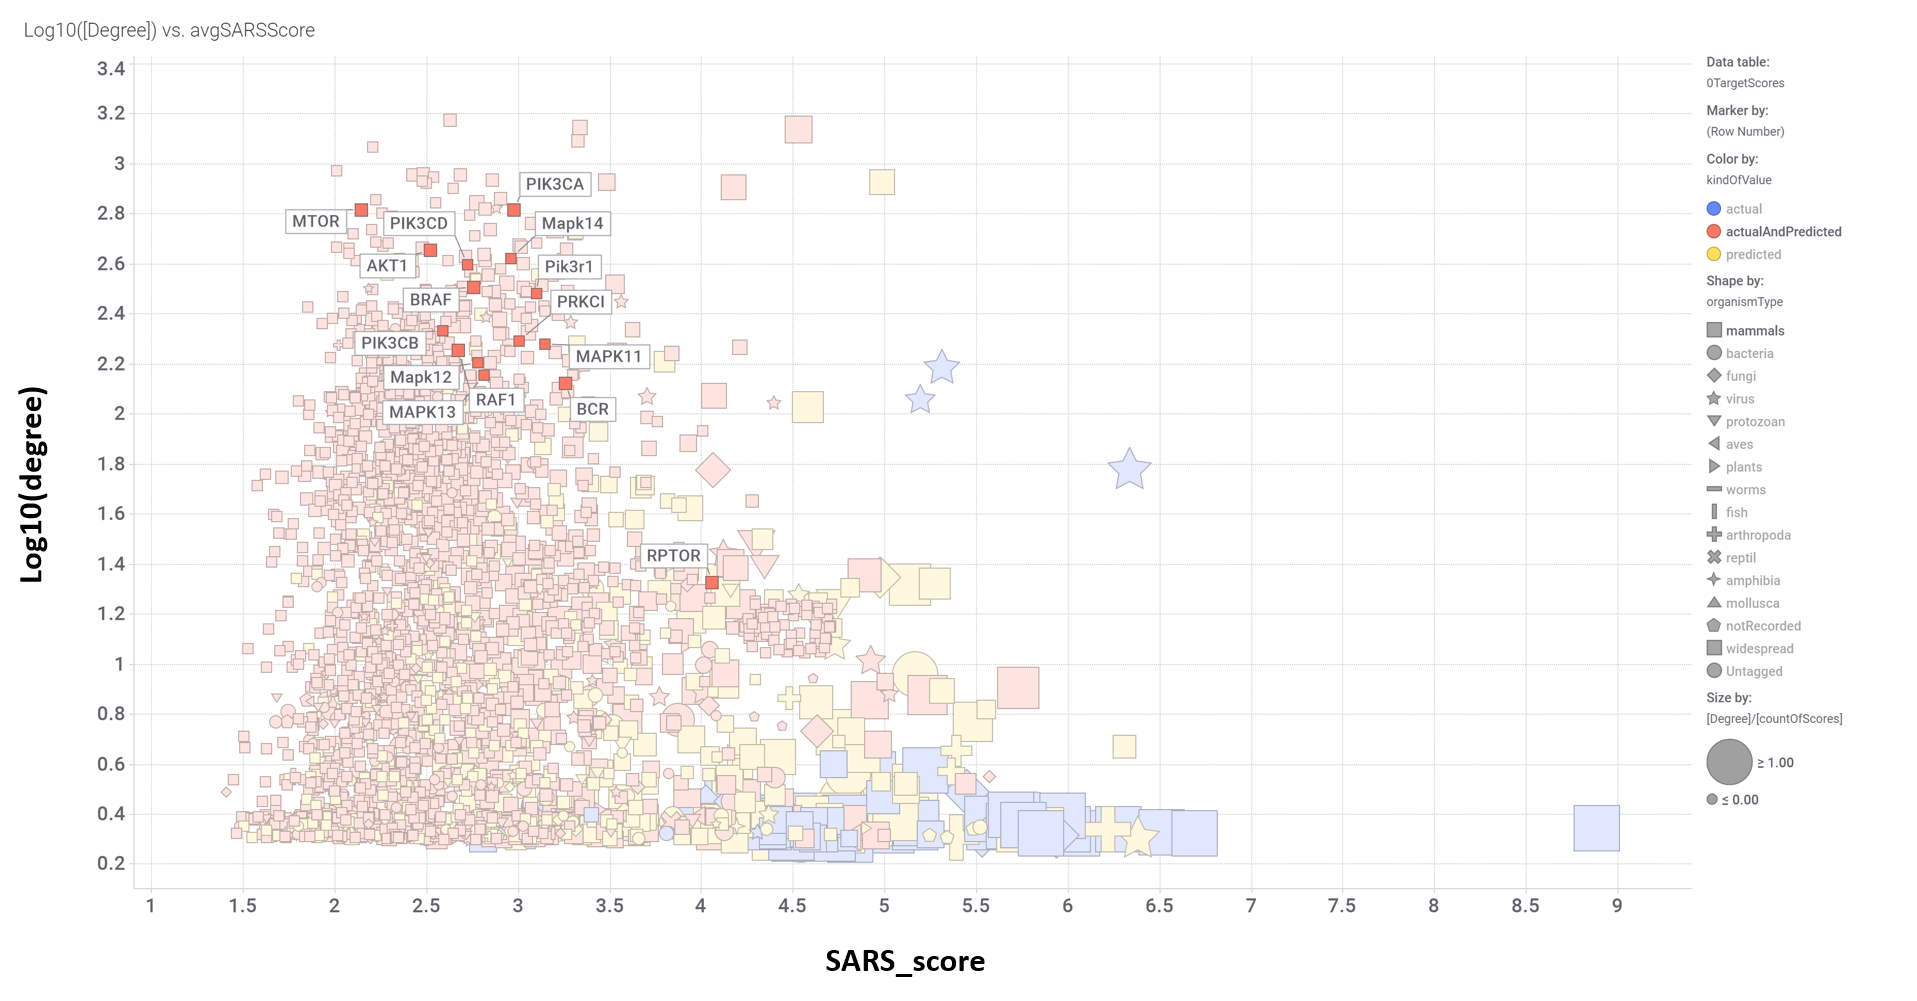
Aggregated SARS scores at the protein level: Log10(degree): logged number of interactions for each protein. SARS_Score: Aggregated score against coronavirus infection per protein. Size by Degree/CountOfScores represents the number of SARS actiove interactions vs total records per protein in ChEMBL. Color by condition of elements involved in score aggregation; they can be built from actual, predicted values or a combination of both. Shape indicates the organism type as described in the legend.
And how are these serine/threonine and PI kinases ranked by their combination of scores.
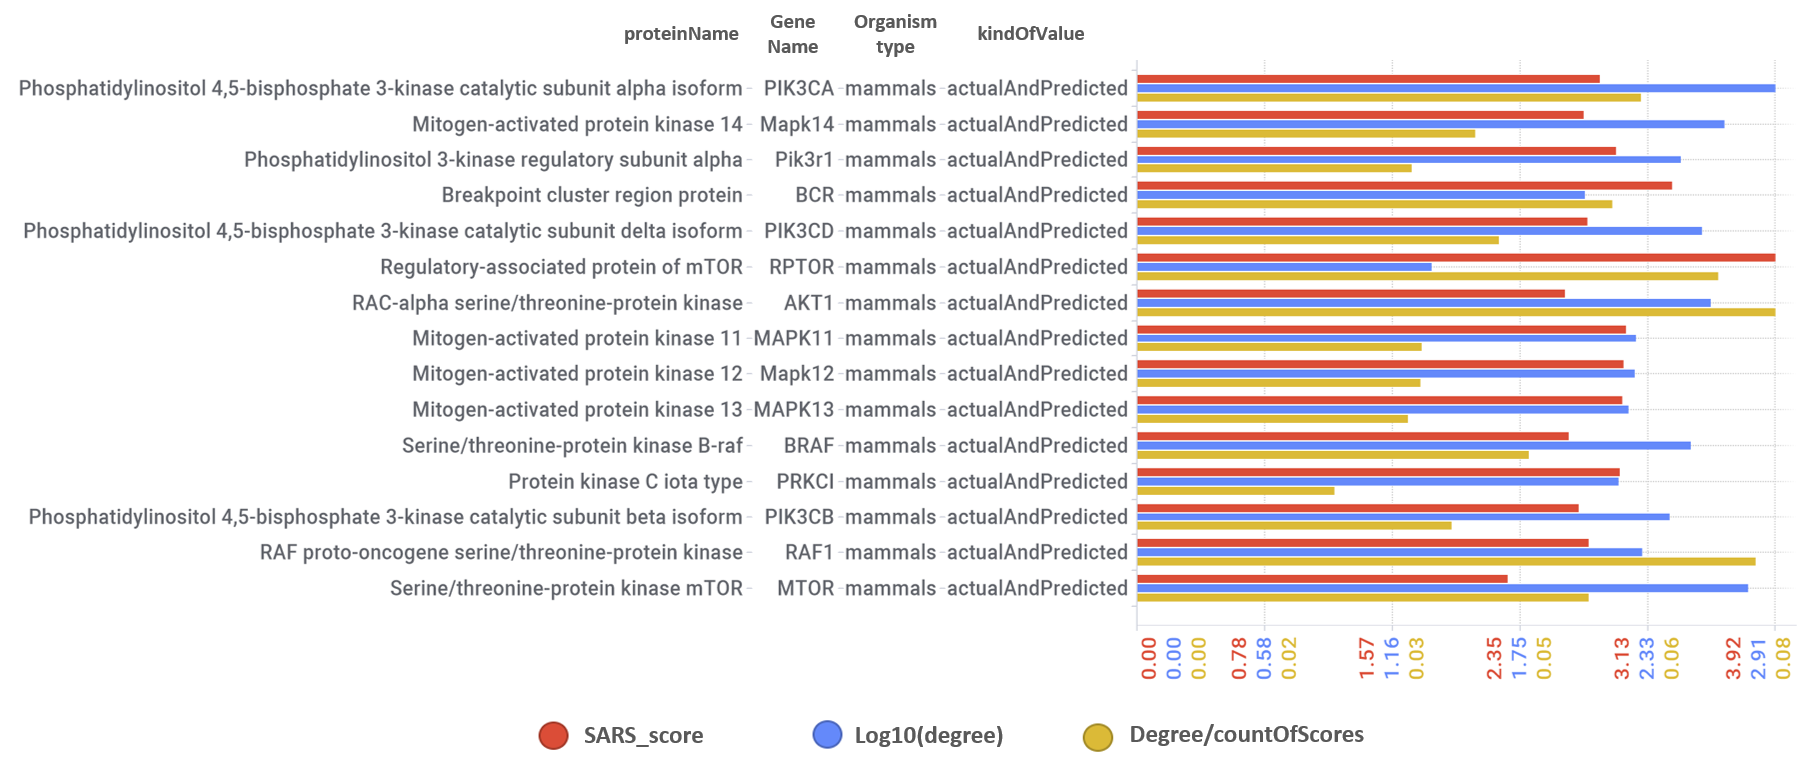
Log10(degree): logged number of interactions for each protein. SARS_Score: Aggregated score against coronavirus infection per protein. Size by Degree/CountOfScores represents the number of SARS active interactions vs total records per protein in ChEMBL.
And all the interactions of these serine/threonine and PI kinases with actual or predicted SARS active compounds.

Molecular interactions graph for serine/threonine and PI kinases with ChEMBL compounds and Reactome Pathways.
Scatter plot flagging best ranked Sigma receptors.

Aggregated SARS scores at the protein level: Log10(degree): logged number of interactions for each protein. SARS_Score: Aggregated score against coronavirus infection per protein. Size by Degree/CountOfScores represents the number of SARS actiove interactions vs total records per protein in ChEMBL. Color by condition of elements involved in score aggregation; they can be built from actual, predicted values or a combination of both. Shape indicates the organism type as described in the legend.
And how are these Sigma receptors ranked by their combination of scores.
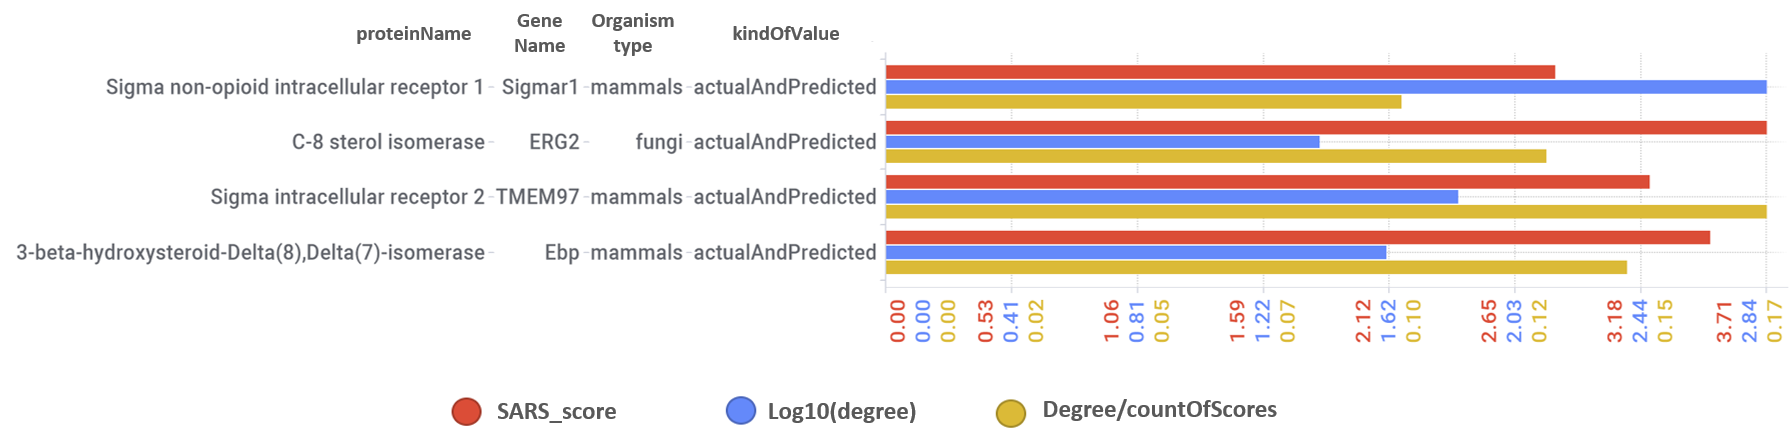
Log10(degree): logged number of interactions for each protein. SARS_Score: Aggregated score against coronavirus infection per protein. Size by Degree/CountOfScores represents the number of SARS active interactions vs total records per protein in ChEMBL.
And all the interactions of these Sigma receptors with actual or predicted SARS active compounds. Note the connections with cholesterol synthesis enzymes.

Molecular interactions graph for Sigma receptors with ChEMBL compounds and Reactome Pathways.
Scatter plot flagging best ranked nuclear steroid hormone receptors.
.
Aggregated SARS scores at the protein level: Log10(degree): logged number of interactions for each protein. SARS_Score: Aggregated score against coronavirus infection per protein. Size by Degree/CountOfScores represents the number of SARS actiove interactions vs total records per protein in ChEMBL. Color by condition of elements involved in score aggregation; they can be built from actual, predicted values or a combination of both. Shape indicates the organism type as described in the legend.
And how are these nuclear steroid hormone receptors ranked by their combination of scores.
Log10(degree): logged number of interactions for each protein. SARS_Score: Aggregated score against coronavirus infection per protein. Size by Degree/CountOfScores represents the number of SARS active interactions vs total records per protein in ChEMBL.
And all the interactions of these nuclear steroid hormone receptors with actual or predicted SARS active compounds.
Molecular interactions graph for nuclear steroid hormone receptors with ChEMBL compounds and Reactome Pathways.
Scatter plot flagging best ranked heat shock proteins.
.

Aggregated SARS scores at the protein level: Log10(degree): logged number of interactions for each protein. SARS_Score: Aggregated score against coronavirus infection per protein. Size by Degree/CountOfScores represents the number of SARS actiove interactions vs total records per protein in ChEMBL. Color by condition of elements involved in score aggregation; they can be built from actual, predicted values or a combination of both. Shape indicates the organism type as described in the legend.
And how are these HSPs ranked by their combination of scores.
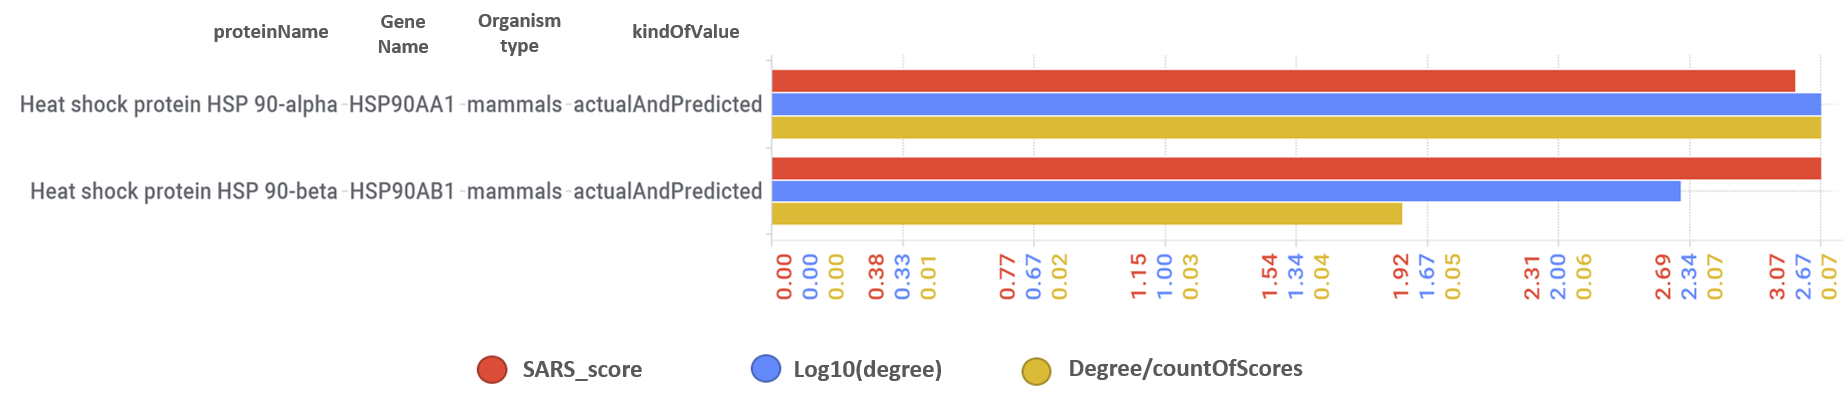
Log10(degree): logged number of interactions for each protein. SARS_Score: Aggregated score against coronavirus infection per protein. Size by Degree/CountOfScores represents the number of SARS active interactions vs total records per protein in ChEMBL.
And all the interactions of these HSPs with actual or predicted SARS active compounds.
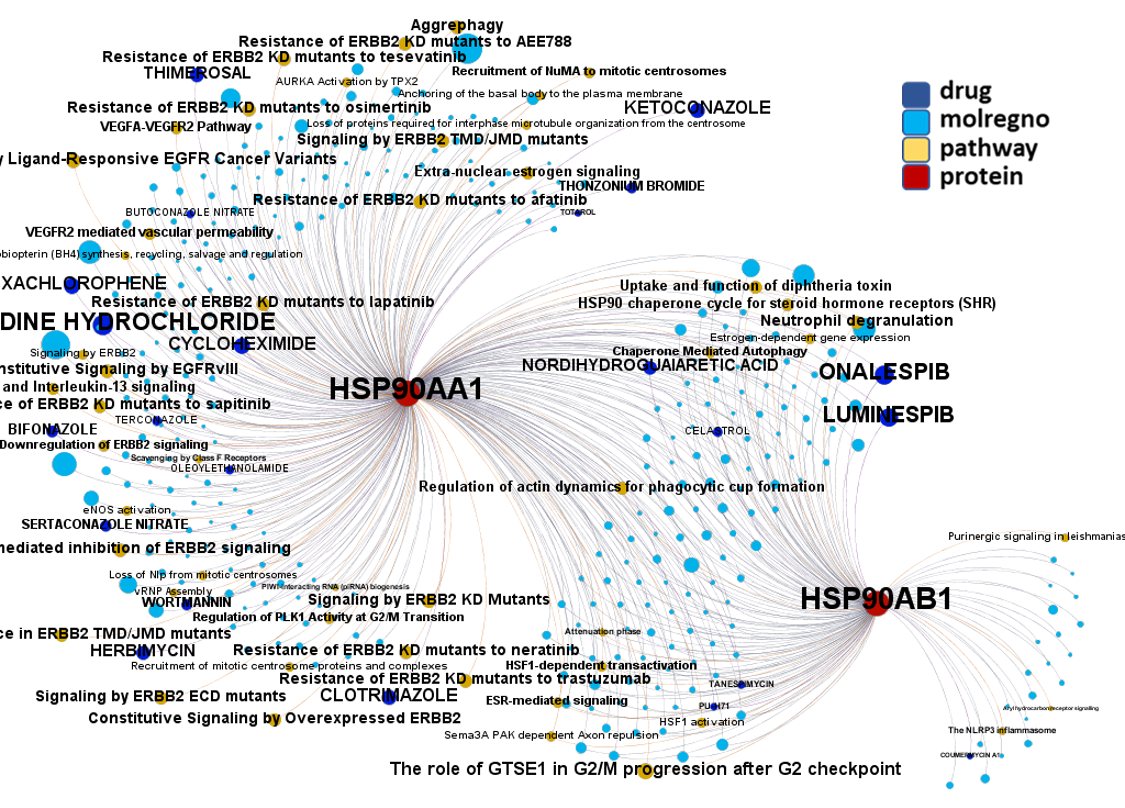
Molecular interactions graph for heat shock proteins with ChEMBL compounds and Reactome Pathways.
Scatter plot flagging best ranked ribosomal proteins.
.
Aggregated SARS scores at the protein level: Log10(degree): logged number of interactions for each protein. SARS_Score: Aggregated score against coronavirus infection per protein. Size by Degree/CountOfScores represents the number of SARS actiove interactions vs total records per protein in ChEMBL. Color by condition of elements involved in score aggregation; they can be built from actual, predicted values or a combination of both. Shape indicates the organism type as described in the legend.
And how are these ribosomal proteins ranked by their combination of scores.
Log10(degree): logged number of interactions for each protein. SARS_Score: Aggregated score against coronavirus infection per protein. Size by Degree/CountOfScores represents the number of SARS active interactions vs total records per protein in ChEMBL.
And all the interactions of these ribosomal proteins with actual or predicted SARS active compounds.
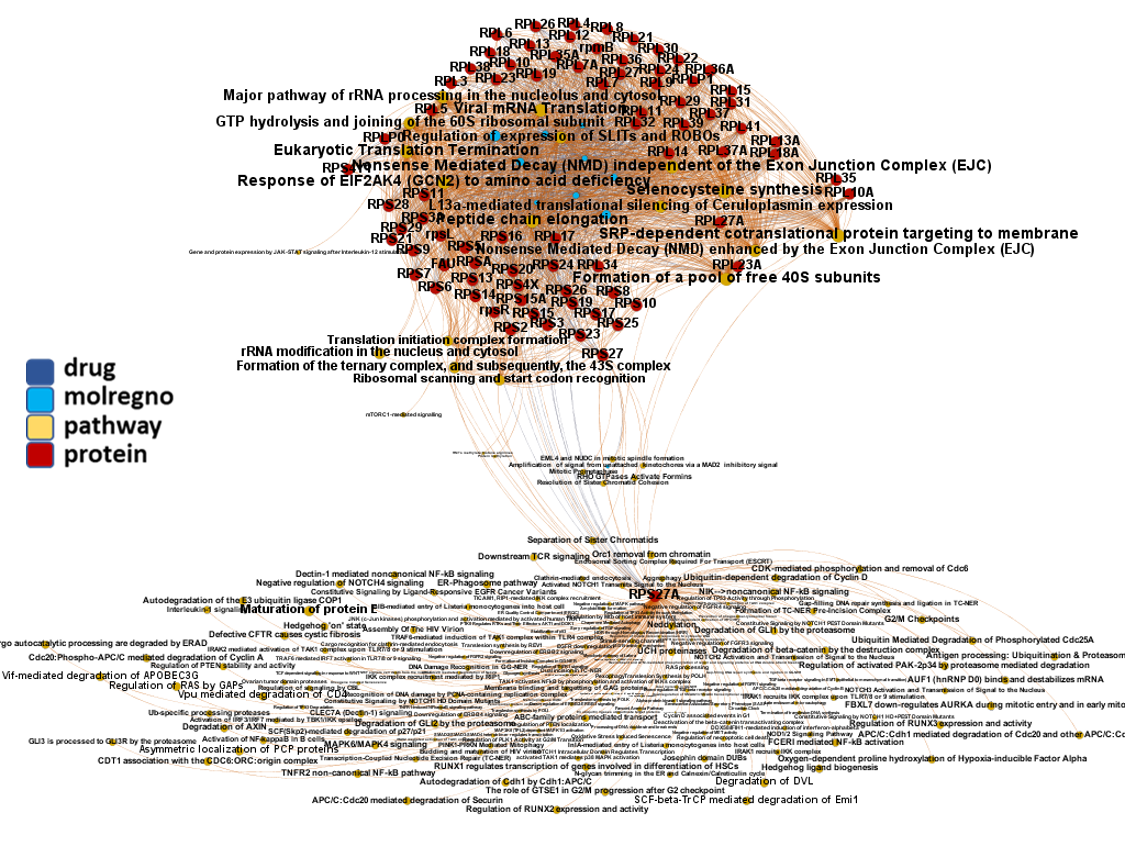
Molecular interactions graph for ribosomal proteins with ChEMBL compounds and Reactome Pathways.
Scatter plot flagging best ranked BCL2 proteins.
.

Aggregated SARS scores at the protein level: Log10(degree): logged number of interactions for each protein. SARS_Score: Aggregated score against coronavirus infection per protein. Size by Degree/CountOfScores represents the number of SARS actiove interactions vs total records per protein in ChEMBL. Color by condition of elements involved in score aggregation; they can be built from actual, predicted values or a combination of both. Shape indicates the organism type as described in the legend.
And how are these BCL2 proteins ranked by their combination of scores.
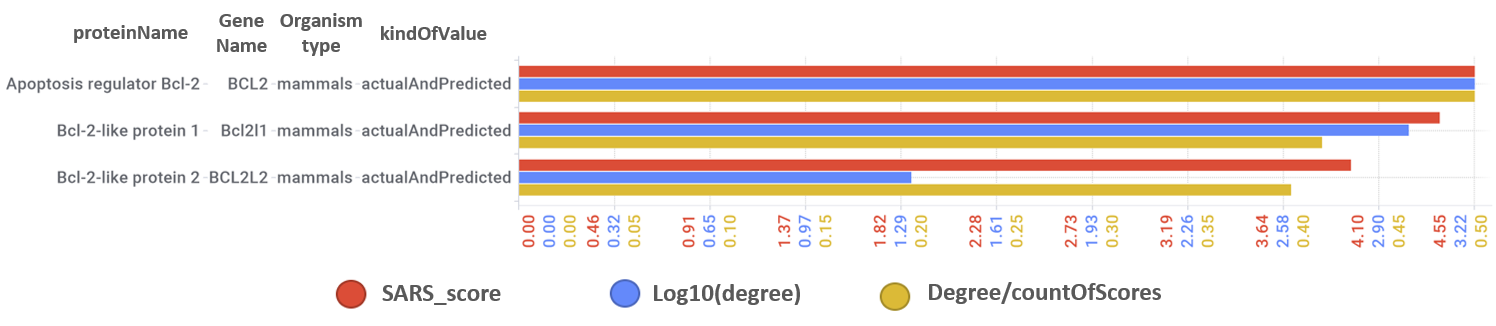
Log10(degree): logged number of interactions for each protein. SARS_Score: Aggregated score against coronavirus infection per protein. Size by Degree/CountOfScores represents the number of SARS active interactions vs total records per protein in ChEMBL.
And all the interactions of these BCL2 proteins with actual or predicted SARS active compounds.
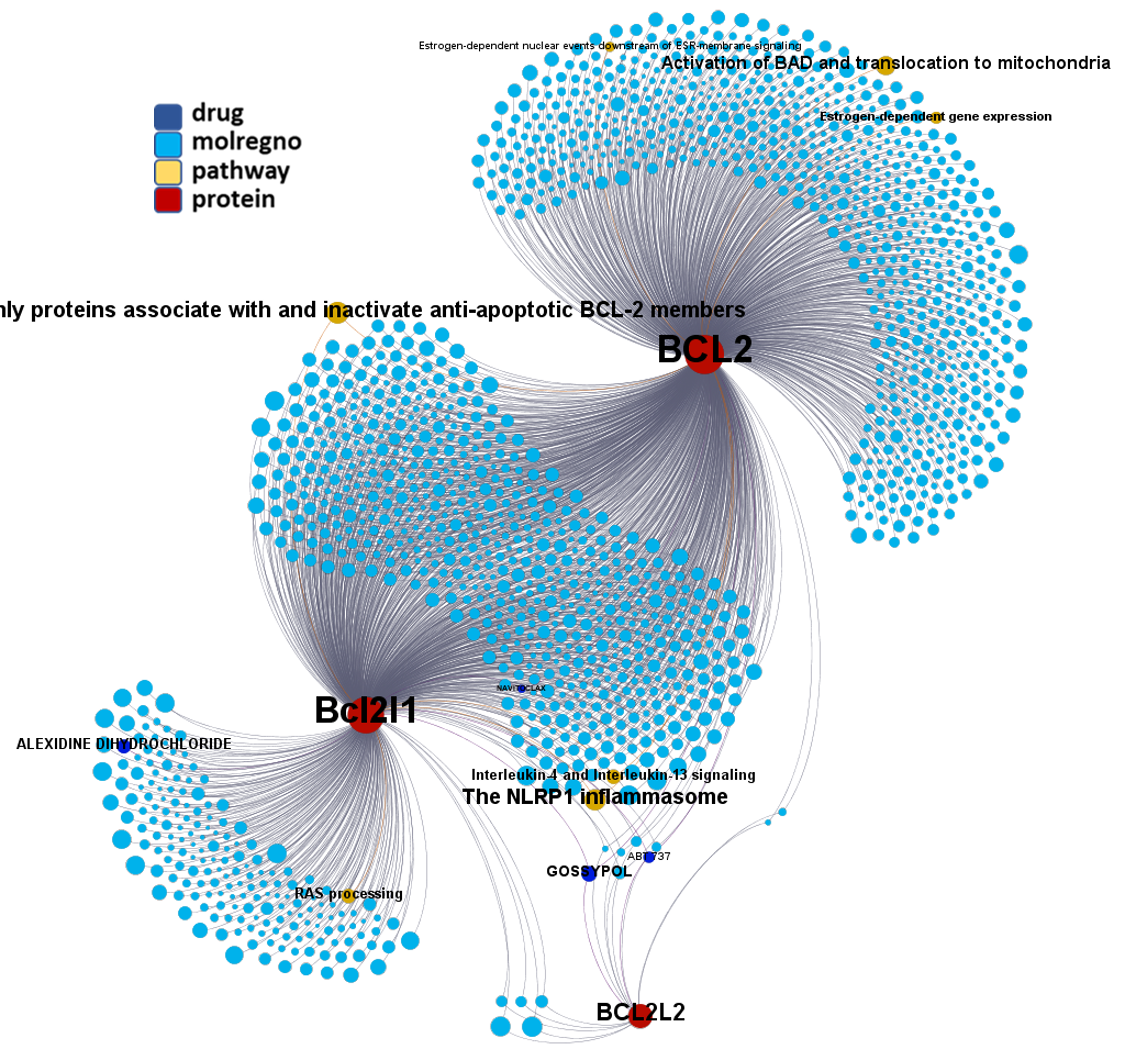
Molecular interactions graph for BCL2 proteins with ChEMBL compounds and Reactome Pathways.
Scatter plot flagging best ranked ion pumps.
.

Aggregated SARS scores at the protein level: Log10(degree): logged number of interactions for each protein. SARS_Score: Aggregated score against coronavirus infection per protein. Size by Degree/CountOfScores represents the number of SARS actiove interactions vs total records per protein in ChEMBL. Color by condition of elements involved in score aggregation; they can be built from actual, predicted values or a combination of both. Shape indicates the organism type as described in the legend.
And how are these ion pumps ranked by their combination of scores.
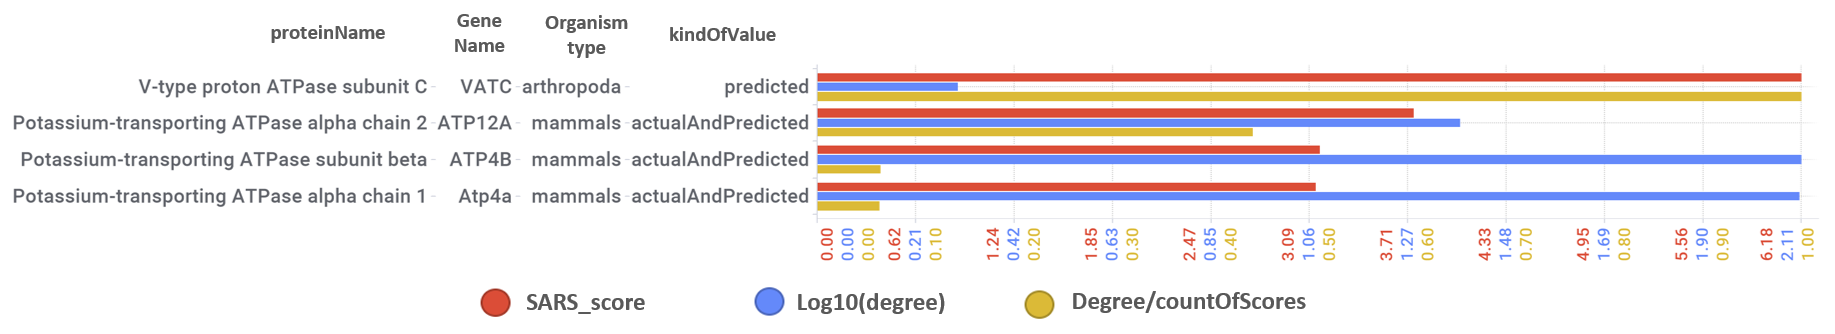
Log10(degree): logged number of interactions for each protein. SARS_Score: Aggregated score against coronavirus infection per protein. Size by Degree/CountOfScores represents the number of SARS active interactions vs total records per protein in ChEMBL.
And all the interactions of these ion pumps with actual or predicted SARS active compounds.
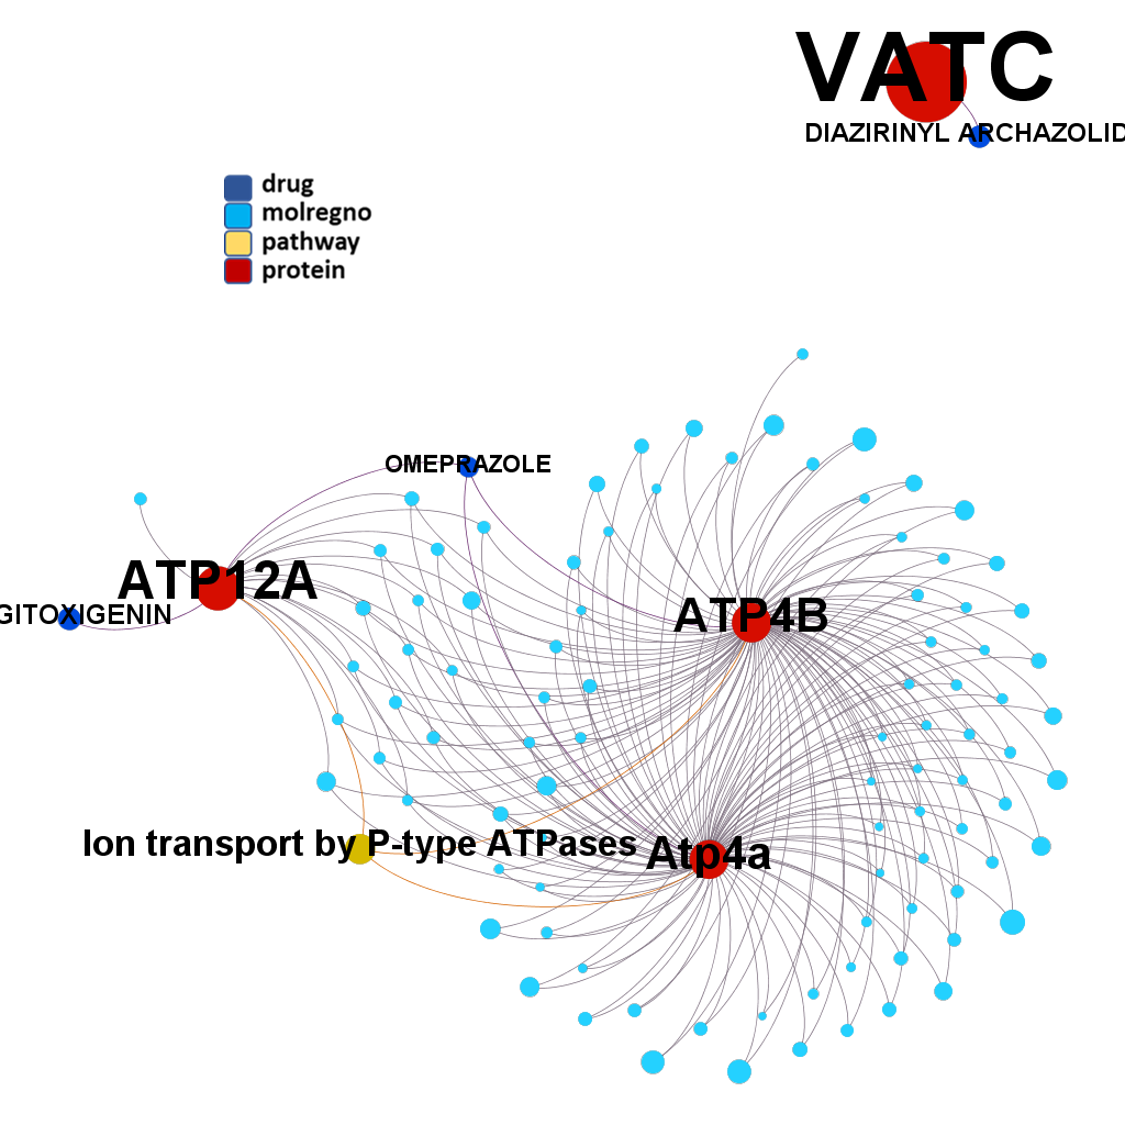
Molecular interactions graph for ion pumps with ChEMBL compounds and Reactome Pathways.
Scatter plot flagging best ranked adhesion proteins.
.

Aggregated SARS scores at the protein level: Log10(degree): logged number of interactions for each protein. SARS_Score: Aggregated score against coronavirus infection per protein. Size by Degree/CountOfScores represents the number of SARS actiove interactions vs total records per protein in ChEMBL. Color by condition of elements involved in score aggregation; they can be built from actual, predicted values or a combination of both. Shape indicates the organism type as described in the legend.
And how are these adhesion proteins ranked by their combination of scores.
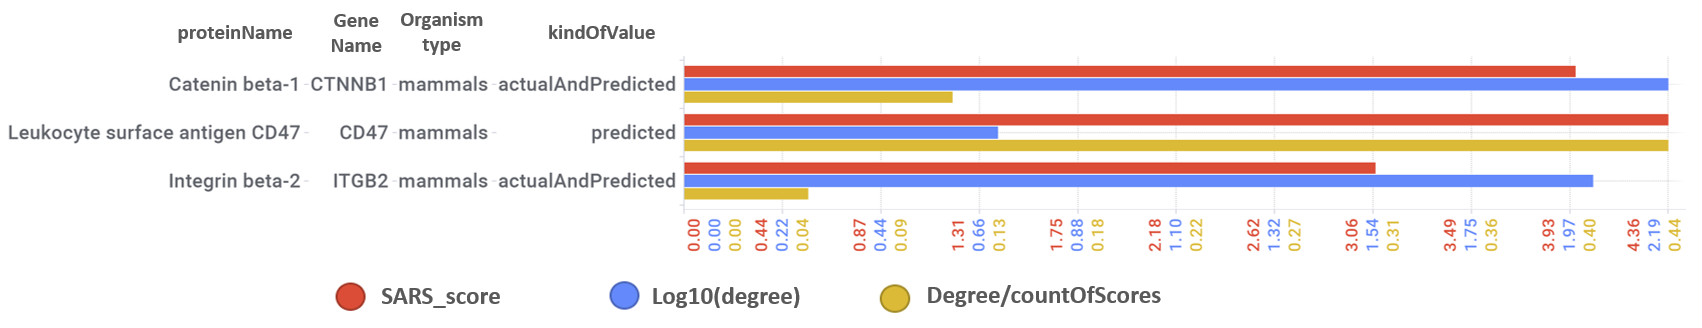
Log10(degree): logged number of interactions for each protein. SARS_Score: Aggregated score against coronavirus infection per protein. Size by Degree/CountOfScores represents the number of SARS active interactions vs total records per protein in ChEMBL.
And all the interactions of these adhesion proteins with actual or predicted SARS active compounds.

Molecular interactions graph for adhesion proteins with ChEMBL compounds and Reactome Pathways.
Scatter plot flagging GNRHR.
.

Aggregated SARS scores at the protein level: Log10(degree): logged number of interactions for each protein. SARS_Score: Aggregated score against coronavirus infection per protein. Size by Degree/CountOfScores represents the number of SARS actiove interactions vs total records per protein in ChEMBL. Color by condition of elements involved in score aggregation; they can be built from actual, predicted values or a combination of both. Shape indicates the organism type as described in the legend.
And how is GNRHR ranked by their combination of scores.
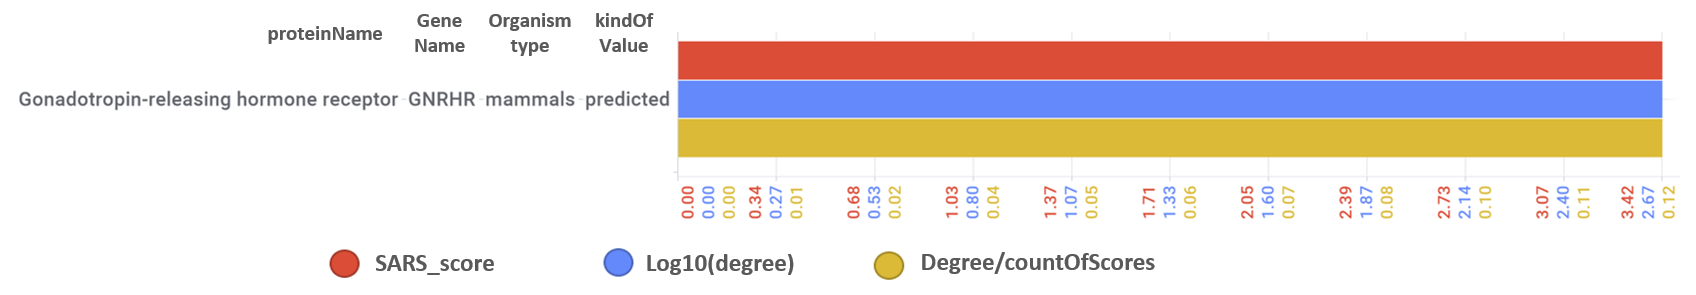
Log10(degree): logged number of interactions for each protein. SARS_Score: Aggregated score against coronavirus infection per protein. Size by Degree/CountOfScores represents the number of SARS active interactions vs total records per protein in ChEMBL.
And all the interactions of GNRHR with actual or predicted SARS active compounds.

Molecular interactions graph for GNRHR with ChEMBL compounds and Reactome Pathways.
Scatter plot flagging best ranked cholinesterases.
.

Aggregated SARS scores at the protein level: Log10(degree): logged number of interactions for each protein. SARS_Score: Aggregated score against coronavirus infection per protein. Size by Degree/CountOfScores represents the number of SARS actiove interactions vs total records per protein in ChEMBL. Color by condition of elements involved in score aggregation; they can be built from actual, predicted values or a combination of both. Shape indicates the organism type as described in the legend.
And how are these cholinesterases ranked by their combination of scores.
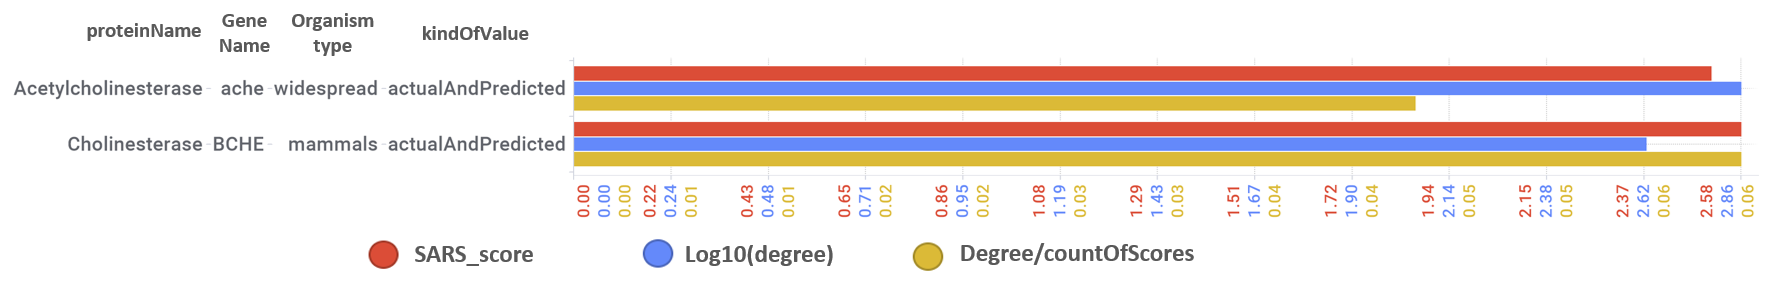
Log10(degree): logged number of interactions for each protein. SARS_Score: Aggregated score against coronavirus infection per protein. Size by Degree/CountOfScores represents the number of SARS active interactions vs total records per protein in ChEMBL.
And all the interactions of these cholinesterases with actual or predicted SARS active compounds.
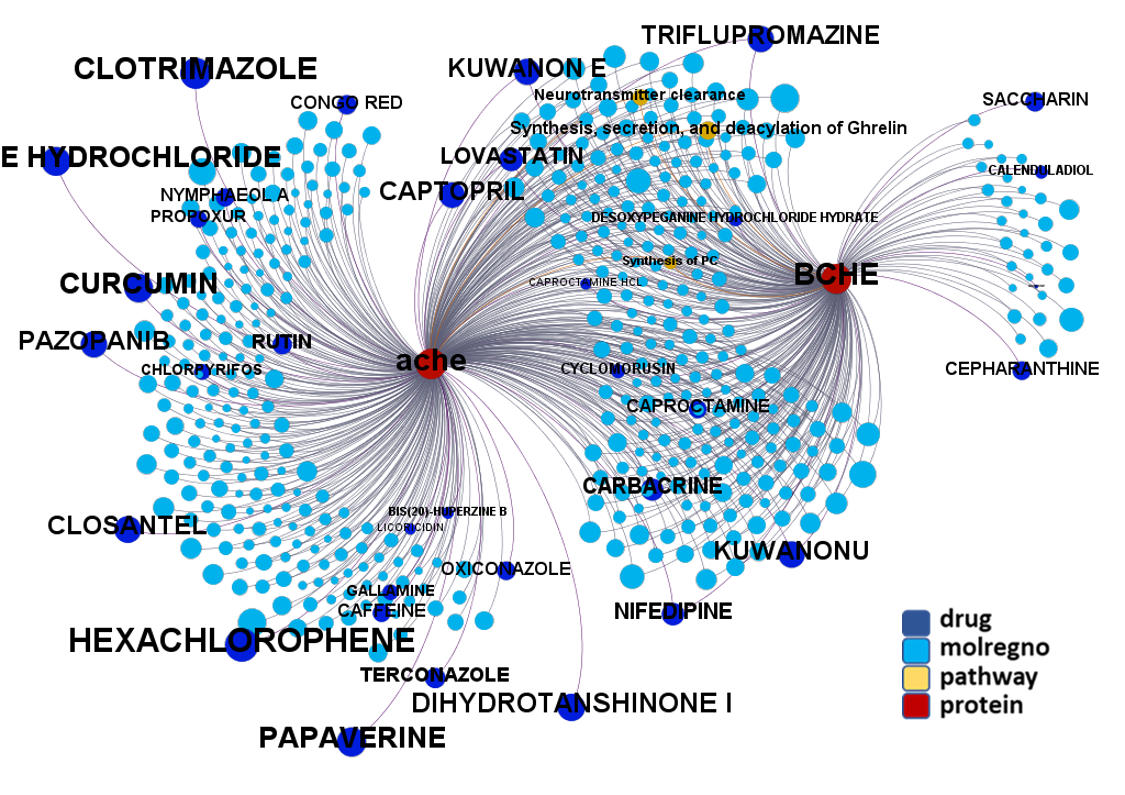
Molecular interactions graph for cholinesterases with ChEMBL compounds and Reactome Pathways.
Are cholinesterases an artifact or a non described/reported/suspected mechanism?
- No clear references have been found in literature linking cholinesterases to antiviral effects.
- Canonical cholinesterase inhibitors (DONEPEZIL, ECHOTHIOPHATE, GALANTAMINE, ISOFLUROPHATE, MINAPRINE, NEOSTIGMINE, PYRIDOSTIGMINE, RIVASTIGMINE, TACRINE) have not been identified as active against coronavirus, neither in actual nor predicted records.
- The selectivity index (Degree/CountOfScores representing the number of SARS active interactions vs total records per protein in ChEMBL) is very low, suggesting an artefactual finding caused by over representation of cholinesetrase molecules.
- However, if we look at the selectivity of these interactions, although we find quite high pleiotropy among the drugs interacting with cholinesterases, most of molregnos seem to be uniquely associated to cholinesterase activity. See interactions graph below.

All interactions of cholinesterase compounds identified as SARS active.
Scatter plot flagging best ranked additional viral proteins.
.

Aggregated SARS scores at the protein level: Log10(degree): logged number of interactions for each protein. SARS_Score: Aggregated score against coronavirus infection per protein. Size by Degree/CountOfScores represents the number of SARS actiove interactions vs total records per protein in ChEMBL. Color by condition of elements involved in score aggregation; they can be built from actual, predicted values or a combination of both. Shape indicates the organism type as described in the legend.
And how are these additional viral proteins ranked by their combination of scores.

Log10(degree): logged number of interactions for each protein. SARS_Score: Aggregated score against coronavirus infection per protein. Size by Degree/CountOfScores represents the number of SARS active interactions vs total records per protein in ChEMBL.
And all the interactions of these viral proteins with actual or predicted SARS active compounds.

Molecular interactions graph for additional viral proteins with ChEMBL compounds and Reactome Pathways.
Scatter plot flagging best ranked non-classified proteins .
.

Aggregated SARS scores at the protein level: Log10(degree): logged number of interactions for each protein. SARS_Score: Aggregated score against coronavirus infection per protein. Size by Degree/CountOfScores represents the number of SARS actiove interactions vs total records per protein in ChEMBL. Color by condition of elements involved in score aggregation; they can be built from actual, predicted values or a combination of both. Shape indicates the organism type as described in the legend.
And how are these non-classified proteins ranked by their combination of scores.
Log10(degree): logged number of interactions for each protein. SARS_Score: Aggregated score against coronavirus infection per protein. Size by Degree/CountOfScores represents the number of SARS active interactions vs total records per protein in ChEMBL.
And all the interactions of these non classified proteins with actual or predicted SARS active compounds.
Molecular interactions graph for non-classified proteins with ChEMBL compounds and Reactome Pathways. Color by protein organism.
For these proteins, drTarget has failed to find clear literature references supporting their relevance against viral infections.
They may be false positives, but they can be new subjects for research instead.
Why not to give them a chance in an early prospective program?
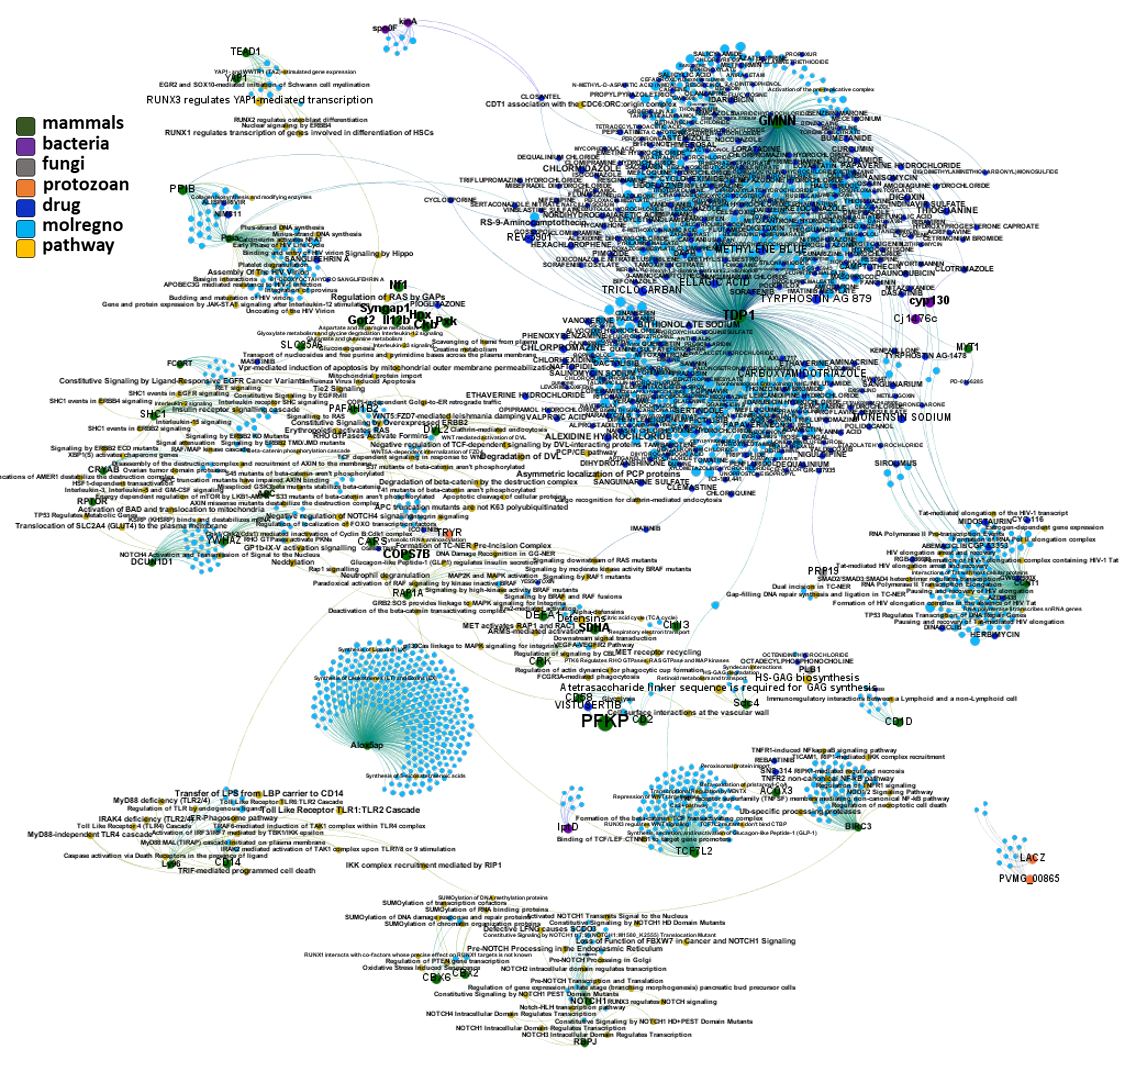
Scatter plot flagging all ChEMBL proteins linked to SARS pathways annotated in Reactome DB. Note significant scores for SigmaR1, Jak & ROCK kinases, FURIN protease, viral replicases, FKBPs, histone deacetylase HDAC2, glucocorticoid receptor NR3C1, bromodomain protein BRD4, Ub-transference subunits like CRBN and VHL, leukotriene receptor CYSLTR1 and Interleukin-6 receptor.
Aggregated SARS scores at the protein level: Log10(degree): logged number of interactions for each protein. SARS_Score: Aggregated score against coronavirus infection per protein. Size by Degree/CountOfScores represents the number of SARS actiove interactions vs total records per protein in ChEMBL. Color by condition of elements involved in score aggregation; they can be built from actual, predicted values or a combination of both. Shape indicates the organism type as described in the legend.
And how are these proteins linked to SARS pathways annotated in Reactome DB ranked by their combination of scores.
Log10(degree): logged number of interactions for each protein. SARS_Score: Aggregated score against coronavirus infection per protein. Size by Degree/CountOfScores represents the number of SARS active interactions vs total records per protein in ChEMBL.
And all the interactions of these proteins linked to SARS pathways annotated in Reactome DB with actual or predicted SARS active compounds.
All proteins linked to SARS pathways annotated in Reactome DB interaction map. Protein colors by organism.
Note how SARS pathways from reactome contain proteins identified by drTarget algorithms as relevant for coronavirus infections.
| geneName | protName | avgSARSScore | kindOfValue | organismType | Degree | protein_class_name |
| rep | Replicase polyprotein 1ab | 5.23983187 | actual | virus | 147 | Enzyme |
| 1a | Replicase polyprotein 1a | 5.146501741 | actual | virus | 101 | Enzyme |
| VHL | von Hippel-Lindau disease tumor suppressor | 4.412667156 | actualAndPredicted | mammals | 43 | Unclassified protein |
| FURIN | Furin | 3.804257957 | predicted | mammals | 169 | Serine protease S8B subfamily |
| CRBN | Protein cereblon | 4.397967462 | actualAndPredicted | mammals | 19 | Unclassified protein |
| Sigmar1 | Sigma non-opioid intracellular receptor 1 | 2.816706135 | actualAndPredicted | mammals | 692 | Membrane receptor, Other membrane protein |
| NR3C1 | Glucocorticoid receptor | 2.841753598 | actualAndPredicted | mammals | 348 | Nuclear hormone receptor subfamily 3 group C member 1 |
| CYSLTR1 | Cysteinyl leukotriene receptor 1 | 3.065313119 | actualAndPredicted | mammals | 182 | Leukotriene receptor |
| BRD4 | Bromodomain-containing protein 4 | 2.729343003 | actualAndPredicted | mammals | 218 | Bromodomain |
| IL6R | Interleukin-6 receptor subunit alpha | 4.640871157 | actual | mammals | 1 | Membrane receptor, Secreted protein |
| JAK2 | Tyrosine-protein kinase JAK2 | 2.364319566 | actualAndPredicted | mammals | 328 | Tyrosine protein kinase JakA family, Tyrosine protein kinase JakB family |
| TUBB | Tubulin beta chain | 2.879798395 | actualAndPredicted | mammals | 92 | Structural protein |
| JAK1 | Tyrosine-protein kinase JAK1 | 2.409715954 | actualAndPredicted | mammals | 195 | Tyrosine protein kinase JakA family, Tyrosine protein kinase JakB family |
| JAK3 | Tyrosine-protein kinase JAK3 | 2.312167295 | actualAndPredicted | mammals | 197 | Tyrosine protein kinase JakA family, Tyrosine protein kinase JakB family |
| Hdac2 | Histone deacetylase 2 | 2.364636615 | actualAndPredicted | mammals | 173 | HDAC class I |
| FKBP1A | Peptidyl-prolyl cis-trans isomerase FKBP1A | 2.811545153 | actualAndPredicted | mammals | 57 | Isomerase |
| TBK1 | Serine/threonine-protein kinase TBK1 | 2.492399882 | actualAndPredicted | mammals | 113 | Other protein kinase IKK family |
| ATP1A1 | Sodium/potassium-transporting ATPase subunit alpha-1 | 3.00165687 | actualAndPredicted | mammals | 25 | Hydrolase, Sodium potassium ATPase |
Note: Reactome Pathways is building New SARS-CoV-2 pathways to be included in the DB. Meanwhile, drTarget uses the existing SARS-CoV-1 paths, presumably similar, if not identical. However it is very likely that intensive research on SARS-CoV-2 reveals new networks to be included in future analyses.
Interestingly, Riva and co-workers identify a good number of these targets from a gene enrichment approach.
Host proteases, ABC and SLC transporters, voltage-gated potassium channels, TRPV1 channel, numerous G-protein coupled receptors (chemokine, LTB4, CRHR1, arginine-vasopressin, angiotensin, serotonin, dopamine and opioid receptors), sterol synthesis proteins (FNTA), tyrosine protein kinases (IGF1R, ABL1), steroid hormone receptors (ESR1, ESR2, PGR) and ser/thr-kinases in the MAPK/RAS/BRAF pathway (MAPK14, BRAF & RAS1) identified as potential targets for CoViD have emerged from these study as well. See graphical summary and reference below.
Discovery of SARS-CoV-2 antiviral drugs through large-scale compound repurposing
Laura Riva, Shuofeng Yuan, […] Sumit K. Chanda
Nature volume 586, pages113–119(2020). Access to content.
Abstract
The emergence of severe acute respiratory syndrome coronavirus 2 (SARS-CoV-2) in 2019 has triggered an ongoing global pandemic of the severe pneumonia-like disease coronavirus disease 2019 (COVID-19)1. The development of a vaccine is likely to take at least 12–18 months, and the typical timeline for approval of a new antiviral therapeutic agent can exceed 10 years. Thus, repurposing of known drugs could substantially accelerate the deployment of new therapies for COVID-19. Here we profiled a library of drugs encompassing approximately 12,000 clinical-stage or Food and Drug Administration (FDA)-approved small molecules to identify candidate therapeutic drugs for COVID-19. We report the identification of 100 molecules that inhibit viral replication of SARS-CoV-2, including 21 drugs that exhibit dose–response relationships. Of these, thirteen were found to harbour effective concentrations commensurate with probable achievable therapeutic doses in patients, including the PIKfyve kinase inhibitor apilimod2,3,4 and the cysteine protease inhibitors MDL-28170, Z LVG CHN2, VBY-825 and ONO 5334. Notably, MDL-28170, ONO 5334 and apilimod were found to antagonize viral replication in human pneumocyte-like cells derived from induced pluripotent stem cells, and apilimod also demonstrated antiviral efficacy in a primary human lung explant model. Since most of the molecules identified in this study have already advanced into the clinic, their known pharmacological and human safety profiles will enable accelerated preclinical and clinical evaluation of these drugs for the treatment of COVID-19.

Cell map of the protein targets identified by Riva and co-workers.
Some interesting matches can also be found in Gordon’s et al approach, based on the MS measurement of interactions between viral and host proteins:
Sigma receptors, ABC transporters (ABCC1), bromodomain proteins (BRD4) and proteases (PCSK6, PSEN) are most relevant matches.
A SARS-CoV-2 protein interaction map reveals targets for drug repurposing
David E. Gordon, Gwendolyn M. Jang, […]Nevan J. Krogan
Nature volume 583, pages459–468(2020)Cite this article
Abstract
A newly described coronavirus named severe acute respiratory syndrome coronavirus 2 (SARS-CoV-2), which is the causative agent of coronavirus disease 2019 (COVID-19), has infected over 2.3 million people, led to the death of more than 160,000 individuals and caused worldwide social and economic disruption1,2. There are no antiviral drugs with proven clinical efficacy for the treatment of COVID-19, nor are there any vaccines that prevent infection with SARS-CoV-2, and efforts to develop drugs and vaccines are hampered by the limited knowledge of the molecular details of how SARS-CoV-2 infects cells. Here we cloned, tagged and expressed 26 of the 29 SARS-CoV-2 proteins in human cells and identified the human proteins that physically associated with each of the SARS-CoV-2 proteins using affinity-purification mass spectrometry, identifying 332 high-confidence protein–protein interactions between SARS-CoV-2 and human proteins. Among these, we identify 66 druggable human proteins or host factors targeted by 69 compounds (of which, 29 drugs are approved by the US Food and Drug Administration, 12 are in clinical trials and 28 are preclinical compounds). We screened a subset of these in multiple viral assays and found two sets of pharmacological agents that displayed antiviral activity: inhibitors of mRNA translation and predicted regulators of the sigma-1 and sigma-2 receptors. Further studies of these host-factor-targeting agents, including their combination with drugs that directly target viral enzymes, could lead to a therapeutic regimen to treat COVID-19.
https://www.nature.com/articles/s41586-020-2286-9
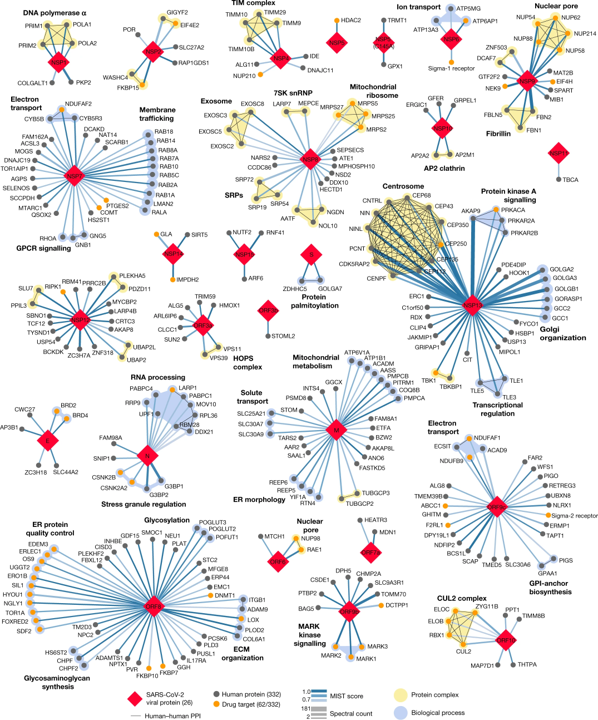
332 high-confidence interactions between 26 SARS-CoV-2 proteins (red diamonds) and human proteins (circles; drug targets: orange; protein complexes: yellow; proteins in the same biological process: blue). Edge colour proportional to MiST score; edge thickness proportional to spectral counts. Physical interactions among host proteins (thin black lines) were curated from CORUM, IntAct, and Reactome. An interactive protein–protein interaction map can be found at kroganlab.ucsf.edu/network-maps. ECM, extracellular matrix; ER, endoplasmic reticulum; snRNP, small nuclear ribonucleoprotein. n = 3 biologically independent samples.Gordon, D.E., Jang, G.M., Bouhaddou, M. et al. A SARS-CoV-2 protein interaction map reveals targets for drug repurposing. Nature 583, 459–468 (2020). https://doi.org/10.1038/s41586-020-2286-9
Bojkova and co-workers identify relevant proteins by evaluation of protein content and protein translation levels upon coronavirus infection.
Matching with DrTarget results, here we find adhesion proteins (CD47), heat shock proteins (HSP90s), the telomeric repeat-binding factor 2-interacting protein 1 (TERF2IP), Psmb5 protease, a populated set of ribosomal proteins (RPLs & RPSs), ser/thre protein kinases (AKT1, BCR, MAPK14), Sigma receptors, the glucocorticoid receptor (NR3C1), cholesterol metabolism enzymes (ERG7, Ebp), tyrosine kinases ( MET, SRC, EGFR, IGF1R), bromodomain proteins (BRD4) and Ub-transfer enzyme components (ELOB, UBE2V1) among others.
Proteomics of SARS-CoV-2-infected host cells reveals therapy targets
Denisa Bojkova, Kevin Klann, Benjamin Koch, Marek Widera, David Krause, Sandra Ciesek, Jindrich Cinatl & Christian Münch
Nature volume 583, pages469–472(2020)
Abstract
A new coronavirus was recently discovered and named severe acute respiratory syndrome coronavirus 2 (SARS-CoV-2). Infection with SARS-CoV-2 in humans causes coronavirus disease 2019 (COVID-19) and has been rapidly spreading around the globe1,2. SARS-CoV-2 shows some similarities to other coronaviruses; however, treatment options and an understanding of how SARS-CoV-2 infects cells are lacking. Here we identify the host cell pathways that are modulated by SARS-CoV-2 and show that inhibition of these pathways prevents viral replication in human cells. We established a human cell-culture model for infection with a clinical isolate of SARS-CoV-2. Using this cell-culture system, we determined the infection profile of SARS-CoV-2 by translatome3 and proteome proteomics at different times after infection. These analyses revealed that SARS-CoV-2 reshapes central cellular pathways such as translation, splicing, carbon metabolism, protein homeostasis (proteostasis) and nucleic acid metabolism. Small-molecule inhibitors that target these pathways prevented viral replication in cells. Our results reveal the cellular infection profile of SARS-CoV-2 and have enabled the identification of drugs that inhibit viral replication. We anticipate that our results will guide efforts to understand the molecular mechanisms that underlie the modulation of host cells after infection with SARS-CoV-2. Furthermore, our findings provide insights for the development of therapies for the treatment of COVID-19.
Network of proteins that are decreased during SARS-CoV-2 infection
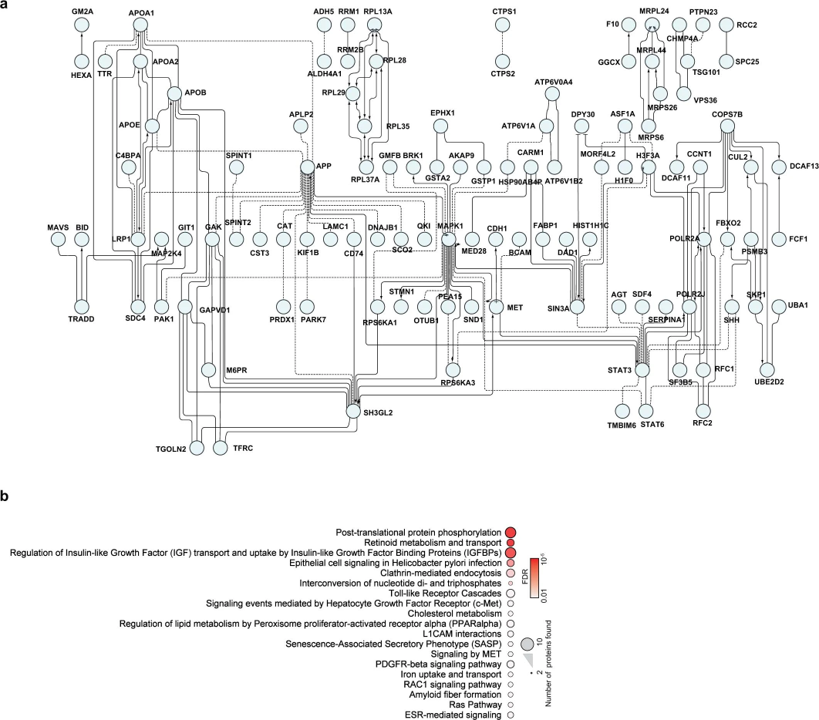
a, Proteins belonging to cluster I in Fig. 3a were used for the creation of a functional interaction network. Lines indicate functional interactions. The network was created using the ReactomeFI plugin in Cytoscape, protein names were added in the plugin and the network adjusted by the yFiles Layout algorithm. b, ReactomeFI network analysis of proteins downregulated in total protein levels. Circle size represents number of proteins found in the pathway, colour shows the FDR for enrichment. Bojkova, D., Klann, K., Koch, B. et al. Proteomics of SARS-CoV-2-infected host cells reveals therapy targets. Nature 583, 469–472 (2020). https://doi.org/10.1038/s41586-020-2332-7.
Network of proteins that are increased during SARS-CoV-2 infection
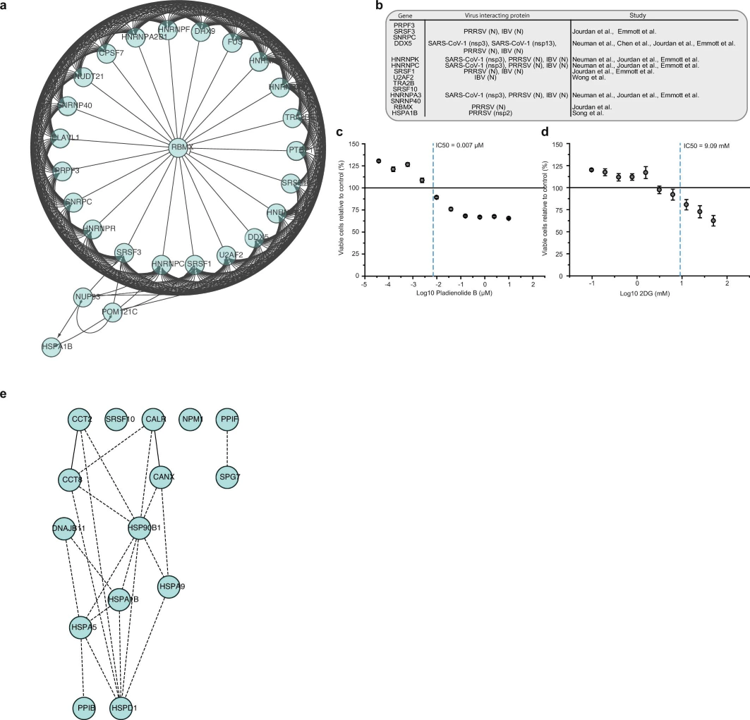
a, Network of proteins increased during SARS-CoV-2 infection with spliceosome annotation in reactome pathway analysis. Lines indicate functional interactions. b, Table summarizing viral proteins (from different coronaviruses) interacting with various spliceosome components13,14,15,16,42,43. c, d, Cytotoxicity assays for different concentrations of pladienolide B (c) and 2-deoxy-D-glucose (d) relative to control. Mean values ± s.d. (n = 3 independent biological samples). Line represents 100% viable cells. e, Protein network showing increased proteins during infection with annotation to the molecular function of ‘unfolded protein binding’. Lines indicate functional interactions.. Bojkova, D., Klann, K., Koch, B. et al. Proteomics of SARS-CoV-2-infected host cells reveals therapy targets. Nature 583, 469–472 (2020). https://doi.org/10.1038/s41586-020-2332-7
Messina and collaborators perform a network analysis based on protein-protein interactions (PPI) and coexpression (COEX), finding interesting matches with drTarget preferred proteins.
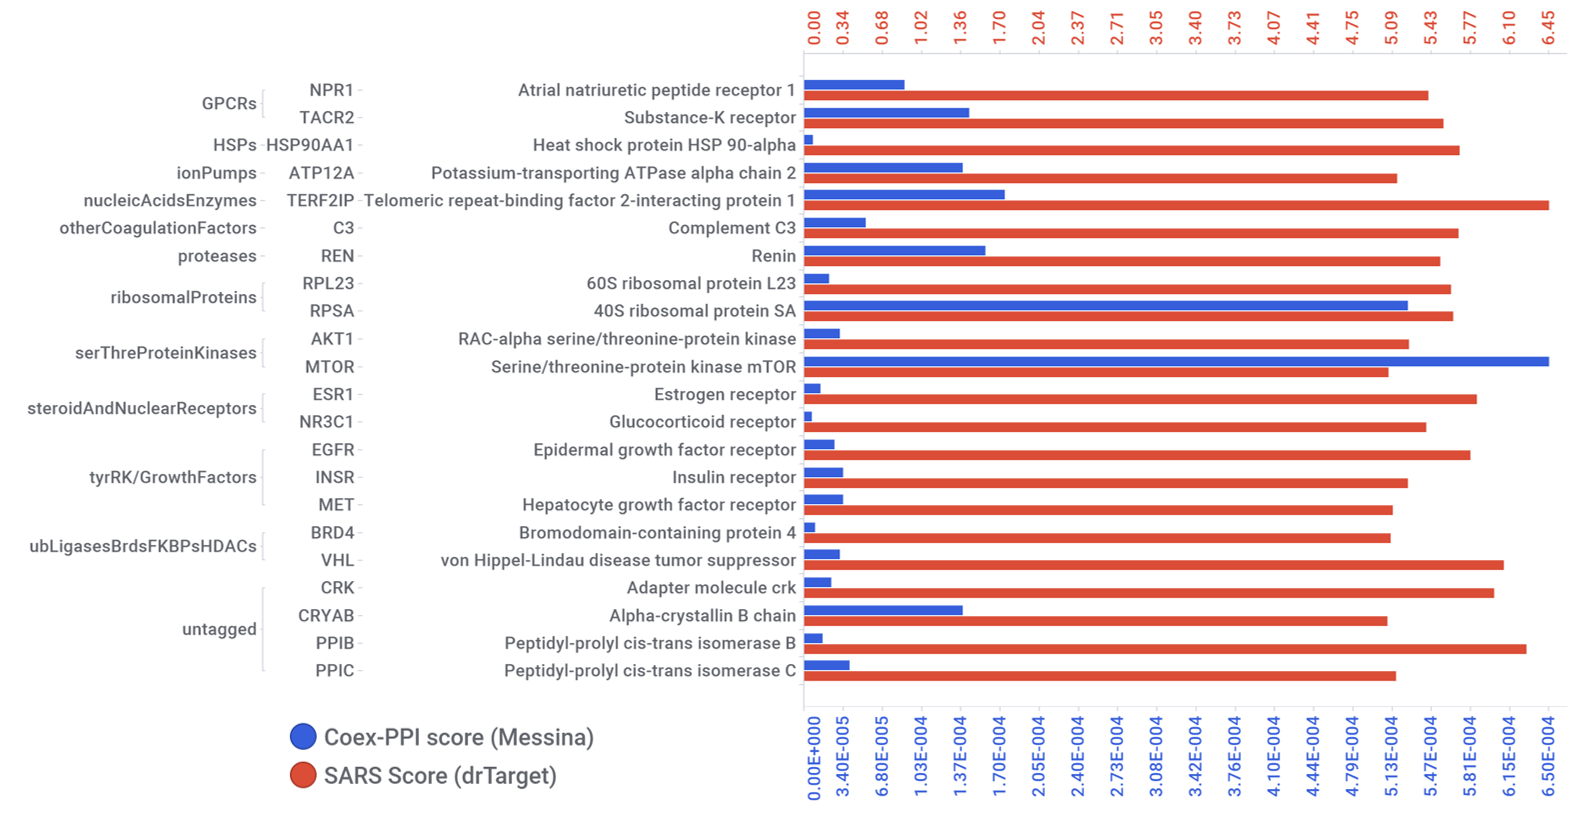
Common proteins identified by machine learning (drTarget) and PPI-COEX analysis.
COVID-19: viral–host interactome analyzed by network based-approach model to study pathogenesis of SARS-CoV-2 infection
Francesco Messina, Emanuela Giombini, Chiara Agrati, Francesco Vairo, Tommaso Ascoli Bartoli, Samir Al Moghazi, Mauro Piacentini, Franco Locatelli, Gary Kobinger, Markus Maeurer, Alimuddin Zumla, Maria R. Capobianchi, Francesco Nicola Lauria, Giuseppe Ippolito & COVID 19 INMI Network Medicine for IDs Study Group
Journal of Translational Medicine volume 18, Article number: 233 (2020) Cite this article
Abstract
Background
Epidemiological, virological and pathogenetic characteristics of SARS-CoV-2 infection are under evaluation. A better understanding of the pathophysiology associated with COVID-19 is crucial to improve treatment modalities and to develop effective prevention strategies. Transcriptomic and proteomic data on the host response against SARS-CoV-2 still have anecdotic character; currently available data from other coronavirus infections are therefore a key source of information.
Methods
We investigated selected molecular aspects of three human coronavirus (HCoV) infections, namely SARS-CoV, MERS-CoV and HCoV-229E, through a network based-approach. A functional analysis of HCoV–host interactome was carried out in order to provide a theoretic host–pathogen interaction model for HCoV infections and in order to translate the results in prediction for SARS-CoV-2 pathogenesis. The 3D model of S-glycoprotein of SARS-CoV-2 was compared to the structure of the corresponding SARS-CoV, HCoV-229E and MERS-CoV S-glycoprotein. SARS-CoV, MERS-CoV, HCoV-229E and the host interactome were inferred through published protein–protein interactions (PPI) as well as gene co-expression, triggered by HCoV S-glycoprotein in host cells.
Results
Although the amino acid sequences of the S-glycoprotein were found to be different between the various HCoV, the structures showed high similarity, but the best 3D structural overlap shared by SARS-CoV and SARS-CoV-2, consistent with the shared ACE2 predicted receptor. The host interactome, linked to the S-glycoprotein of SARS-CoV and MERS-CoV, mainly highlighted innate immunity pathway components, such as Toll Like receptors, cytokines and chemokines.
Conclusions
In this paper, we developed a network-based model with the aim to define molecular aspects of pathogenic phenotypes in HCoV infections. The resulting pattern may facilitate the process of structure-guided pharmaceutical and diagnostic research with the prospect to identify potential new biological targets.
https://translational-medicine.biomedcentral.com/articles/10.1186/s12967-020-02405-w#Fig2
PPI-COEX multilayer analysis, based on human PPI interactome and COEX network, with top 50 closest proteins/genes identified by RWR, using S-glycoprotein of HCoV-229E. Edges in blue represent protein-protein interactions, while red edges are coexpressions
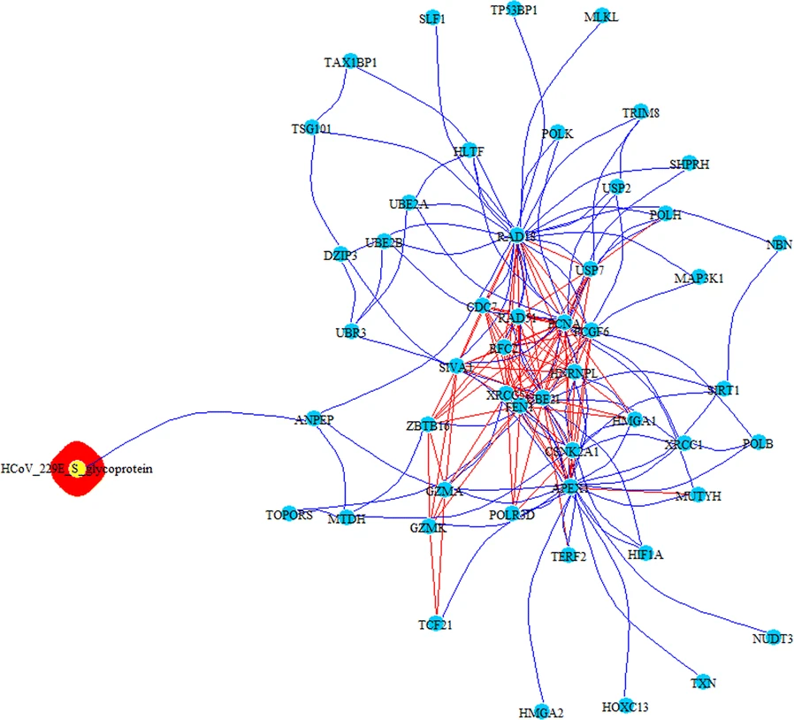
Messina, F., Giombini, E., Agrati, C. et al. COVID-19: viral–host interactome analyzed by network based-approach model to study pathogenesis of SARS-CoV-2 infection. J Transl Med 18, 233 (2020). https://doi.org/10.1186/s12967-020-02405-w
PPI-COEX multilayer analysis, based on human PPI interactome and COEX network, with top 50 closest proteins/genes identified by RWR, using S-glycoprotein of SARS-CoV. Edges in blue represent protein-protein interactions, while red edges are coexpressions
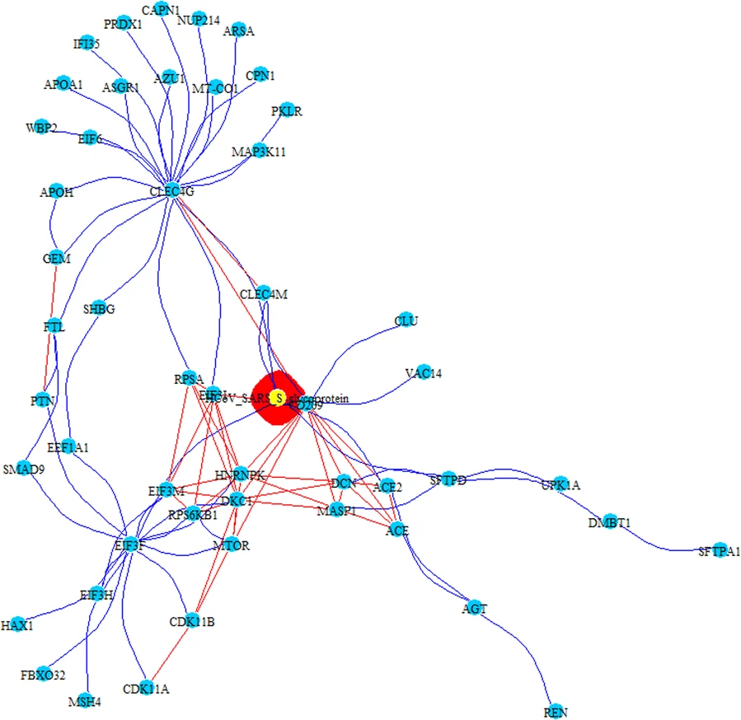
Messina, F., Giombini, E., Agrati, C. et al. COVID-19: viral–host interactome analyzed by network based-approach model to study pathogenesis of SARS-CoV-2 infection. J Transl Med 18, 233 (2020). https://doi.org/10.1186/s12967-020-02405-w
PPI-COEX multilayer analysis, based on human PPI interactome and COEX network, with top 50 closest proteins/genes identified by RWR, using S-glycoprotein of MERS-CoV. Edges in blue represent protein-protein interactions, while red edges are coexpressions
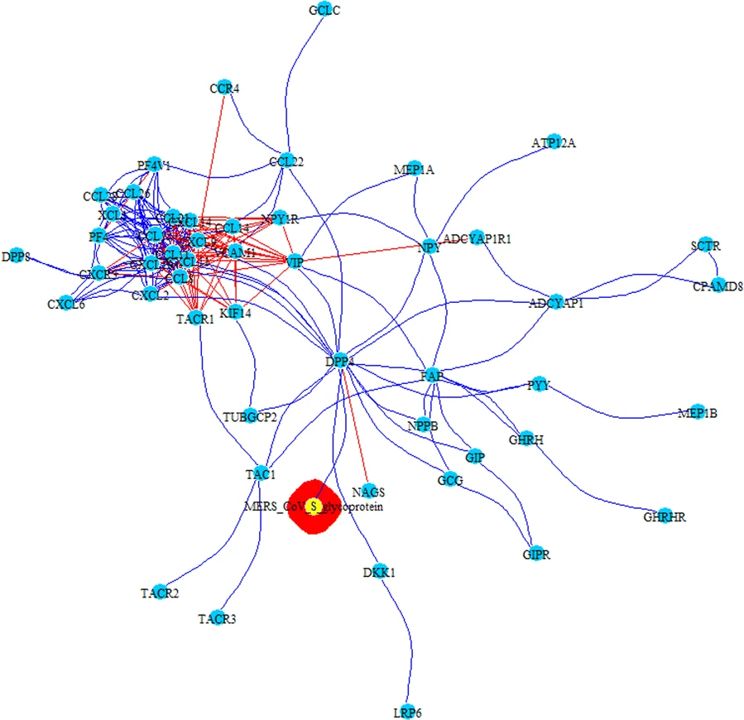
Messina, F., Giombini, E., Agrati, C. et al. COVID-19: viral–host interactome analyzed by network based-approach model to study pathogenesis of SARS-CoV-2 infection. J Transl Med 18, 233 (2020). https://doi.org/10.1186/s12967-020-02405-w