GPCRs interactions with actual or predicted SARS active compounds and pathways they belong to.
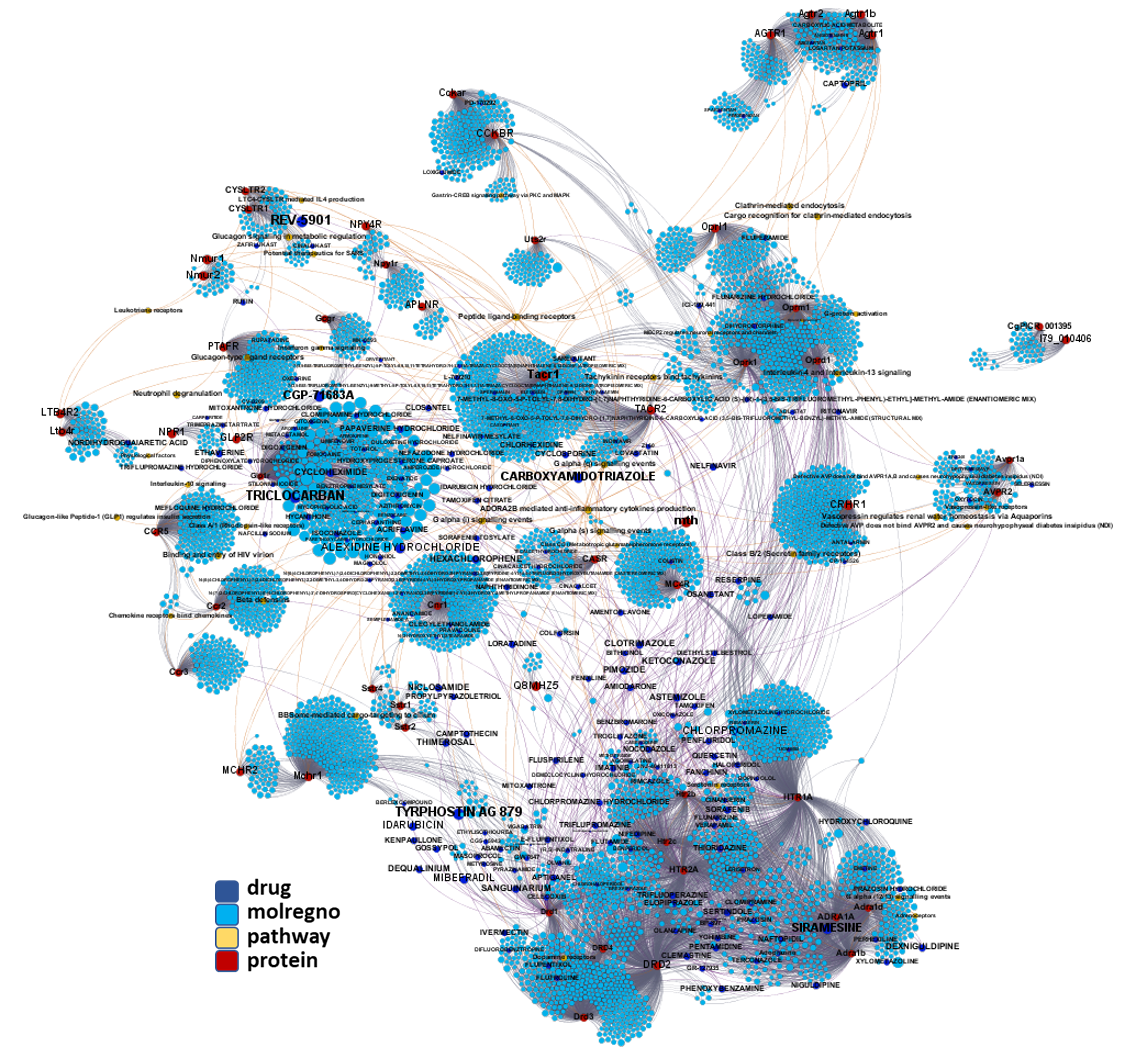
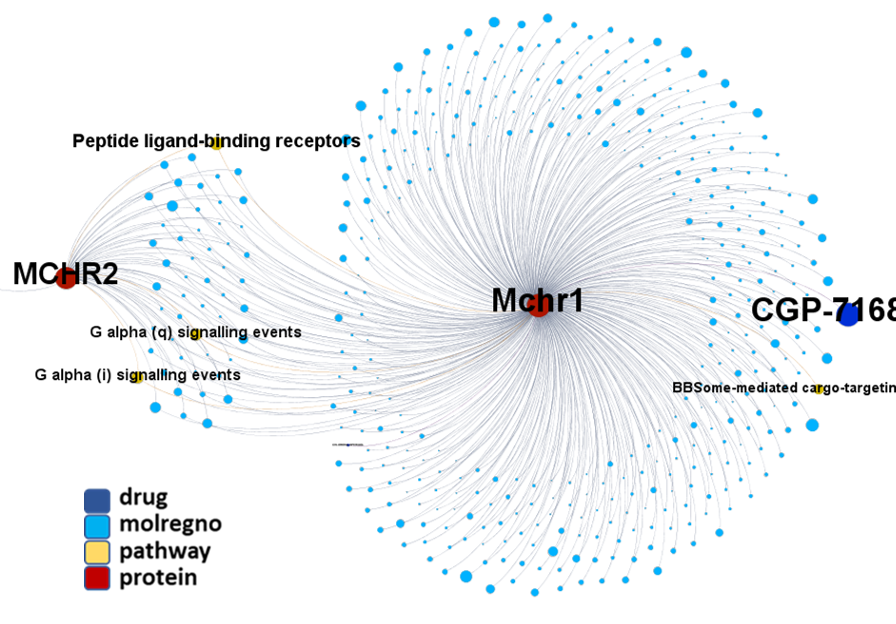
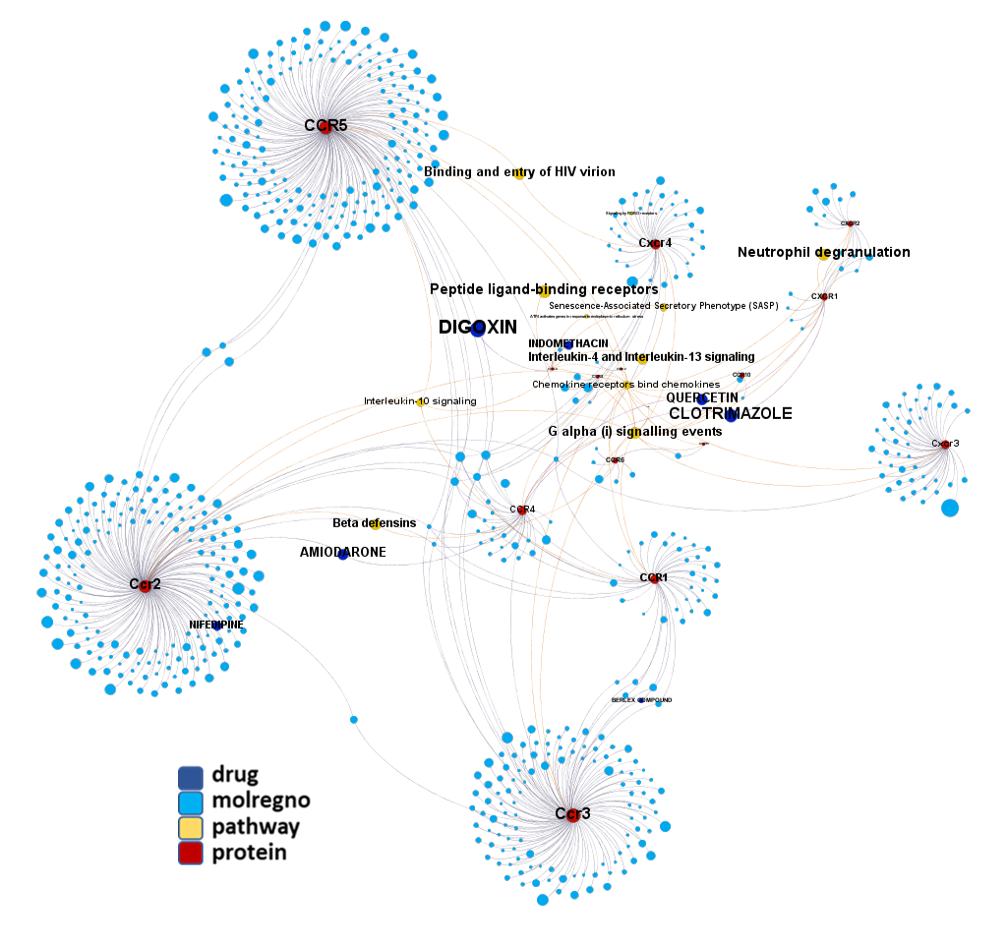
Protein-compounds/pathways interaction graph for G-protein coupled receptors.
See some of the most relevant GPCRs interactions classified by receptor type and interaction closeness.
Click on the network graph to expand view. Click on the blue button to find references supporting target association to antiviral activity.
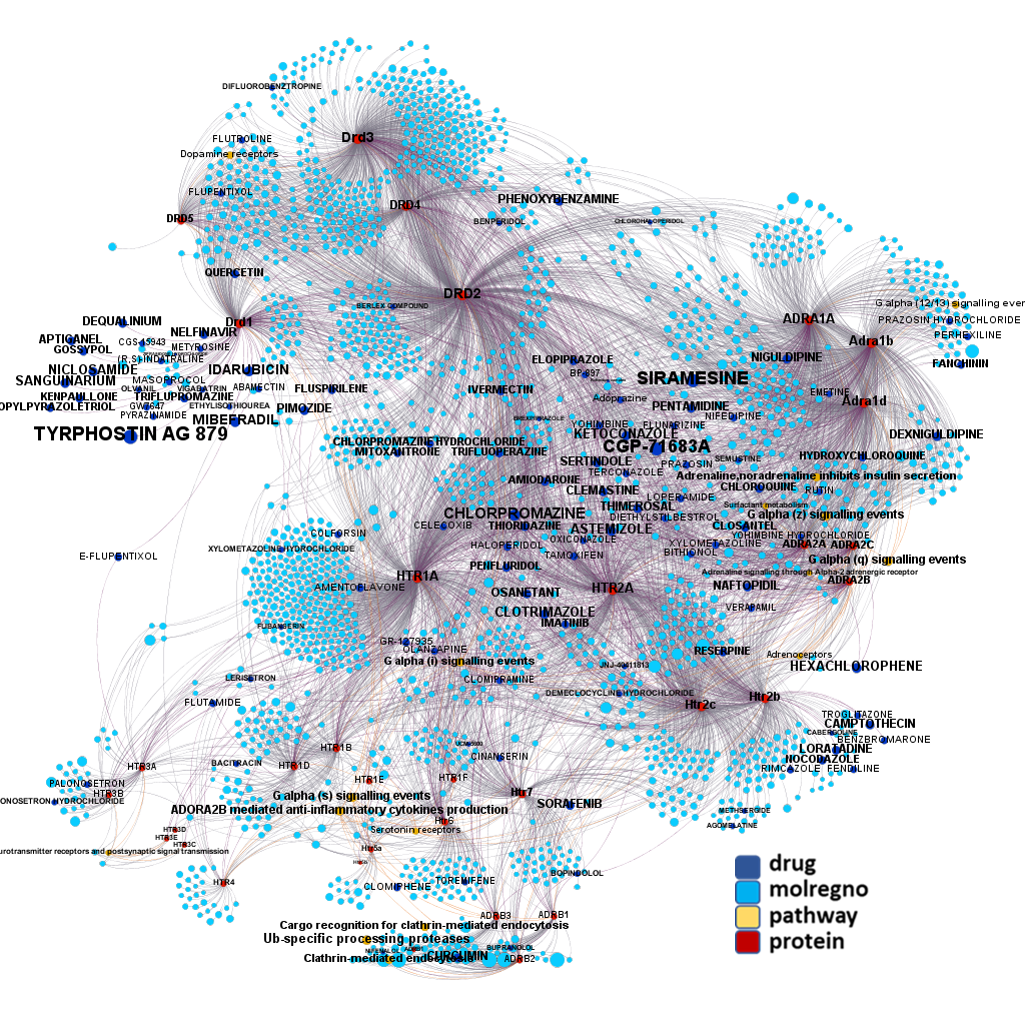
Adrenergic, serotonin and dopamine receptors
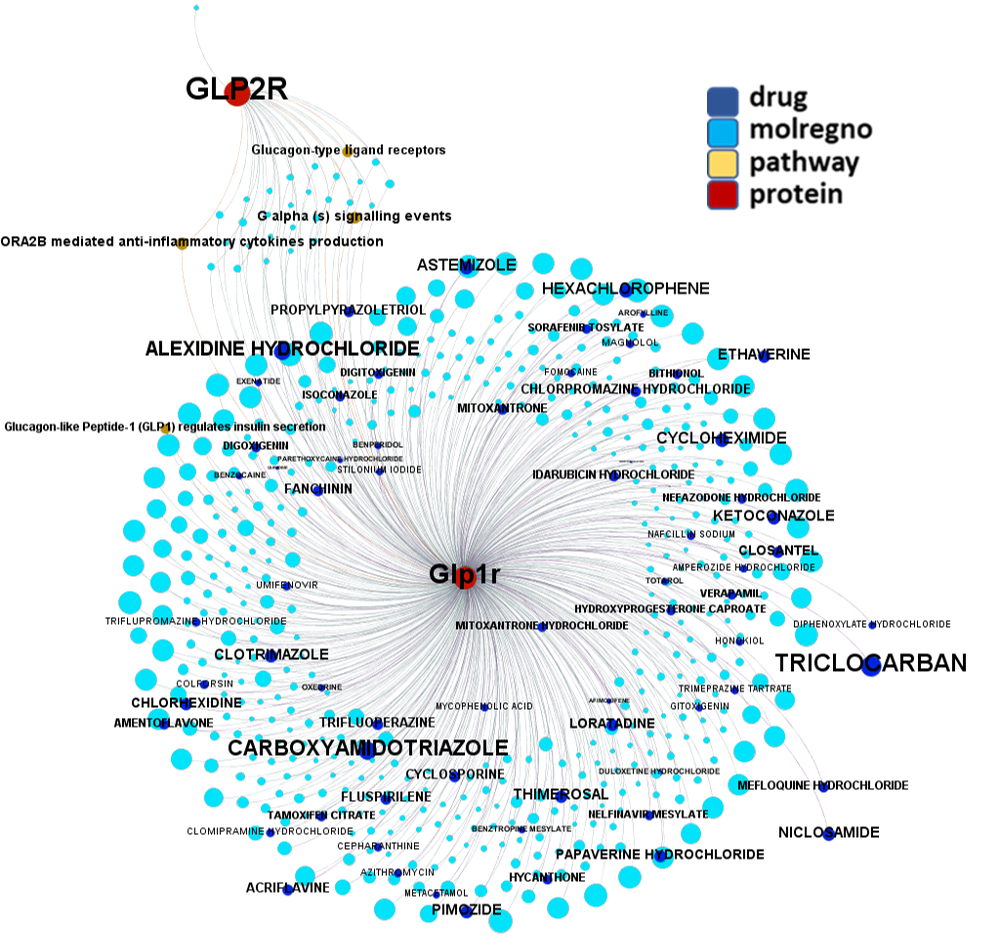
Glucagon-like peptide receptors

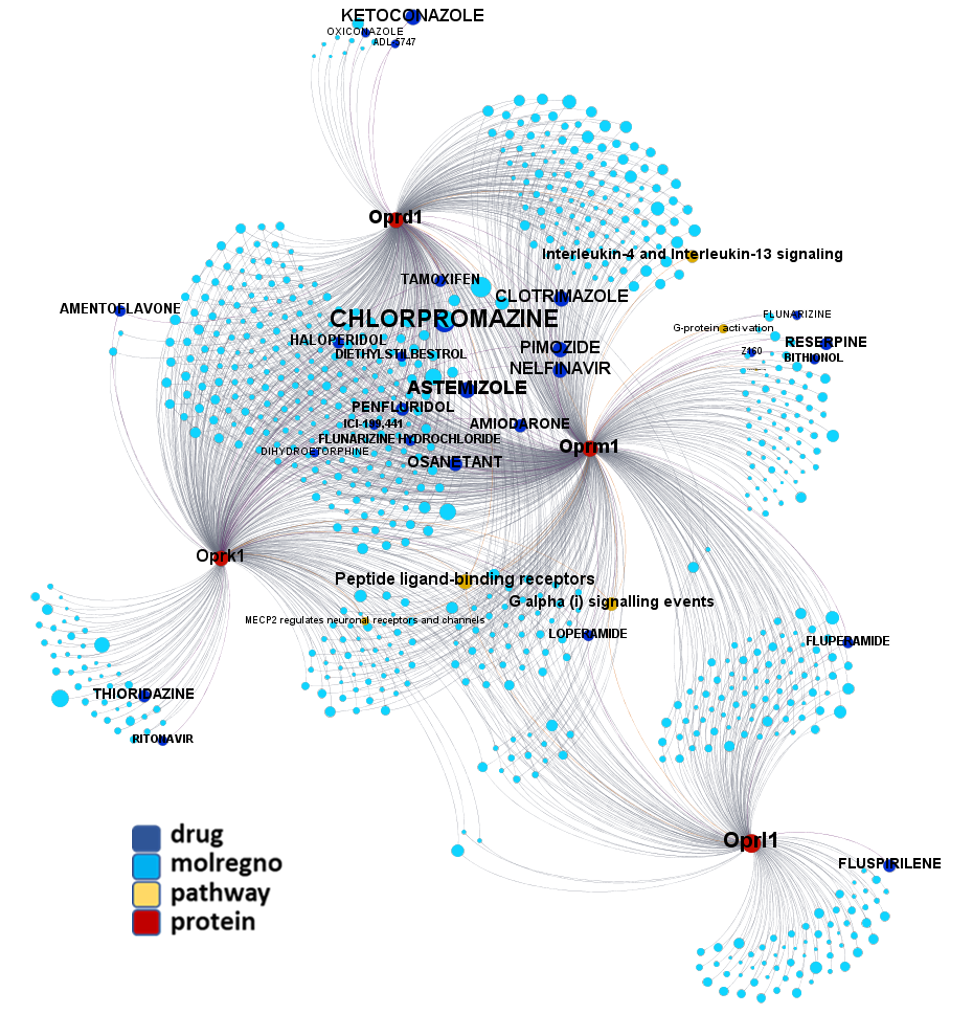
Opioid receptors
Cannabinoid receptors

Angiotensin receptors

Melanin-concentrating hormone receptors
Chemokine receptors
Predicted activities have been aggregated at the protein level into different scores attending to their potency, frequency of protein-molecule interactions, and specificity based on positive records vs total number of active records. Network graphs show all ChEMBL interactions of predicted active molecules. Barcharts and scatter plots show the aggregated potency against SARS-CoV (SARS_Score) vs the number of distinct molecular interactions for each protein (expressed as logged degree). Most interesting proteins attending to any of these values have been flagged in the scatter plots. Additional details as described in respective captions.
And how are these GPCRs ranked by their combination of scores.

Log10(degree): logged number of interactions for each protein. SARS_Score: Aggregated score against coronavirus infection per protein. Size by Degree/CountOfScores represents the number of SARS active interactions vs total records per protein in ChEMBL.
Scatter plot flagging best ranked GPCRs.
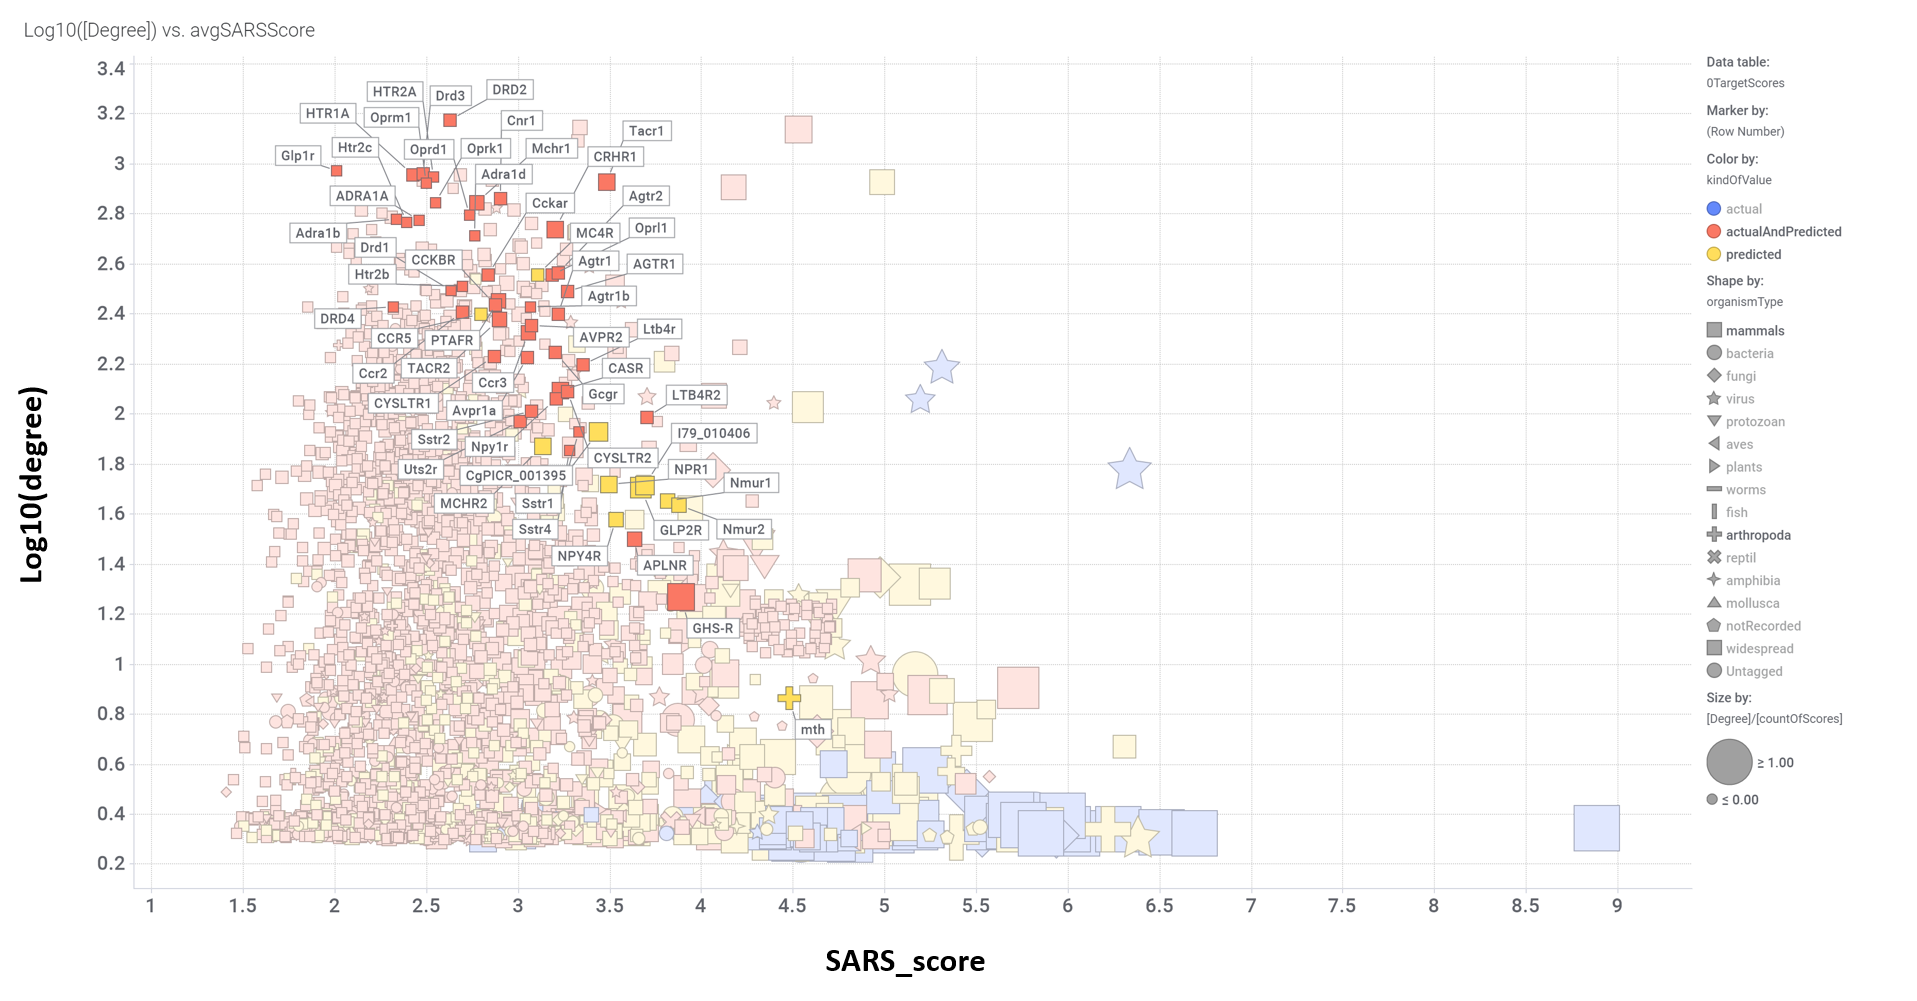
Aggregated SARS scores at the protein level: Log10(degree): logged number of interactions for each protein. SARS_Score: Aggregated score against coronavirus infection per protein. Size by Degree/CountOfScores represents the number of SARS actiove interactions vs total records per protein in ChEMBL. Color by condition of elements involved in score aggregation; they can be built from actual, predicted values or a combination of both. Shape indicates the organism type as described in the legend.