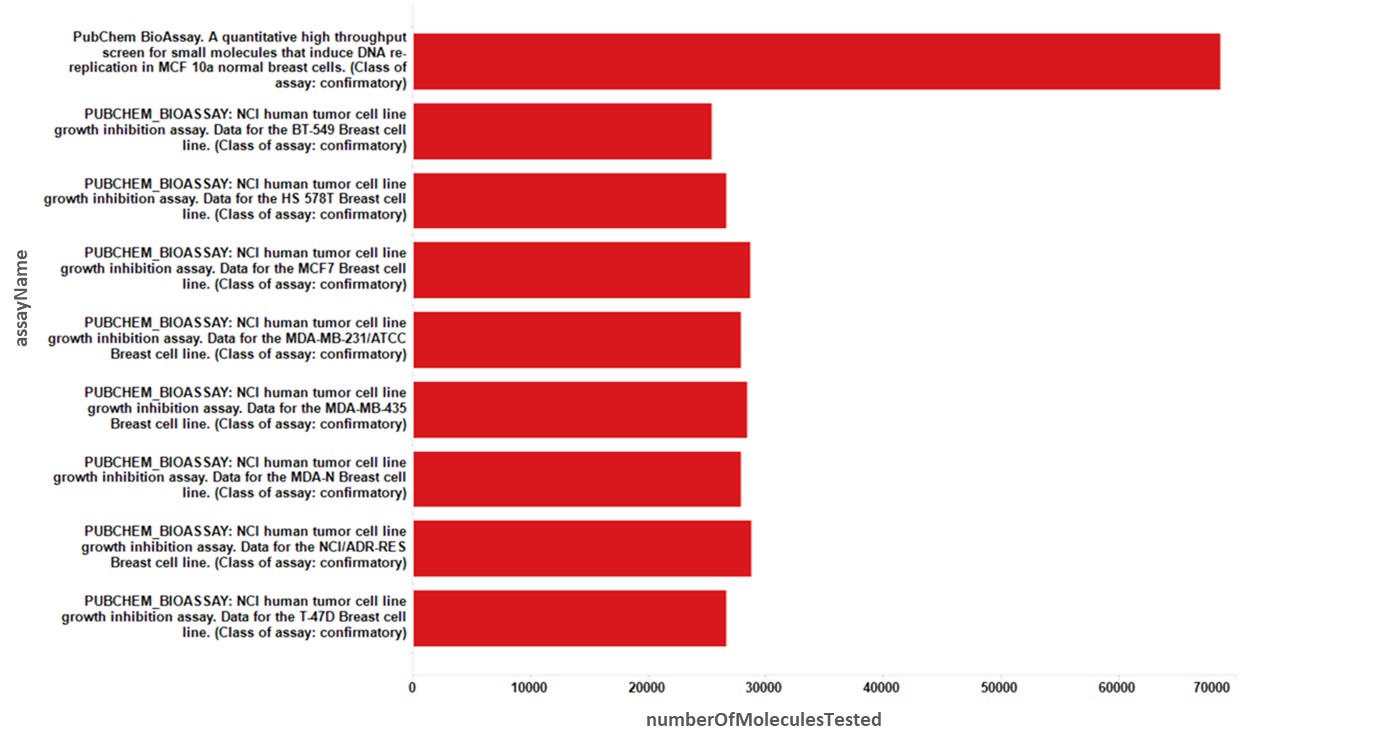
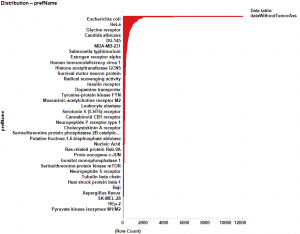
Selected data come from 9 different proliferation assays performed in 9 representative BrCa cell lines as depicted in figure below
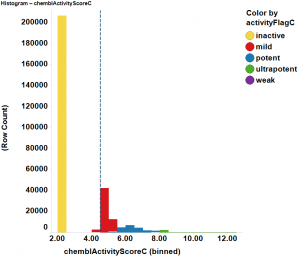
This is the activity distribution profile in all breast cancer assays of all events recorded in the database. These are more than 200k records from approximately 28k unique compounds
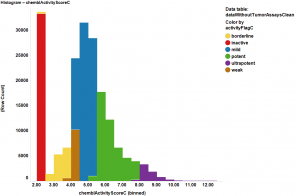
These 28k compounds have more than 180k additional records in more than 2k targets and cells not performed in any cancer model experiment. This will be our substrate for ML prediction models.
The activity distribution of our 28k molecules on non-cancer experiments shows a higher proportion of inactives than for BrCa assays described above.
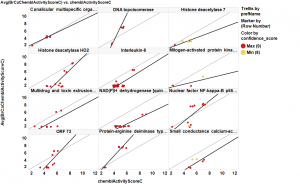
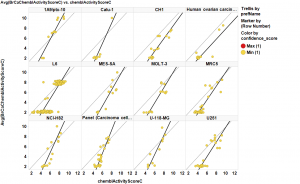
Finally, we check the correlations between potencies of the compounds at the BrCa experiments compared to the value at different molecular (1st plot) or cellular (2nd plot) targets. Both plots show the best correlations identified. Data start to suggest that there will be some targets that may be related to anti tumor activity.