The application of the RF regression model to the whole ML table (13M items) results in a prediction of activity for each row in the table. For compound selection, it is convenient to pivot the data frame by compound, calculating the average value of all predictions for each compound so the count of items that contribute to the average value.
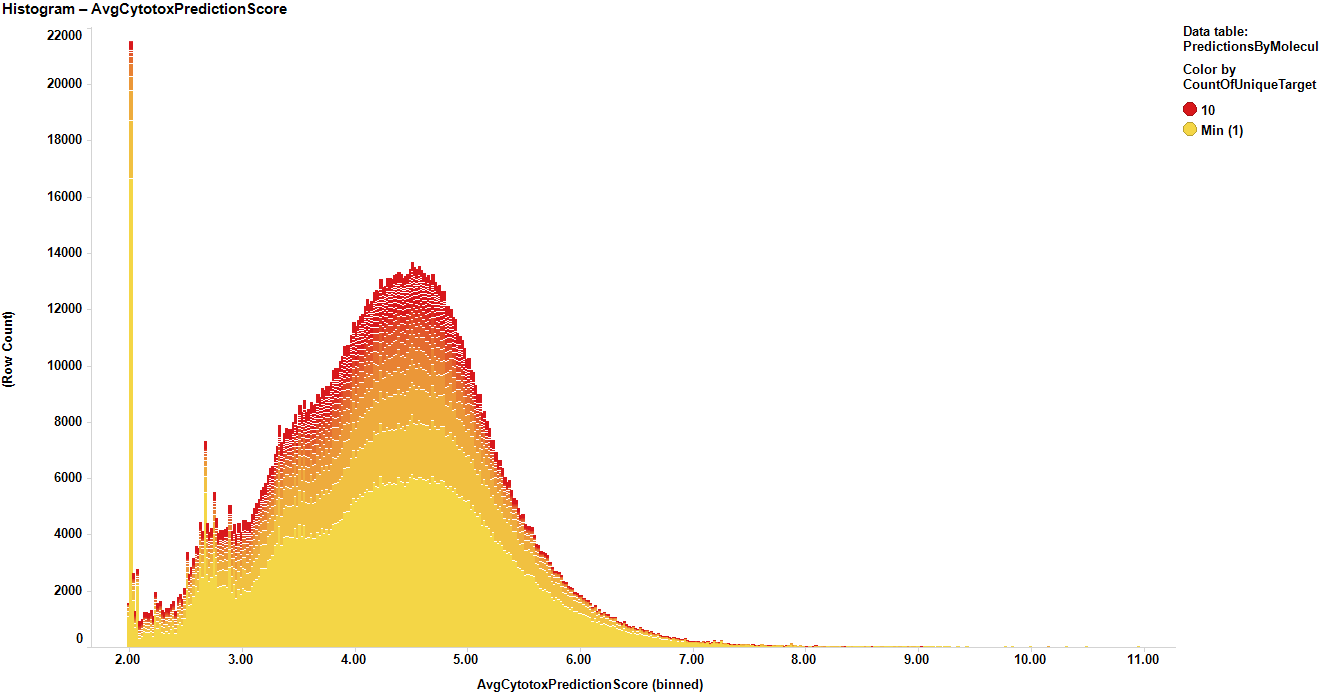
The figure below shows the predictedScores distribution histogram for the 13M. It is interesting to see that the center of the histogram is in between the 4 to 5 scores, indicating a strong trend, or at least, weak activity among the chembl compounds for the cytotox or growth assays.
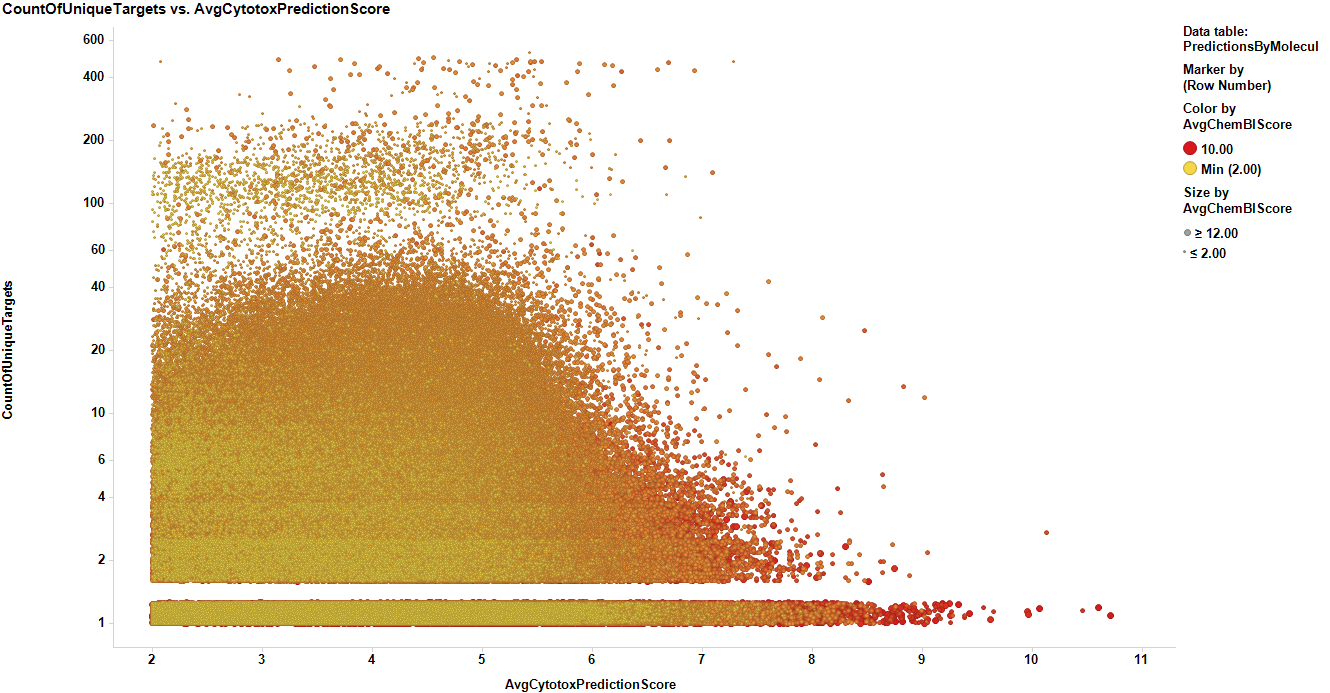
The figure below plots the average prediction of toxicity for each molecule vs the number of events in the ChEMBL database. It is used as a source of data to match with other studies, and for selection of cytotoxic compounds based on its potency and the number of elements contributing to the value as a confidence index.