Repurposing Drugs for Spinal Muscular Atrophy
Spinal muscular atrophy (SMA) is caused by insufficient levels of the survival motor neuron protein SMN. The SMN locus on chromosome 5q13 contains two inverted copies of SMN called SMN1 and SMN2 which are 99% identical at the amino acid level. SMN1is a fully functional protein and SMN2 skips axon 7 90% of the time. Skipping of exon 7 produces non-functional protein product. 10% of the SMN2 protein includes exon 7 and is fully functional. In the SMA disease state, mutations in the SMN1 locus are the cause of the disease state. Because only 10% of SMN2 is of the fully functional form, it is not sufficient to overcome the deficiency produced by the loss of the SMN1 product. A therapy that either increase the amount of SMN2 product made or to increase the inclusion of exon 7 has been proposed for the treatment of SMA.
For this reason, strategies that enhance SMN2 splice variant expression that yields active SMN protein have been considered of therapeutic interest. In this section we will use the SMN2 enhancing experiments stored in the ChEMBL DB to validate a predictive model that allows prediction of SMN2 enhancing activity for the 1.5M unique molecules with 13M activity records in te DB focusing on molecules that are actually prescription drugs.
About 3k among the 1.5M annotated molecules are prescription drugs. For some of them, there is a record of activity on SMN2 expression experiments, but for the most that don’t have any, there is a predicted score. The variable ActualPluspredictedSMN2Score contains the actual score if it exists, but the predicted one if it doesn’t. These scores have a -log(molar potency) scale.
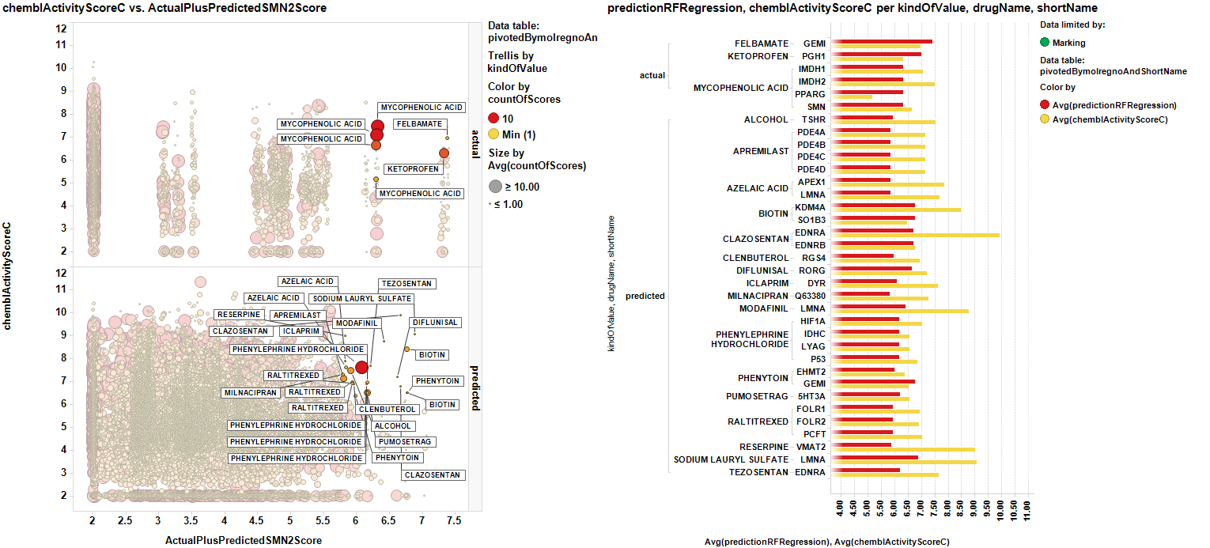
Applying the dashboard based selection methods described in the prediction of SMN2 activity section upon prescription drugs we have created unique drug target pairs with average scores per pair: the already described ActualPluspredictedSMN2Score and the chemblActivityScoreC which shows the effect that the molecule average score for each particular target.
The graph below shows ActualPluspredictedSMN2Score vs chemblActivityScoreC . Marked dots are displayed on the right side showing the targets where the drugs have an activity record and the value, in bars of their potency at target compared to the potency enhancing SMN2 expression.
It could be interesting checking what they do in animal models…
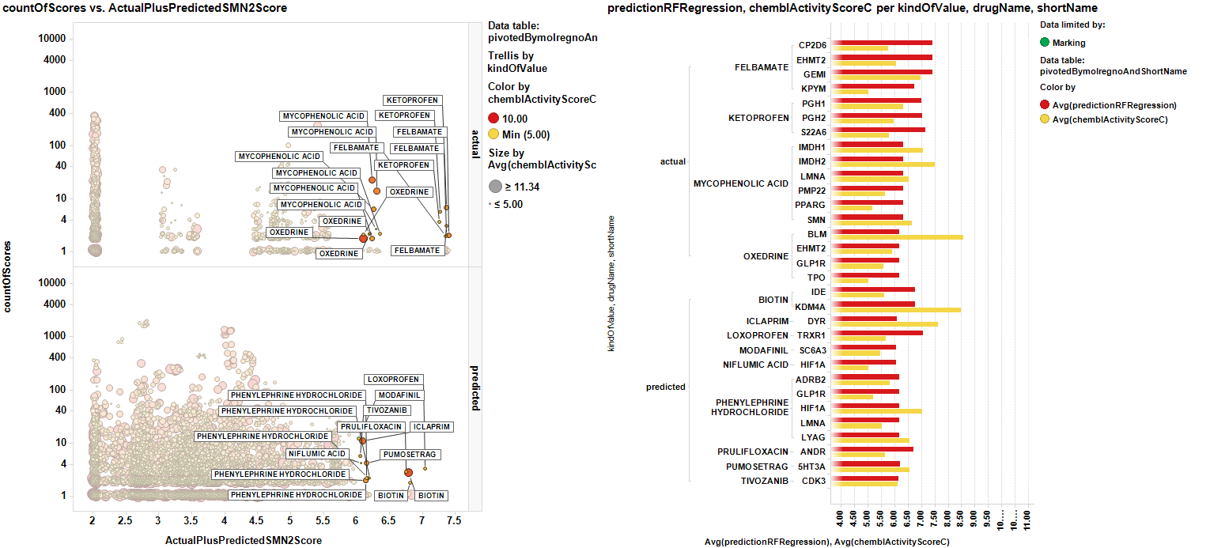
A different view showing the number of records instead of target chemblActivityScoreC for chemblActivityScoreC >5. Here we can estimate the confidence by the number of repeats…
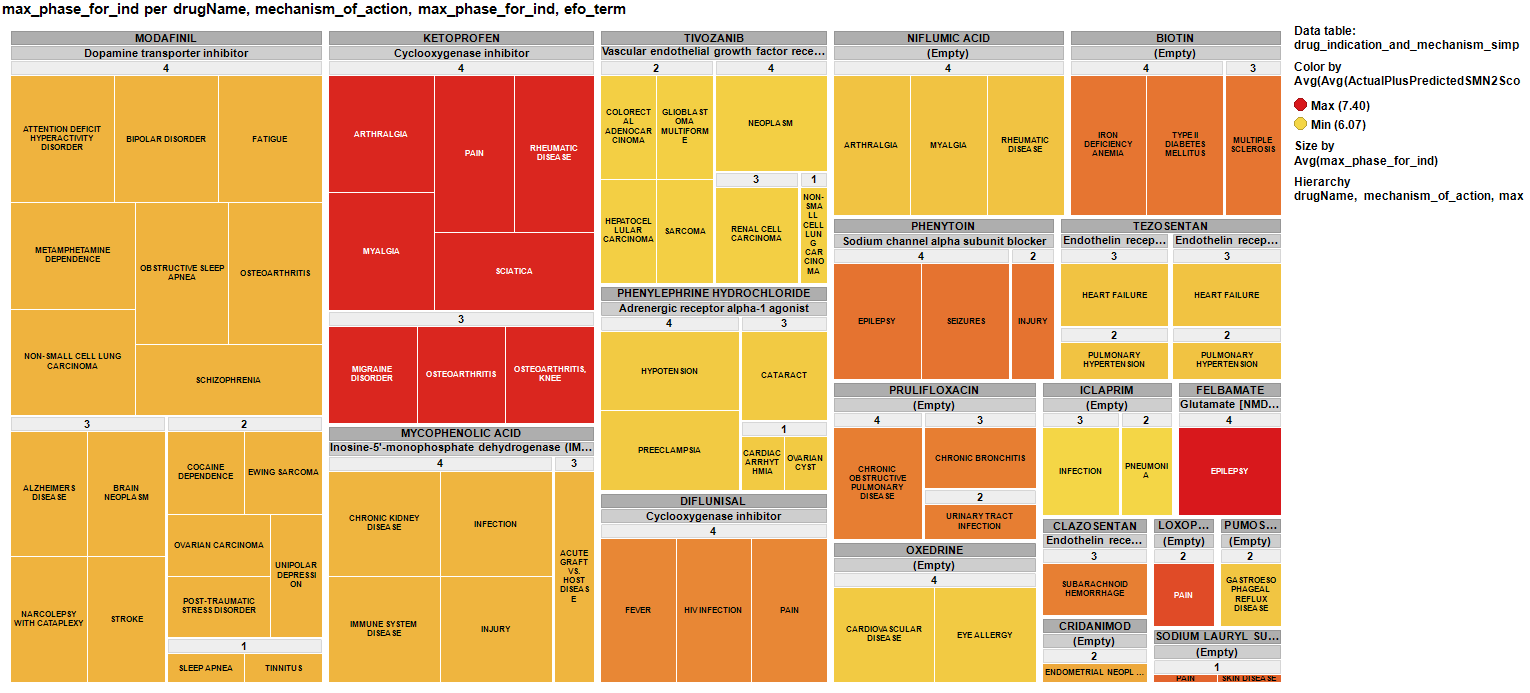
And finally a treemap of the repurposed drugs for SMA showing the clinical phase achieved, current indications, published MoAs and colored by their potency enhancing SMN2 expression.
Below, the table with the results.
smn2RepurposingTable
| drugName | shortName | Gene names | chemblActivityScoreC | smn2Score | predictionRFRegression | countOfScores | drugIndications | MoAs | concatenatedActionType | maxPhase | ActualPlusPredictedSMN2Score | kindOfValue |
|---|---|---|---|---|---|---|---|---|---|---|---|---|
| PHENYTOIN | GEMI | GMNN | 6.5000381344038 | 6.761727503252 | 1 | EPILEPSY, INJURY, SEIZURES | Sodium channel alpha subunit blocker | BLOCKER | 4 | 6.761727503252 | predicted | |
| PHENYTOIN | FEN1 | FEN1 RAD2 | 6.1999706407559 | 6.761727503252 | 1 | EPILEPSY, INJURY, SEIZURES | Sodium channel alpha subunit blocker | BLOCKER | 4 | 6.761727503252 | predicted | |
| KETOPROFEN | PGH2 | PTGS2 COX2 | 5.945267294491 | 7.3 | 7.0229166666667 | 6 | ARTHRALGIA, MIGRAINE DISORDER, MYALGIA, OSTEOARTHRITIS, OSTEOARTHRITIS, KNEE, PAIN, RHEUMATIC DISEASE, SCIATICA | Cyclooxygenase inhibitor | INHIBITOR | 4 | 7.3 | actual |
| KETOPROFEN | S22A6 | SLC22A6 OAT1 PAHT, Slc22a6 Oat1 | 5.7747888350846 | 7.3 | 7.121875 | 4 | ARTHRALGIA, MIGRAINE DISORDER, MYALGIA, OSTEOARTHRITIS, OSTEOARTHRITIS, KNEE, PAIN, RHEUMATIC DISEASE, SCIATICA | Cyclooxygenase inhibitor | INHIBITOR | 4 | 7.3 | actual |
| KETOPROFEN | AMPC | ampC ampA b4150 JW4111 | 5.45 | 7.3 | 5.875 | 1 | ARTHRALGIA, MIGRAINE DISORDER, MYALGIA, OSTEOARTHRITIS, OSTEOARTHRITIS, KNEE, PAIN, RHEUMATIC DISEASE, SCIATICA | Cyclooxygenase inhibitor | INHIBITOR | 4 | 7.3 | actual |
| KETOPROFEN | PGH1 | PTGS1 COX1 | 6.3140301588799 | 7.3 | 6.9715097402597 | 7 | ARTHRALGIA, MIGRAINE DISORDER, MYALGIA, OSTEOARTHRITIS, OSTEOARTHRITIS, KNEE, PAIN, RHEUMATIC DISEASE, SCIATICA | Cyclooxygenase inhibitor | INHIBITOR | 4 | 7.3 | actual |
| KETOPROFEN | EHMT2 | EHMT2 BAT8 C6orf30 G9A KMT1C NG36 | 7.6497519816658 | 7.3 | 5.875 | 1 | ARTHRALGIA, MIGRAINE DISORDER, MYALGIA, OSTEOARTHRITIS, OSTEOARTHRITIS, KNEE, PAIN, RHEUMATIC DISEASE, SCIATICA | Cyclooxygenase inhibitor | INHIBITOR | 4 | 7.3 | actual |
| KETOPROFEN | S22A7 | Slc22a7 Nlt Oat2 | 5.74 | 7.3 | 6.5083333333333 | 1 | ARTHRALGIA, MIGRAINE DISORDER, MYALGIA, OSTEOARTHRITIS, OSTEOARTHRITIS, KNEE, PAIN, RHEUMATIC DISEASE, SCIATICA | Cyclooxygenase inhibitor | INHIBITOR | 4 | 7.3 | actual |
| KETOPROFEN | TAU | MAPT MAPTL MTBT1 TAU | 5.4 | 7.3 | 6.2075 | 1 | ARTHRALGIA, MIGRAINE DISORDER, MYALGIA, OSTEOARTHRITIS, OSTEOARTHRITIS, KNEE, PAIN, RHEUMATIC DISEASE, SCIATICA | Cyclooxygenase inhibitor | INHIBITOR | 4 | 7.3 | actual |
| KETOPROFEN | SMN | SMN1 SMN SMNT; SMN2 SMNC | 7.3 | 7.3 | 5.875 | 1 | ARTHRALGIA, MIGRAINE DISORDER, MYALGIA, OSTEOARTHRITIS, OSTEOARTHRITIS, KNEE, PAIN, RHEUMATIC DISEASE, SCIATICA | Cyclooxygenase inhibitor | INHIBITOR | 4 | 7.3 | actual |
| KETOPROFEN | S22AB | SLC22A11 OAT4 | 5.6297314179258 | 7.3 | 7.3 | 1 | ARTHRALGIA, MIGRAINE DISORDER, MYALGIA, OSTEOARTHRITIS, OSTEOARTHRITIS, KNEE, PAIN, RHEUMATIC DISEASE, SCIATICA | Cyclooxygenase inhibitor | INHIBITOR | 4 | 7.3 | actual |
| KETOPROFEN | PFKA | pfk | 5.070984900376 | 7.3 | 7.3 | 1 | ARTHRALGIA, MIGRAINE DISORDER, MYALGIA, OSTEOARTHRITIS, OSTEOARTHRITIS, KNEE, PAIN, RHEUMATIC DISEASE, SCIATICA | Cyclooxygenase inhibitor | INHIBITOR | 4 | 7.3 | actual |
| KETOPROFEN | GEMI | GMNN | 6.5362562787529 | 7.3 | 6.5083333333333 | 1 | ARTHRALGIA, MIGRAINE DISORDER, MYALGIA, OSTEOARTHRITIS, OSTEOARTHRITIS, KNEE, PAIN, RHEUMATIC DISEASE, SCIATICA | Cyclooxygenase inhibitor | INHIBITOR | 4 | 7.3 | actual |
| KETOPROFEN | LMNA | LMNA LMN1 | 6.5 | 7.3 | 5.7958333333333 | 1 | ARTHRALGIA, MIGRAINE DISORDER, MYALGIA, OSTEOARTHRITIS, OSTEOARTHRITIS, KNEE, PAIN, RHEUMATIC DISEASE, SCIATICA | Cyclooxygenase inhibitor | INHIBITOR | 4 | 7.3 | actual |
| KETOPROFEN | FEN1 | FEN1 RAD2 | 5.2238220274178 | 7.3 | 7.2208333333333 | 1 | ARTHRALGIA, MIGRAINE DISORDER, MYALGIA, OSTEOARTHRITIS, OSTEOARTHRITIS, KNEE, PAIN, RHEUMATIC DISEASE, SCIATICA | Cyclooxygenase inhibitor | INHIBITOR | 4 | 7.3 | actual |
| LOXOPROFEN | PFKA | pfk | 6.1209614947628 | 7.0425 | 1 | PAIN | 3 | 7.0425 | predicted | |||
| LOXOPROFEN | TRXR1 | Txnrd1 Trxr1 | 5.6658932627271 | 7.0425 | 3 | PAIN | 3 | 7.0425 | predicted | |||
| LOXOPROFEN | HSPB1 | HSPB1 HSP27 HSP28 | 5.8250974378217 | 7.0425 | 1 | PAIN | 3 | 7.0425 | predicted | |||
| SODIUM LAURYL SULFATE | LMNA | LMNA LMN1 | 9.0457574905607 | 6.8675 | 1 | PAIN, SKIN DISEASE | 1 | 6.8675 | predicted | |||
| OXEDRINE | RORG | RORC NR1F3 RORG RZRG | 5.5750693855501 | 6.15 | 6.15 | 1 | CARDIOVASCULAR DISEASE, EYE ALLERGY | 0 | 6.15 | actual | ||
| OXEDRINE | PPARD | PPARD NR1C2 PPARB | 5.9607048819157 | 6.15 | 6.15 | 1 | CARDIOVASCULAR DISEASE, EYE ALLERGY | 0 | 6.15 | actual | ||
| OXEDRINE | TPO | THPO MGDF | 5 | 6.15 | 6.15 | 2 | CARDIOVASCULAR DISEASE, EYE ALLERGY | 0 | 6.15 | actual | ||
| OXEDRINE | GLP1R | GLP1R | 5.5749959424427 | 6.15 | 6.15 | 2 | CARDIOVASCULAR DISEASE, EYE ALLERGY | 0 | 6.15 | actual | ||
| OXEDRINE | ACM1 | Chrm1 Chrm-1 | 5.85 | 6.15 | 6.15 | 1 | CARDIOVASCULAR DISEASE, EYE ALLERGY | 0 | 6.15 | actual | ||
| OXEDRINE | EHMT2 | EHMT2 BAT8 C6orf30 G9A KMT1C NG36 | 5.8998759246974 | 6.15 | 6.15 | 2 | CARDIOVASCULAR DISEASE, EYE ALLERGY | 0 | 6.15 | actual | ||
| OXEDRINE | SMN | SMN1 SMN SMNT; SMN2 SMNC | 6.15 | 6.15 | 6.15 | 1 | CARDIOVASCULAR DISEASE, EYE ALLERGY | 0 | 6.15 | actual | ||
| OXEDRINE | BLM | BLM RECQ2 RECQL3 | 8.55 | 6.15 | 6.15 | 2 | CARDIOVASCULAR DISEASE, EYE ALLERGY | 0 | 6.15 | actual | ||
| OXEDRINE | NMUR2 | NMUR2 NMU2R TGR1 | 5.18 | 6.15 | 6.15 | 1 | CARDIOVASCULAR DISEASE, EYE ALLERGY | 0 | 6.15 | actual | ||
| BIOTIN | KDM4A | KDM4A JHDM3A JMJD2 JMJD2A KIAA0677 | 8.4559319556497 | 6.7475 | 3 | IRON DEFICIENCY ANEMIA, MULTIPLE SCLEROSIS, TYPE II DIABETES MELLITUS | 4 | 6.7475 | predicted | |||
| BIOTIN | IDE | IDE | 5.61 | 6.7475 | 2 | IRON DEFICIENCY ANEMIA, MULTIPLE SCLEROSIS, TYPE II DIABETES MELLITUS | 4 | 6.7475 | predicted | |||
| BIOTIN | SAV | 5 | 6.7475 | 1 | IRON DEFICIENCY ANEMIA, MULTIPLE SCLEROSIS, TYPE II DIABETES MELLITUS | 4 | 6.7475 | predicted | ||||
| BIOTIN | SO1B1 | SLCO1B1 LST1 OATP1B1 OATP2 OATPC SLC21A6 | 6.1270946769521 | 6.7475 | 1 | IRON DEFICIENCY ANEMIA, MULTIPLE SCLEROSIS, TYPE II DIABETES MELLITUS | 4 | 6.7475 | predicted | |||
| BIOTIN | SO1B3 | SLCO1B3 LST2 OATP1B3 OATP8 SLC21A8 | 6.4674860391492 | 6.7475 | 1 | IRON DEFICIENCY ANEMIA, MULTIPLE SCLEROSIS, TYPE II DIABETES MELLITUS | 4 | 6.7475 | predicted | |||
| MYCOPHENOLIC ACID | PPARG | PPARG NR1C3 | 5.1514194572534 | 6.3 | 6.3 | 3 | ACUTE GRAFT VS. HOST DISEASE, CHRONIC KIDNEY DISEASE, IMMUNE SYSTEM DISEASE, INFECTION, INJURY | Inosine-5'-monophosphate dehydrogenase (IMPDH) inhibitor | INHIBITOR | 4 | 6.3 | actual |
| MYCOPHENOLIC ACID | IMDH1 | IMPDH1 IMPD1 | 7.0469230769231 | 6.3 | 6.3 | 13 | ACUTE GRAFT VS. HOST DISEASE, CHRONIC KIDNEY DISEASE, IMMUNE SYSTEM DISEASE, INFECTION, INJURY | Inosine-5'-monophosphate dehydrogenase (IMPDH) inhibitor | INHIBITOR | 4 | 6.3 | actual |
| MYCOPHENOLIC ACID | SMN | SMN1 SMN SMNT; SMN2 SMNC | 6.6214285714286 | 6.3 | 6.3 | 7 | ACUTE GRAFT VS. HOST DISEASE, CHRONIC KIDNEY DISEASE, IMMUNE SYSTEM DISEASE, INFECTION, INJURY | Inosine-5'-monophosphate dehydrogenase (IMPDH) inhibitor | INHIBITOR | 4 | 6.3 | actual |
| MYCOPHENOLIC ACID | IMDH2 | IMPDH2 IMPD2 | 7.4783333333333 | 6.3 | 6.3 | 24 | ACUTE GRAFT VS. HOST DISEASE, CHRONIC KIDNEY DISEASE, IMMUNE SYSTEM DISEASE, INFECTION, INJURY | Inosine-5'-monophosphate dehydrogenase (IMPDH) inhibitor | INHIBITOR | 4 | 6.3 | actual |
| MYCOPHENOLIC ACID | LEF | lef pXO1-107 BXA0172 GBAA_pXO1_0172 | 5.9 | 6.3 | 6.3 | 1 | ACUTE GRAFT VS. HOST DISEASE, CHRONIC KIDNEY DISEASE, IMMUNE SYSTEM DISEASE, INFECTION, INJURY | Inosine-5'-monophosphate dehydrogenase (IMPDH) inhibitor | INHIBITOR | 4 | 6.3 | actual |
| MYCOPHENOLIC ACID | GEMI | GMNN | 6.4361630813355 | 6.3 | 6.3 | 1 | ACUTE GRAFT VS. HOST DISEASE, CHRONIC KIDNEY DISEASE, IMMUNE SYSTEM DISEASE, INFECTION, INJURY | Inosine-5'-monophosphate dehydrogenase (IMPDH) inhibitor | INHIBITOR | 4 | 6.3 | actual |
| MYCOPHENOLIC ACID | NF2L2 | NFE2L2 NRF2 | 5.6362188474191 | 6.3 | 6.3 | 1 | ACUTE GRAFT VS. HOST DISEASE, CHRONIC KIDNEY DISEASE, IMMUNE SYSTEM DISEASE, INFECTION, INJURY | Inosine-5'-monophosphate dehydrogenase (IMPDH) inhibitor | INHIBITOR | 4 | 6.3 | actual |
| MYCOPHENOLIC ACID | PMP22 | Pmp22 Cd25 Pmp-22 | 5.6161115480421 | 6.3 | 6.3 | 2 | ACUTE GRAFT VS. HOST DISEASE, CHRONIC KIDNEY DISEASE, IMMUNE SYSTEM DISEASE, INFECTION, INJURY | Inosine-5'-monophosphate dehydrogenase (IMPDH) inhibitor | INHIBITOR | 4 | 6.3 | actual |
| MYCOPHENOLIC ACID | LMNA | LMNA LMN1 | 6.525 | 6.3 | 6.3 | 2 | ACUTE GRAFT VS. HOST DISEASE, CHRONIC KIDNEY DISEASE, IMMUNE SYSTEM DISEASE, INFECTION, INJURY | Inosine-5'-monophosphate dehydrogenase (IMPDH) inhibitor | INHIBITOR | 4 | 6.3 | actual |
| MYCOPHENOLIC ACID | GLP1R | GLP1R | 6.0499760934767 | 6.3 | 6.3 | 1 | ACUTE GRAFT VS. HOST DISEASE, CHRONIC KIDNEY DISEASE, IMMUNE SYSTEM DISEASE, INFECTION, INJURY | Inosine-5'-monophosphate dehydrogenase (IMPDH) inhibitor | INHIBITOR | 4 | 6.3 | actual |
| MYCOPHENOLIC ACID | EHMT2 | EHMT2 BAT8 C6orf30 G9A KMT1C NG36 | 5 | 6.3 | 6.3 | 1 | ACUTE GRAFT VS. HOST DISEASE, CHRONIC KIDNEY DISEASE, IMMUNE SYSTEM DISEASE, INFECTION, INJURY | Inosine-5'-monophosphate dehydrogenase (IMPDH) inhibitor | INHIBITOR | 4 | 6.3 | actual |
| MYCOPHENOLIC ACID | SYUA | SNCA NACP PARK1 | 5.1499974139075 | 6.3 | 6.3 | 1 | ACUTE GRAFT VS. HOST DISEASE, CHRONIC KIDNEY DISEASE, IMMUNE SYSTEM DISEASE, INFECTION, INJURY | Inosine-5'-monophosphate dehydrogenase (IMPDH) inhibitor | INHIBITOR | 4 | 6.3 | actual |
| DIFLUNISAL | RORG | Rorc Nr1f3 Rorg Thor | 7.2 | 6.6225 | 1 | FEVER, HIV INFECTION, PAIN | Cyclooxygenase inhibitor | INHIBITOR | 4 | 6.6225 | predicted | |
| TEZOSENTAN | EDNRA | EDNRA ETA ETRA | 7.64 | 6.2 | 1 | HEART FAILURE, PULMONARY HYPERTENSION | Endothelin receptor ET-A antagonist, Endothelin receptor ET-B antagonist | ANTAGONIST | 3 | 6.2 | predicted | |
| NIFLUMIC ACID | HIF1A | HIF1A BHLHE78 MOP1 PASD8 | 5 | 6.0475 | 4 | ARTHRALGIA, MYALGIA, RHEUMATIC DISEASE | 0 | 6.0475 | predicted | |||
| NIFLUMIC ACID | PFKA | pfk | 5.1209844465904 | 6.0475 | 1 | ARTHRALGIA, MYALGIA, RHEUMATIC DISEASE | 0 | 6.0475 | predicted | |||
| NIFLUMIC ACID | PGH1 | PTGS1 COX1 | 5.97 | 6.385 | 1 | ARTHRALGIA, MYALGIA, RHEUMATIC DISEASE | 0 | 6.385 | predicted | |||
| NIFLUMIC ACID | APEX1 | APEX1 APE APE1 APEX APX HAP1 REF1 | 5.9500071430799 | 6.335 | 1 | ARTHRALGIA, MYALGIA, RHEUMATIC DISEASE | 0 | 6.335 | predicted | |||
| FELBAMATE | NPSR1 | NPSR1 GPR154 GPRA PGR14 | 6.1 | 7.4 | 7.4 | 1 | EPILEPSY | Glutamate [NMDA] receptor antagonist | ANTAGONIST | 4 | 7.4 | actual |
| FELBAMATE | CP2D6 | CYP2D6 CYP2DL1 | 5.7333333333333 | 7.4 | 7.4 | 3 | EPILEPSY | Glutamate [NMDA] receptor antagonist | ANTAGONIST | 4 | 7.4 | actual |
| FELBAMATE | KPYM | PKM OIP3 PK2 PK3 PKM2 | 5 | 7.4 | 6.725 | 2 | EPILEPSY | Glutamate [NMDA] receptor antagonist | ANTAGONIST | 4 | 7.4 | actual |
| FELBAMATE | ACM1 | Chrm1 Chrm-1 | 6.5 | 7.4 | 7.4 | 1 | EPILEPSY | Glutamate [NMDA] receptor antagonist | ANTAGONIST | 4 | 7.4 | actual |
| FELBAMATE | EHMT2 | EHMT2 BAT8 C6orf30 G9A KMT1C NG36 | 6.0367871213448 | 7.4 | 7.4 | 2 | EPILEPSY | Glutamate [NMDA] receptor antagonist | ANTAGONIST | 4 | 7.4 | actual |
| FELBAMATE | SMN | SMN1 SMN SMNT; SMN2 SMNC | 7.4 | 7.4 | 7.4 | 1 | EPILEPSY | Glutamate [NMDA] receptor antagonist | ANTAGONIST | 4 | 7.4 | actual |
| FELBAMATE | KCNH2 | KCNH2 ERG ERG1 HERG | 5.2500010234416 | 7.4 | 7.4 | 1 | EPILEPSY | Glutamate [NMDA] receptor antagonist | ANTAGONIST | 4 | 7.4 | actual |
| FELBAMATE | NMDE2 | GRIN2B NMDAR2B | 5.3273589343863 | 7.4 | 7.4 | 1 | EPILEPSY | Glutamate [NMDA] receptor antagonist | ANTAGONIST | 4 | 7.4 | actual |
| FELBAMATE | GEMI | GMNN | 6.9686199111952 | 7.4 | 7.4 | 2 | EPILEPSY | Glutamate [NMDA] receptor antagonist | ANTAGONIST | 4 | 7.4 | actual |
| CLAZOSENTAN | EDNRA | EDNRA ETA ETRA | 9.89 | 6.675 | 1 | SUBARACHNOID HEMORRHAGE | Endothelin receptor ET-A antagonist | ANTAGONIST | 3 | 6.675 | predicted | |
| CLAZOSENTAN | EDNRB | EDNRB ETRB | 6.76 | 6.675 | 1 | SUBARACHNOID HEMORRHAGE | Endothelin receptor ET-A antagonist | ANTAGONIST | 3 | 6.675 | predicted | |
| ICLAPRIM | DYR | DHFR, folA | 7.605287874528 | 6.0683333333333 | 10 | INFECTION, PNEUMONIA | 3 | 6.0683333333333 | predicted | |||
| PRULIFLOXACIN | ANDR | AR DHTR NR3C4 | 5.6405079179817 | 6.6875 | 3 | CHRONIC BRONCHITIS, CHRONIC OBSTRUCTIVE PULMONARY DISEASE, URINARY TRACT INFECTION | 3 | 6.6875 | predicted | |||
| MODAFINIL | SC6A3 | SLC6A3 DAT1, Slc6a3 | 5.4645454545455 | 6.0482954545454 | 11 | ALZHEIMERS DISEASE, ATTENTION DEFICIT HYPERACTIVITY DISORDER, BIPOLAR DISORDER, BRAIN NEOPLASM, COCAINE DEPENDENCE, EWING SARCOMA, FATIGUE, METAMPHETAMINE DEPENDENCE, NARCOLEPSY WITH CATAPLEXY, NON-SMALL CELL LUNG CARCINOMA, OBSTRUCTIVE SLEEP APNEA, ORTHOSTATIC HYPOTENSION, OSTEOARTHRITIS, OVARIAN CARCINOMA, POST-TRAUMATIC STRESS DISORDER, SCHIZOPHRENIA, SLEEP APNEA, STROKE, TINNITUS, UNIPOLAR DEPRESSION | Dopamine transporter inhibitor | INHIBITOR | 4 | 6.0482954545454 | predicted | |
| MODAFINIL | Q9WTR4 | Slc6a2 | 5 | 6.4 | 1 | ALZHEIMERS DISEASE, ATTENTION DEFICIT HYPERACTIVITY DISORDER, BIPOLAR DISORDER, BRAIN NEOPLASM, COCAINE DEPENDENCE, EWING SARCOMA, FATIGUE, METAMPHETAMINE DEPENDENCE, NARCOLEPSY WITH CATAPLEXY, NON-SMALL CELL LUNG CARCINOMA, OBSTRUCTIVE SLEEP APNEA, ORTHOSTATIC HYPOTENSION, OSTEOARTHRITIS, OVARIAN CARCINOMA, POST-TRAUMATIC STRESS DISORDER, SCHIZOPHRENIA, SLEEP APNEA, STROKE, TINNITUS, UNIPOLAR DEPRESSION | Dopamine transporter inhibitor | INHIBITOR | 4 | 6.4 | predicted | |
| MODAFINIL | LMNA | LMNA LMN1 | 8.74 | 6.4 | 1 | ALZHEIMERS DISEASE, ATTENTION DEFICIT HYPERACTIVITY DISORDER, BIPOLAR DISORDER, BRAIN NEOPLASM, COCAINE DEPENDENCE, EWING SARCOMA, FATIGUE, METAMPHETAMINE DEPENDENCE, NARCOLEPSY WITH CATAPLEXY, NON-SMALL CELL LUNG CARCINOMA, OBSTRUCTIVE SLEEP APNEA, ORTHOSTATIC HYPOTENSION, OSTEOARTHRITIS, OVARIAN CARCINOMA, POST-TRAUMATIC STRESS DISORDER, SCHIZOPHRENIA, SLEEP APNEA, STROKE, TINNITUS, UNIPOLAR DEPRESSION | Dopamine transporter inhibitor | INHIBITOR | 4 | 6.4 | predicted | |
| MODAFINIL | EHMT2 | EHMT2 BAT8 C6orf30 G9A KMT1C NG36 | 5.4500041484694 | 6.4 | 1 | ALZHEIMERS DISEASE, ATTENTION DEFICIT HYPERACTIVITY DISORDER, BIPOLAR DISORDER, BRAIN NEOPLASM, COCAINE DEPENDENCE, EWING SARCOMA, FATIGUE, METAMPHETAMINE DEPENDENCE, NARCOLEPSY WITH CATAPLEXY, NON-SMALL CELL LUNG CARCINOMA, OBSTRUCTIVE SLEEP APNEA, ORTHOSTATIC HYPOTENSION, OSTEOARTHRITIS, OVARIAN CARCINOMA, POST-TRAUMATIC STRESS DISORDER, SCHIZOPHRENIA, SLEEP APNEA, STROKE, TINNITUS, UNIPOLAR DEPRESSION | Dopamine transporter inhibitor | INHIBITOR | 4 | 6.4 | predicted | |
| PHENYLEPHRINE HYDROCHLORIDE | LMNA | LMNA LMN1 | 5.525 | 6.15 | 2 | CARDIAC ARRHYTHMIA, CATARACT, HYPOTENSION, OVARIAN CYST, PREECLAMPSIA | Adrenergic receptor alpha-1 agonist | AGONIST | 4 | 6.15 | predicted | |
| PHENYLEPHRINE HYDROCHLORIDE | HIF1A | HIF1A BHLHE78 MOP1 PASD8 | 7 | 6.15 | 2 | CARDIAC ARRHYTHMIA, CATARACT, HYPOTENSION, OVARIAN CYST, PREECLAMPSIA | Adrenergic receptor alpha-1 agonist | AGONIST | 4 | 6.15 | predicted | |
| PHENYLEPHRINE HYDROCHLORIDE | TRXR1 | Txnrd1 Trxr1 | 5.8738361111942 | 6.15 | 1 | CARDIAC ARRHYTHMIA, CATARACT, HYPOTENSION, OVARIAN CYST, PREECLAMPSIA | Adrenergic receptor alpha-1 agonist | AGONIST | 4 | 6.15 | predicted | |
| PHENYLEPHRINE HYDROCHLORIDE | LYAG | GAA | 6.55 | 6.15 | 2 | CARDIAC ARRHYTHMIA, CATARACT, HYPOTENSION, OVARIAN CYST, PREECLAMPSIA | Adrenergic receptor alpha-1 agonist | AGONIST | 4 | 6.15 | predicted | |
| PHENYLEPHRINE HYDROCHLORIDE | GLP1R | GLP1R | 5.1999976745735 | 6.15 | 2 | CARDIAC ARRHYTHMIA, CATARACT, HYPOTENSION, OVARIAN CYST, PREECLAMPSIA | Adrenergic receptor alpha-1 agonist | AGONIST | 4 | 6.15 | predicted | |
| PHENYLEPHRINE HYDROCHLORIDE | ADRB2 | ADRB2 ADRB2R B2AR | 5.8111876675476 | 6.15 | 2 | CARDIAC ARRHYTHMIA, CATARACT, HYPOTENSION, OVARIAN CYST, PREECLAMPSIA | Adrenergic receptor alpha-1 agonist | AGONIST | 4 | 6.15 | predicted | |
| PHENYLEPHRINE HYDROCHLORIDE | GEMI | GMNN | 5.9362164394026 | 6.15 | 1 | CARDIAC ARRHYTHMIA, CATARACT, HYPOTENSION, OVARIAN CYST, PREECLAMPSIA | Adrenergic receptor alpha-1 agonist | AGONIST | 4 | 6.15 | predicted | |
| PHENYLEPHRINE HYDROCHLORIDE | PMP22 | Pmp22 Cd25 Pmp-22 | 5.9421818055679 | 6.15 | 1 | CARDIAC ARRHYTHMIA, CATARACT, HYPOTENSION, OVARIAN CYST, PREECLAMPSIA | Adrenergic receptor alpha-1 agonist | AGONIST | 4 | 6.15 | predicted | |
| PHENYLEPHRINE HYDROCHLORIDE | IDHC | IDH1 PICD | 6.5362562787529 | 6.15 | 1 | CARDIAC ARRHYTHMIA, CATARACT, HYPOTENSION, OVARIAN CYST, PREECLAMPSIA | Adrenergic receptor alpha-1 agonist | AGONIST | 4 | 6.15 | predicted | |
| PHENYLEPHRINE HYDROCHLORIDE | P53 | TP53 P53 | 6.8498578381514 | 6.15 | 1 | CARDIAC ARRHYTHMIA, CATARACT, HYPOTENSION, OVARIAN CYST, PREECLAMPSIA | Adrenergic receptor alpha-1 agonist | AGONIST | 4 | 6.15 | predicted | |
| PHENYLEPHRINE HYDROCHLORIDE | SO1B1 | SLCO1B1 LST1 OATP1B1 OATP2 OATPC SLC21A6 | 6.0548934342865 | 6.15 | 1 | CARDIAC ARRHYTHMIA, CATARACT, HYPOTENSION, OVARIAN CYST, PREECLAMPSIA | Adrenergic receptor alpha-1 agonist | AGONIST | 4 | 6.15 | predicted | |
| TIVOZANIB | CDK3 | CDK3 CDKN3 | 6.0933754612198 | 6.11875 | 6 | COLORECTAL ADENOCARCINOMA, GLIOBLASTOMA MULTIFORME, HEPATOCELLULAR CARCINOMA, NEOPLASM, NON-SMALL CELL LUNG CARCINOMA, RENAL CELL CARCINOMA, SARCOMA | Vascular endothelial growth factor receptor inhibitor | INHIBITOR | 3 | 6.11875 | predicted | |
| CRIDANIMOD | TRYP | 5.15 | 6.449227503252 | 1 | ENDOMETRIAL NEOPLASM | 2 | 6.449227503252 | predicted | ||||
| CRIDANIMOD | EHMT2 | EHMT2 BAT8 C6orf30 G9A KMT1C NG36 | 5.0500004571401 | 6.361727503252 | 1 | ENDOMETRIAL NEOPLASM | 2 | 6.361727503252 | predicted | |||
| CRIDANIMOD | ASM | SMPD1 ASM | 5 | 6.361727503252 | 1 | ENDOMETRIAL NEOPLASM | 2 | 6.361727503252 | predicted | |||
| PUMOSETRAG | 5HT3A | HTR3A 5HT3R HTR3 | 6.537297107238 | 6.1875 | 4 | GASTROESOPHAGEAL REFLUX DISEASE | 2 | 6.1875 | predicted |