Correlation analysis
The first step is to study the existing correlation between the chemblScore and the predicted average cytotoxScore for each particular protein. The figure below shows a typical dashboard designed to find the best and most trustworthy correlations. The top left plot displays the relationship between the calculated slope and R squared, where slopes R2 values both > 0.5 are marked, thus causing the selected points to appear in the second plot (bottom left), where we can see the number of events in the database vs the number of unique molecules participating in those events. Marking here elements with more than 4 events with at least 2 different molecules produces the right diagram, where correlations of marked points are visualized, trellised by protein name. The CombinedPredictedAndActualCytotoxIndex is a combination of predictions and actual cytotoxScores, where the predicted values have been replaced by the actual ones when they exist. 
Proportion of active predictions.
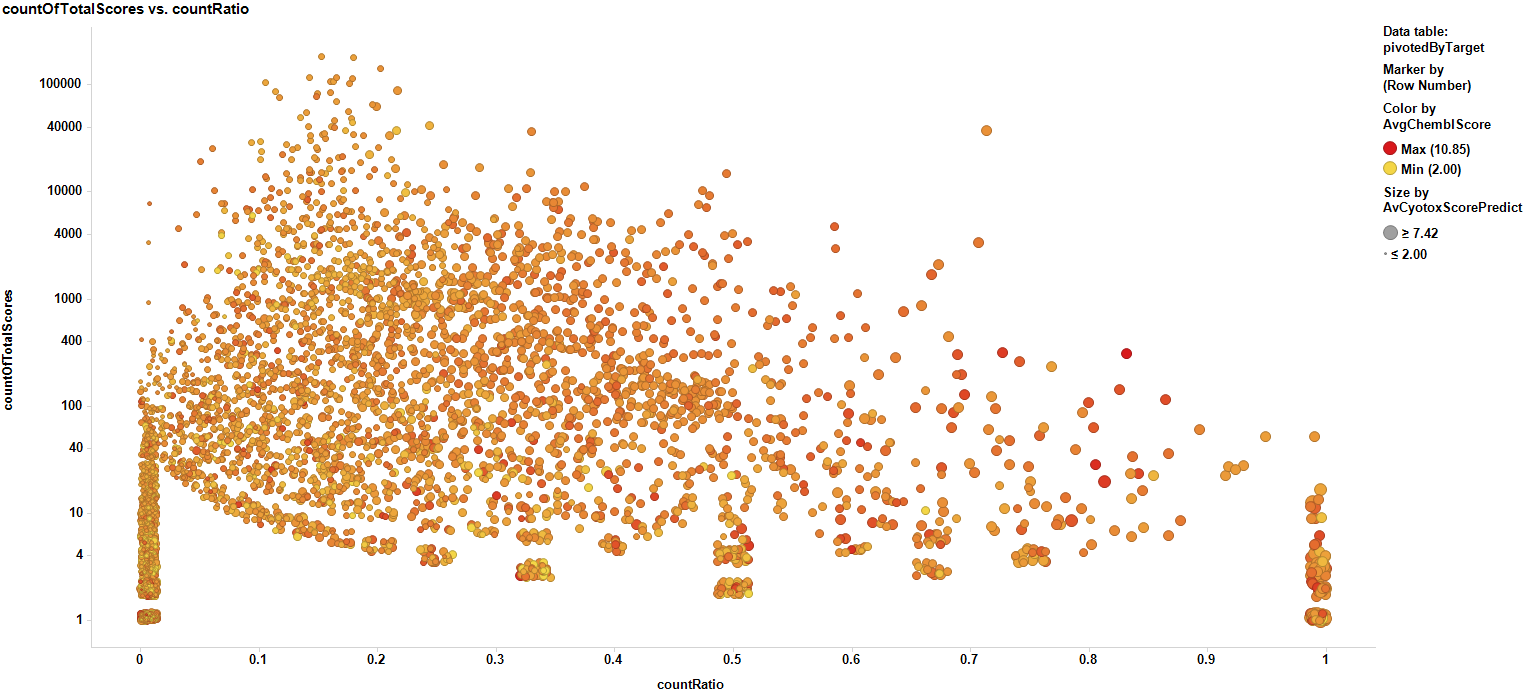
To allow extensive visualization of all target cytotoxicity records the countRatio view has been created. The count ratio is the proportion of active (cytotoxic) predicted and actual events vs the total number of events. The plot below shows the distribution of count ratios vs total events for all DB contents.
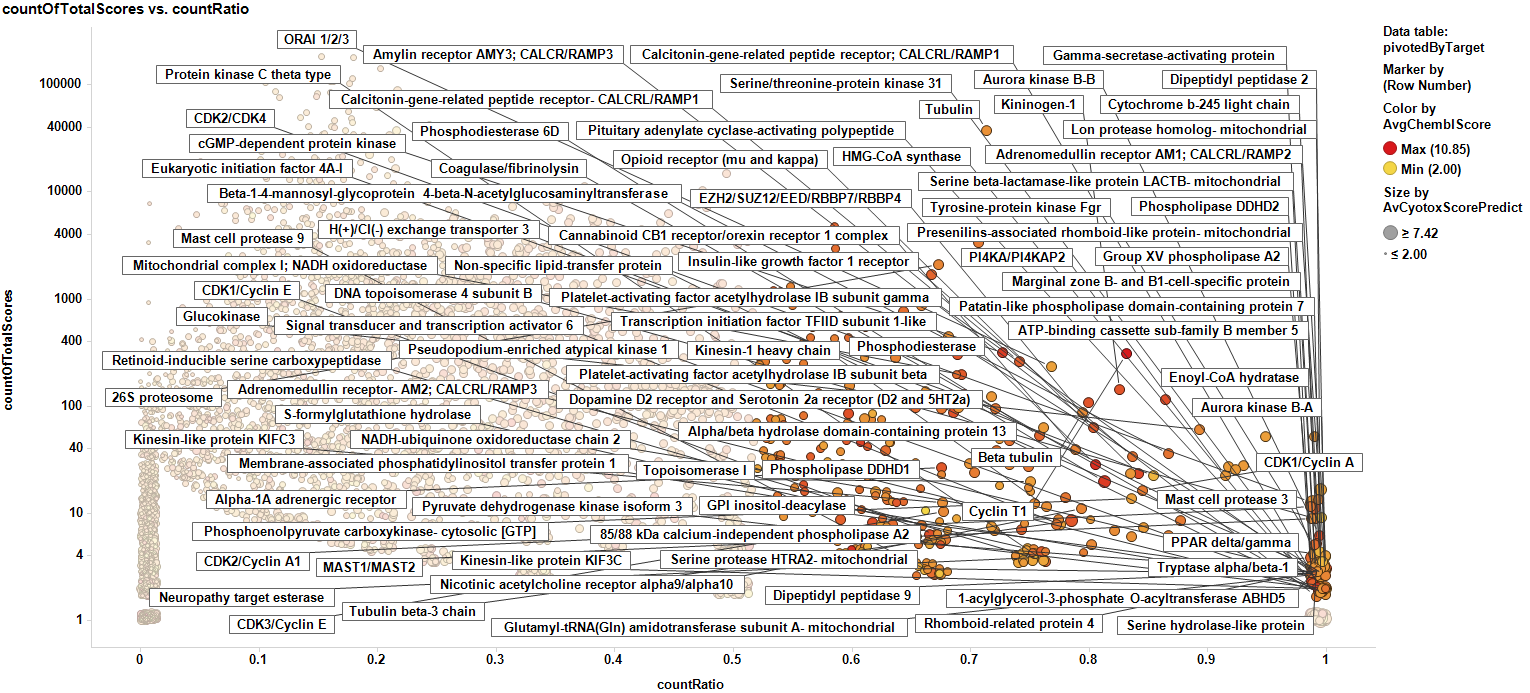
Same plot marking countRatios > 0.5 for at least two independent events.
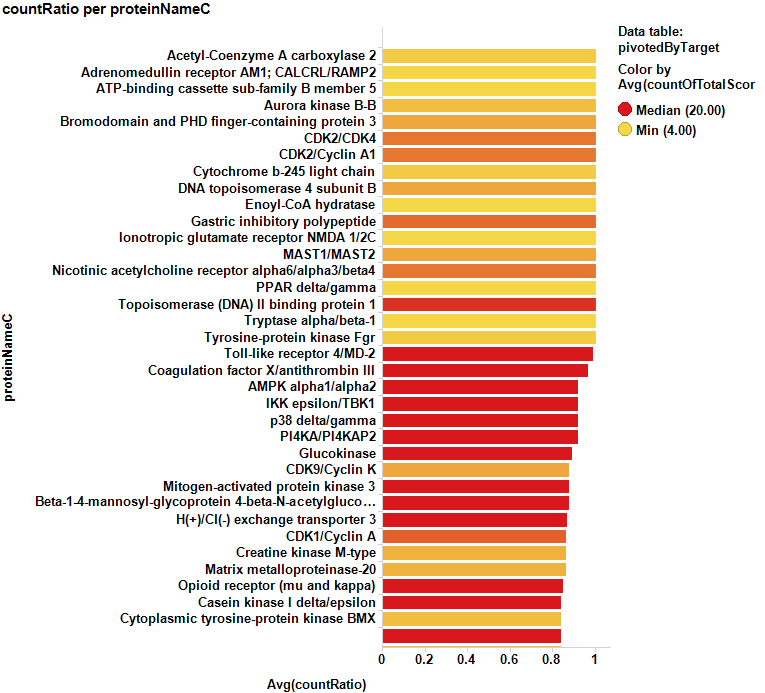
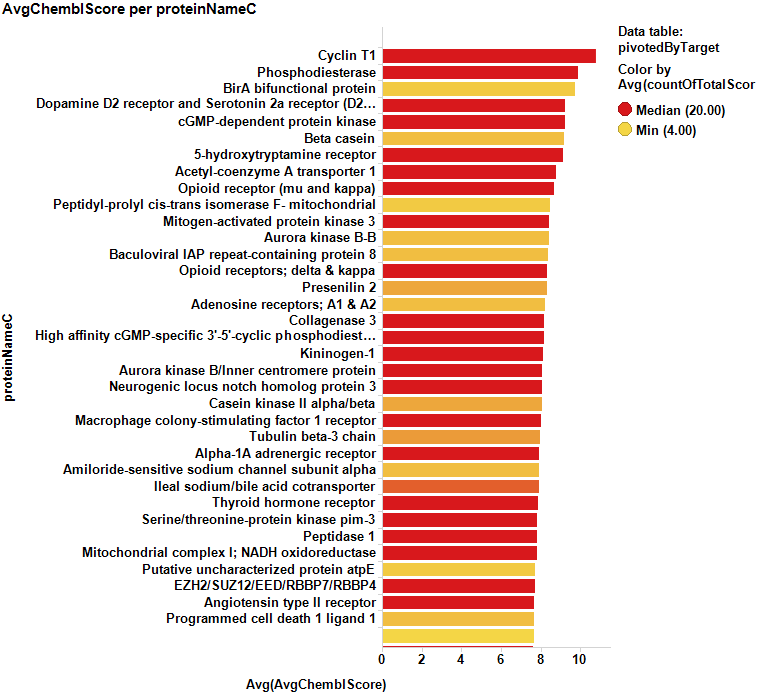
Barcharts below show some of the targets with the highest likelihood of being cytotoxic sorted either by their countRatio or chemblScore.
The table at the bottom of the page contains the records marked in the chart above.
Targets with higher cytotoxicity probability sorted by count Ratio
Targets with higher cytotoxicity probability sorted by their chemblScore
Potentially toxic protein targets.
| proteinNameC | AvgChemblScore | AvCyotoxScorePrediction | countOfTotalScores | countRatio |
|---|---|---|---|---|
| DNA topoisomerase 4 | 5 | 4.7492385956882 | 120 | 0.66666666666667 |
| Serine/threonine-protein kinase WEE1 | 6.1748098243565 | 5.0706852926913 | 945 | 0.54179894179894 |
| Tyrosine-protein kinase receptor Tie-1 | 5.5540945924737 | 4.9816539434483 | 147 | 0.54421768707483 |
| Epithelial discoidin domain-containing receptor 1 | 6.1506030766354 | 5.0617301533049 | 253 | 0.55731225296443 |
| Tubulin alpha-1 chain | 5.4750672928932 | 5.1959153629845 | 43 | 0.62790697674419 |
| Mitogen-activated protein kinase 7 | 5.3281037474288 | 5.0894734159103 | 190 | 0.54736842105263 |
| Receptor-interacting serine/threonine-protein kinase 1 | 5.8951242371124 | 5.2838401346276 | 253 | 0.63241106719368 |
| Voltage-gated potassium channel subunit Kv1.1 | 7.3675969648835 | 4.9878035856884 | 111 | 0.54954954954955 |
| Peptidyl-prolyl cis-trans isomerase FKBP5 | 4.8986639239995 | 5.2997354054325 | 122 | 0.72131147540984 |
| Splicing factor 3B subunit 3 | 5.4830530998707 | 5.3343556617786 | 67 | 0.53731343283582 |
| Voltage-gated potassium channel subunit Kv1.3 | 7.394900129669 | 5.0373375804766 | 982 | 0.54276985743381 |
| Formyl peptide receptor-related sequence 1 | 5.4013516201037 | 5.0553336868999 | 26 | 0.57692307692308 |
| Dopamine D2 receptor and Serotonin 2a receptor (D2 and 5HT2a) | 9.2054545454546 | 6.3300516491435 | 22 | 0.81818181818182 |
| Bacterial DNA-directed RNA polymerase | 5.0910221012368 | 4.9930917095749 | 276 | 0.60144927536232 |
| Coagulation factor XI | 6.0625013928405 | 4.9239986595192 | 642 | 0.52959501557632 |
| Lysosomal Pro-X carboxypeptidase | 7.233270434717 | 5.0764351987056 | 714 | 0.58963585434174 |
| Mitochondrial complex I; NADH oxidoreductase | 7.7496680175808 | 5.8542974690255 | 194 | 0.70103092783505 |
| Cytochrome b-245 light chain | 7.568 | 5.9644859480354 | 5 | 1 |
| CaM kinase II | 5.1453528004467 | 4.7094461025533 | 576 | 0.52083333333333 |
| Mitochondrial complex V; ATP synthase | 5.1491939711006 | 5.2968377167755 | 456 | 0.67982456140351 |
| PI3-kinase p85-alpha subunit | 5.5716666666667 | 4.9949744849658 | 12 | 0.58333333333333 |
| Cathepsin S | 6.8755228659998 | 5.0612292046437 | 2632 | 0.57294832826748 |
| Renin | 7.3564243655005 | 5.1893476552003 | 4848 | 0.59694719471947 |
| Tubulin | 5.1959502543901 | 5.7192183186131 | 33756 | 0.72316032705297 |
| Topoisomerase I | 4.621783912855 | 5.7732226525149 | 23 | 0.73913043478261 |
| Beta tubulin | 5.4381029582098 | 5.9628716893383 | 88 | 0.78409090909091 |
| Tubulin beta-1 chain | 5.3294885216762 | 5.3840182759259 | 154 | 0.6038961038961 |
| Tubulin beta-3 chain | 7.9022222222222 | 6.7425056150832 | 9 | 0.77777777777778 |
| Nuclear receptor subfamily 2 group C member 2 | 4.9546569333637 | 5.1336779897211 | 23 | 0.56521739130435 |
| Phospholipase D2 | 6.1190583596343 | 5.0551648754195 | 368 | 0.5570652173913 |
| Phospholipase D1 | 6.5564097332337 | 5.1172227723543 | 389 | 0.57840616966581 |
| Apoptosis regulator Bcl-2 | 7.2731331559299 | 5.5581304167984 | 1658 | 0.67490952955368 |
| Phosphodiesterase 7 | 4.9430098862509 | 4.7172483997149 | 122 | 0.52459016393443 |
| Carnitine palmitoyltransferase 1A | 6.5601440407552 | 5.0779414768004 | 524 | 0.56297709923664 |
| Opioid receptor (mu and kappa) | 8.6323076923077 | 5.7469859039584 | 26 | 0.84615384615385 |
| Histone deacetylase 3/NCoR1 | 6.562121250542 | 4.9902240631271 | 80 | 0.55 |
| Dipeptidyl peptidase I | 7.5218124892765 | 4.8678047635036 | 746 | 0.5455764075067 |
| G1/S-specific cyclin D1 | 4.1818181818182 | 5.3295213285972 | 11 | 0.72727272727273 |
| Epidermal growth factor receptor | 5.7761871520452 | 5.2743677078556 | 736 | 0.65760869565217 |
| Cannabinoid CB1 receptor/orexin receptor 1 complex | 5.9335384862971 | 5.8087400112738 | 36 | 0.77777777777778 |
| Brain adenylate cyclase 1 | 6.121151089783 | 5.0604102985215 | 219 | 0.54794520547945 |
| p53-binding protein Mdm-2 | 7.0430044081744 | 4.9899673676427 | 3230 | 0.50897832817337 |
| Protein-tyrosine kinase 2-beta | 6.4279166666667 | 5.269141798629 | 24 | 0.75 |
| Carnitine palmitoyltransferase 2 | 4.4562715537013 | 5.0575072823223 | 968 | 0.55785123966942 |
| Carnitine O-palmitoyltransferase 1- liver isoform | 6.8810374291051 | 5.1413358459315 | 501 | 0.58682634730539 |
| Opioid receptors; delta & kappa | 8.2635661366593 | 5.274745519034 | 88 | 0.59090909090909 |
| cAMP and cAMP-inhibited cGMP 3'-5'-cyclic phosphodiesterase 10A | 7.3219433901361 | 4.9979632055858 | 1179 | 0.53944020356234 |
| Matrix metalloproteinase 15 | 5.4403919988207 | 4.7054615791154 | 47 | 0.51063829787234 |
| Matrix metalloproteinase 17 | 5.390024865256 | 5.079351805821 | 28 | 0.53571428571429 |
| Topoisomerase (DNA) II binding protein 1 | 4.301029995664 | 6.4587830115798 | 18 | 1 |
| Calcitonin-gene-related peptide receptor- CALCRL/RAMP1 | 7.5815778412324 | 5.6030854863775 | 238 | 0.75210084033613 |
| Transient receptor potential cation channel subfamily V member 6 | 3.9727664812821 | 4.8386800667246 | 85 | 0.61176470588235 |
| ORAI 1/2/3 | 4.4790924936934 | 5.8125561242273 | 246 | 0.78048780487805 |
| Bromodomain testis-specific protein | 4.78875 | 5.1264081099734 | 16 | 0.75 |
| Protein phosphatase 2A regulatory subunit B' | 4.6791612445127 | 5.1916248289104 | 29 | 0.62068965517241 |
| Neutral sphingomyelinase | 4.6593658472605 | 4.6776474127088 | 51 | 0.62745098039216 |
| Mast cell protease 3 | 6.4733333333333 | 5.7799474928589 | 3 | 1 |
| Mast cell protease 9 | 6.8266666666667 | 5.5114006296905 | 3 | 0.66666666666667 |
| Group IID secretory phospholipase A2 | 6.1217258930165 | 4.8873110148525 | 38 | 0.55263157894737 |
| RAS guanyl releasing protein 3 | 6.8159259259259 | 5.0526551060155 | 81 | 0.53086419753086 |
| Falcipain 2B | 4.8445454545455 | 4.8556151895469 | 11 | 0.54545454545454 |
| Phosphodiesterase 6 | 5.7984824760943 | 5.0056589399068 | 1422 | 0.54852320675106 |
| AMP deaminase 3 | 6.2435060872639 | 4.969947562493 | 49 | 0.55102040816327 |
| PBP2 | 5.6661585273271 | 5.0851029352317 | 50 | 0.6 |
| Folate receptor beta | 5.7545718750078 | 5.186906338271 | 53 | 0.56603773584906 |
| Thymidylate synthase (EC 2.1.1.45) (TS) (TSase) | 6.4149697216552 | 5.4411105514204 | 9 | 0.77777777777778 |
| Histone-lysine N-methyltransferase EZH2 | 6.7918978772026 | 5.1545634215876 | 572 | 0.61013986013986 |
| Coagulation factor IX | 6.0546179135548 | 5.0183435214187 | 408 | 0.57598039215686 |
| Vacuolar ATP synthase subunit S1 | 5.2266666666667 | 4.9772252199011 | 24 | 0.54166666666667 |
| Serine/threonine-protein kinase BUD32 | 6.3846963563381 | 4.8666221834631 | 3 | 0.66666666666667 |
| Serine/threonine-protein kinase SMG1 | 7.0509377477782 | 5.1231688806152 | 39 | 0.56410256410256 |
| Glucan synthase | 4.4552531916293 | 5.1045490257514 | 43 | 0.58139534883721 |
| Membrane-associated phosphatidylinositol transfer protein 1 | 5.725371921463 | 6.1292813556889 | 2 | 1 |
| 14-3-3 protein sigma | 5.5254883027562 | 4.9929095006458 | 14 | 0.64285714285714 |
| Amiloride-sensitive cation channel 2- neuronal | 5.0976003899541 | 4.7119496282061 | 35 | 0.54285714285714 |
| PPAR alpha/gamma | 7.5798243133886 | 4.4161932480434 | 18 | 0.55555555555556 |
| Enoyl-CoA hydratase | 3.4776387107064 | 5.5995596040686 | 4 | 1 |
| Glyceraldehyde-3-phosphate dehydrogenase cytosolic | 4.7200980948251 | 5.1903857631163 | 42 | 0.73809523809524 |
| Mitogen-activated protein kinase 3 | 8.4000489442447 | 5.9847025864339 | 111 | 0.87387387387387 |
| Peroxidase | 4.8051231400848 | 5.1970170066566 | 4 | 0.75 |
| Xaa-Pro dipeptidase | 4.6536990407911 | 4.7808764944342 | 82 | 0.53658536585366 |
| Pyruvate dehydrogenase kinase isoform 3 | 4.4541360819912 | 6.8644119281369 | 2 | 1 |
| Matrix metalloproteinase 11 | 6.6159065157485 | 4.8030692414302 | 47 | 0.53191489361702 |
| Sarcoplasmic/endoplasmic reticulum calcium ATP-ase | 7.0852402166375 | 5.2843416122914 | 98 | 0.66326530612245 |
| Tubulin beta-2 chain | 5.3697845939063 | 5.2542384943368 | 24 | 0.54166666666667 |
| Poly [ADP-ribose] polymerase 12 | 3.7936933441099 | 3.9373254774015 | 5 | 0.6 |
| HMG-CoA synthase | 7.545 | 5.7861111111111 | 2 | 1 |
| Adenosine receptor A3 | 6.76 | 5.0489294857066 | 8 | 0.625 |
| Carbohydrate (N-acetylglucosamine 6-O) sulfotransferase 4 | 4.5417429766849 | 5.1523684220053 | 4 | 0.75 |
| Plasmepsin 1 | 6.9695571538299 | 5.0739466916431 | 144 | 0.59027777777778 |
| 26S proteosome | 5.7537684819849 | 5.902813128367 | 2109 | 0.67188240872451 |
| Phosphoenolpyruvate carboxykinase cytosolic | 5.7578052991203 | 5.4294839252966 | 25 | 0.72 |
| Phosphoenolpyruvate carboxykinase- cytosolic [GTP] | 4.4658333333333 | 5.6286374726157 | 12 | 0.83333333333333 |
| Elongation factor 1-alpha 1 | 4.9733333333333 | 4.3963408649874 | 9 | 0.55555555555556 |
| Phospholipase A2- membrane associated | 6.5260564469668 | 4.9277205650838 | 32 | 0.53125 |
| Group IIE secretory phospholipase A2 | 6.9048495073253 | 5.2430003381808 | 36 | 0.63888888888889 |
| Group IIF secretory phospholipase A2 | 6.1700828658149 | 5.2899420317599 | 28 | 0.71428571428571 |
| Ileal sodium/bile acid cotransporter | 7.8514732027989 | 4.721169706341 | 14 | 0.64285714285714 |
| Choline kinase alpha | 5.0837473168955 | 5.2661521590979 | 109 | 0.68807339449541 |
| Potassium voltage-gated channel subfamily H member 2 | 5.74125 | 5.1148304592134 | 24 | 0.66666666666667 |
| Nucleoprotein | 4.2532605992449 | 4.6657748096324 | 25 | 0.6 |
| Disintegrin and metalloproteinase domain-containing protein 33 | 6.7871428571429 | 5.5899545579826 | 14 | 0.64285714285714 |
| Sulfonylurea receptor 1 | 7.4575 | 5.3697218541391 | 8 | 0.75 |
| ATP-binding cassette sub-family B member 5 | 5 | 6.8909346481545 | 4 | 1 |
| Palmitoyl-CoA oxidase | 5.5781702457476 | 5.2458237759784 | 76 | 0.60526315789474 |
| Transcription intermediary factor 1-alpha | 4.1014005599959 | 5.049379068387 | 28 | 0.57142857142857 |
| Bromodomain and PHD finger-containing protein 3 | 3.025 | 5.5798853752044 | 8 | 1 |
| Angiotensin type II receptor | 7.6464285714286 | 4.8761182954018 | 28 | 0.57142857142857 |
| Receptor-type tyrosine-protein kinase FLT3 | 5.4666666666667 | 5.4701007878469 | 12 | 0.75 |
| Kinase suppressor of Ras 2 | 3.3766038426166 | 5.2663770381298 | 3 | 1 |
| Pseudopodium-enriched atypical kinase 1 | 5.7378269831012 | 5.5524915642096 | 2 | 1 |
| Tau-tubulin kinase 1 | 5.3771379702501 | 4.4801649385956 | 6 | 0.66666666666667 |
| cAMP-dependent protein kinase- gamma catalytic subunit | 4.5041177610417 | 5.11256574157 | 8 | 0.625 |
| CDK2/Cyclin A1 | 6.3750775913315 | 5.9652604435778 | 12 | 1 |
| CDK1/Cyclin A | 6.2061004678591 | 5.7827915249492 | 14 | 0.85714285714286 |
| Serine/threonine-protein kinase A-Raf | 5.4760361920498 | 5.1432490912367 | 16 | 0.5625 |
| CDK1/Cyclin E | 5.5244149856255 | 5.9608462091247 | 6 | 0.66666666666667 |
| CDK3/Cyclin E | 5.6507399404421 | 5.7467683563357 | 12 | 0.66666666666667 |
| CDK4/Cyclin D3 | 4.450295589406 | 4.9641822833462 | 10 | 0.6 |
| Atrial natriuretic peptide receptor | 7.5146464575467 | 4.7640096784014 | 36 | 0.55555555555556 |
| Tripeptidyl-peptidase 2 | 5.5752182518111 | 5.4483468788718 | 5 | 0.8 |
| Cell division protein zipA | 4.64 | 4.7787271237841 | 6 | 0.66666666666667 |
| Thyroid hormone receptor | 7.818221344258 | 5.1400231624773 | 46 | 0.60869565217391 |
| Breakpoint cluster region protein | 4.411873459365 | 5.0491016843124 | 172 | 0.53488372093023 |
| E3 ubiquitin-protein ligase Mdm2 | 7.6375 | 5.222358780377 | 4 | 0.75 |
| cGMP-dependent protein kinase | 9.1869233045125 | 5.5183603950353 | 275 | 0.73454545454545 |
| Calcitonin gene-related peptide 1 | 6.1718257610381 | 4.6376436999715 | 145 | 0.57241379310345 |
| Cathepsin F | 6.0267901390397 | 4.7652767798716 | 56 | 0.53571428571429 |
| beta-actin | 5.304 | 4.9045256996429 | 5 | 0.6 |
| AMP-binding enzyme family protein | 6.0715866650899 | 5.0411210064493 | 33 | 0.54545454545454 |
| TLR7 and TLR8 | 5 | 5.2897401680181 | 26 | 0.69230769230769 |
| Glycerol-3-phosphate dehydrogenase [NAD+]- cytoplasmic | 4.4448884705713 | 4.8133634698779 | 5 | 0.6 |
| Aurora kinase B-A | 7.8633333333333 | 6.3663636215994 | 3 | 1 |
| Cathepsin L1 | 6.1746153846154 | 4.9664147414426 | 13 | 0.61538461538461 |
| Calcitonin-gene-related peptide receptor; CALCRL/RAMP1 | 4.7311546877074 | 5.6762939765967 | 2 | 1 |
| Adrenomedullin receptor AM1; CALCRL/RAMP2 | 3.349485002168 | 5.614880391294 | 4 | 1 |
| Acetyl-Coenzyme A carboxylase 2 | 6.956 | 5.2856364834687 | 5 | 1 |
| Tryptase alpha/beta-1 | 7.125 | 6.6435400591812 | 4 | 1 |
| Geranylgeranyl transferase type 1 | 5.0315518422194 | 5.2345441584124 | 76 | 0.60526315789474 |
| Alpha-1A adrenergic receptor | 7.8765613696552 | 5.7102359326937 | 28 | 0.67857142857143 |
| Integrin alpha-L | 5.2358065167728 | 4.9592517312933 | 31 | 0.51612903225806 |
| Kir6.2/SUR1 | 5.0922532482286 | 4.7921334038307 | 8 | 0.625 |
| Antigen-presenting glycoprotein CD1d | 4.7321428571429 | 5.4660822083836 | 56 | 0.76785714285714 |
| Glutamate [NMDA] receptor subunit epsilon 4 | 5.5479680690428 | 5.2425439732262 | 59 | 0.71186440677966 |
| JAK1/JAK2/TYK2 | 6.4972727272727 | 4.7086311000839 | 66 | 0.54545454545454 |
| JAK2/JAK1 | 5.6901009987414 | 4.9377441649307 | 60 | 0.6 |
| JAK1/TYK2 | 6.684 | 4.8890765787826 | 20 | 0.6 |
| Creatine kinase M-type | 4.6630531924504 | 5.2109624410459 | 7 | 0.85714285714286 |
| CDK9/Cyclin K | 6.2181023779453 | 5.6598086280743 | 8 | 0.875 |
| Putative uncharacterized protein atpE | 7.664 | 5.2908625261493 | 5 | 0.6 |
| Solute carrier organic anion transporter family member 4A1 | 4.9173324303142 | 4.4499481379692 | 3 | 0.66666666666667 |
| Adenosine receptors; A2b & A3 | 6.47 | 5.0846663804949 | 2 | 1 |
| Acyl-CoA desaturase | 7.0258654095487 | 5.0725394140739 | 633 | 0.54818325434439 |
| TGF-beta receptor type-1 | 6.4817647058823 | 4.9370961140736 | 17 | 0.52941176470588 |
| HSP90 and hnRNPA2/B1 | 4.7274429919427 | 5.6527478293481 | 16 | 0.625 |
| Kinesin-like protein KIF2C | 5.0055429749974 | 5.4333640617631 | 17 | 0.58823529411765 |
| Kinesin-like protein KIFC3 | 5.2646367035835 | 5.5290161932309 | 12 | 0.66666666666667 |
| Kinesin-like protein KIFC1 | 5.2335 | 4.9933600135009 | 40 | 0.6 |
| Diacylglycerol O-acyltransferase 1 | 6.5864022611869 | 5.1502880369796 | 1194 | 0.61222780569514 |
| Eukaryotic initiation factor 4A-I | 6.472331419253 | 5.5457811912301 | 100 | 0.73 |
| POU domain- class 2- transcription factor 1 | 3.58 | 4.7398100242315 | 3 | 0.66666666666667 |
| Activated CDC42 kinase 1 | 6.6280487804878 | 5.4778496121873 | 41 | 0.73170731707317 |
| H(+)/Cl(-) exchange transporter 3 | 3.5 | 6.1883628894927 | 22 | 0.86363636363636 |
| Serine/threonine-protein kinase 31 | 5.8410347396166 | 6.2602110814464 | 2 | 1 |
| Phosphodiesterase 6D | 7.2414242595001 | 5.5440391709864 | 54 | 0.75925925925926 |
| Insulin-like growth factor 1 receptor | 6.6469444444444 | 5.5786489766424 | 36 | 0.83333333333333 |
| ADP-ribosylation factor 1 | 5.3025 | 5.1213296827909 | 4 | 0.75 |
| ADP-ribosylation factor 6 | 4 | 5.0651120482561 | 3 | 0.66666666666667 |
| Actin | 5 | 5.1326410331204 | 5 | 0.6 |
| Protein kinase C theta type | 6.9525 | 5.7248689806495 | 4 | 0.75 |
| ATP synthase subunit a | 5.0766898818175 | 5.1843877497751 | 6 | 0.66666666666667 |
| Macrophage colony-stimulating factor 1 receptor | 7.990386211159 | 5.3864439173368 | 259 | 0.67567567567568 |
| Thioredoxin reductase 1 | 4.8211160358828 | 4.8077310880775 | 11 | 0.63636363636364 |
| Non-specific lipid-transfer protein | 6.245 | 5.6730952357059 | 2 | 1 |
| Proline iminopeptidase | 5.7925637945284 | 4.8494096457302 | 3 | 0.66666666666667 |
| Coagulase/fibrinolysin | 5 | 6.0417918493724 | 2 | 1 |
| Sodium/myo-inositol cotransporter 2 | 5.4333333333333 | 5.0685261689129 | 3 | 0.66666666666667 |
| Tryptophan 5-hydroxylase 2 | 5.1042857142857 | 5.3439662033757 | 7 | 0.71428571428571 |
| Gastric inhibitory polypeptide | 5.6453846153846 | 5.3028191059935 | 13 | 1 |
| Rod cGMP-specific 3'-5'-cyclic phosphodiesterase subunit alpha | 5.78 | 4.9150490782487 | 5 | 0.6 |
| Cyclin T1 | 10.750496508514 | 5.6731218252674 | 353 | 0.8300283286119 |
| Matrix metalloproteinase-25 | 6.8802059991328 | 4.843590119392 | 10 | 0.6 |
| Secreted frizzled-related protein 1 | 6.3780748450466 | 5.1199159428289 | 203 | 0.54679802955665 |
| Preprocathepsin c- putative | 3 | 4.8075728359778 | 3 | 0.66666666666667 |
| Matrix metalloproteinase-24 | 3.7204119982656 | 4.7588917627901 | 5 | 0.6 |
| Mast/stem cell growth factor receptor Kit | 6.97875 | 5.414091689675 | 8 | 0.625 |
| Elongation of very long chain fatty acids protein 6 | 6.3953424657534 | 5.0846235767267 | 146 | 0.54109589041096 |
| Elongation of very long chain fatty acids protein 3 | 6.535 | 5.3084058210886 | 14 | 0.78571428571429 |
| Elongation of very long chain fatty acids protein 2 | 5 | 5.1998187132522 | 3 | 0.66666666666667 |
| Elongation of very long chain fatty acids protein 5 | 5 | 5.1998187132522 | 3 | 0.66666666666667 |
| Pituitary adenylate cyclase-activating polypeptide | 9.76 | 5.8002798421799 | 2 | 1 |
| Kinesin-1 heavy chain | 5.263234588108 | 5.7906382081001 | 13 | 0.76923076923077 |
| Glutamyl endopeptidase | 4.7376156960751 | 4.5813398177484 | 19 | 0.52631578947368 |
| Baculoviral IAP repeat-containing protein 8 | 8.325 | 5.4302603215305 | 6 | 0.66666666666667 |
| Bcl-2-like protein 11 | 5.3328512081096 | 4.5866916347989 | 8 | 0.75 |
| Glutathione transferase omega 1 | 7.0258035743922 | 5.1030005626685 | 11 | 0.63636363636364 |
| Kinetochore protein NDC80 homolog | 4.3076923076923 | 5.221002826705 | 13 | 0.53846153846154 |
| Microtubule-associated protein 2 | 4.6022906329035 | 5.0171642869842 | 95 | 0.6 |
| Virulence sensor histidine kinase phoQ | 4 | 4.9177478330593 | 6 | 0.66666666666667 |
| Kallikrein 8 | 3.5 | 5.2940000426434 | 4 | 0.75 |
| 2-desacetyl-2-hydroxyethyl bacteriochlorophyllide A dehydrogenase | 6.122 | 4.939966525384 | 5 | 0.8 |
| Acyl-protein thioesterase 2 | 5.552380952381 | 4.9636126500802 | 21 | 0.61904761904762 |
| Acyl-protein thioesterase 1 | 5.59386994772 | 4.9398352759459 | 24 | 0.58333333333333 |
| Nucleophosmin | 4.161 | 5.0232375304688 | 10 | 0.7 |
| Proline-rich AKT1 substrate 1 | 5.75 | 5.4350022356907 | 4 | 0.75 |
| Kinesin-like protein KIF3C | 2 | 6.0237329237034 | 2 | 1 |
| 6-7-dimethyl-8-ribityllumazine synthase | 4.2310359920087 | 5.115851186747 | 28 | 0.53571428571429 |
| Urotensin-2 | 6.58 | 4.7283326469364 | 4 | 0.75 |
| PPAR delta/gamma | 5 | 6.2331550523031 | 4 | 1 |
| Sodium channel protein type 9 subunit alpha | 5.9943333333333 | 5.1446541556228 | 30 | 0.6 |
| CCR5/mu opioid receptor complex | 5 | 5.3986676497532 | 2 | 1 |
| AMPK alpha2/beta1/gamma1 | 5.438702854259 | 5.0544661779205 | 72 | 0.625 |
| Peptidyl-prolyl cis-trans isomerase F- mitochondrial | 8.4323697499233 | 5.1710208907404 | 5 | 0.6 |
| 3-beta-hydroxysteroid dehydrogenase/delta 5-->4-isomerase type II | 5.11 | 5.2142866617428 | 3 | 0.66666666666667 |
| Stearoyl-CoA desaturase 5 | 5.1087495488051 | 5.0084684640912 | 22 | 0.59090909090909 |
| Mycophenolic acid acyl-glucuronide esterase- mitochondrial | 6.5894803471865 | 5.1853677738462 | 11 | 0.72727272727273 |
| Ubiquitin carboxyl-terminal hydrolase 14 | 5.3666666666667 | 4.5365905041771 | 3 | 0.66666666666667 |
| Abhydrolase domain-containing protein 11 | 7.4424594715762 | 5.2385764758677 | 10 | 0.6 |
| Platelet-activating factor acetylhydrolase 2- cytoplasmic | 5.9778959703657 | 5.0141494065505 | 7 | 0.57142857142857 |
| Matrix metalloproteinase-20 | 5.8855695829046 | 5.3406983855877 | 7 | 0.85714285714286 |
| Neuropathy target esterase | 4.25 | 5.4859952422297 | 4 | 0.75 |
| S-formylglutathione hydrolase | 4.25 | 5.4859952422297 | 4 | 0.75 |
| Calcium-independent phospholipase A2-gamma | 4.25 | 5.4859952422297 | 4 | 0.75 |
| Retinoid-inducible serine carboxypeptidase | 4.25 | 5.4859952422297 | 4 | 0.75 |
| Lysophospholipase-like protein 1 | 4.25 | 5.4859952422297 | 4 | 0.75 |
| Alpha/beta hydrolase domain-containing protein 11 | 6.1421590589603 | 5.1245459704259 | 4 | 0.75 |
| Acyl-coenzyme A thioesterase 2- mitochondrial | 4.25 | 5.4859952422297 | 4 | 0.75 |
| Acyl-coenzyme A thioesterase 1 | 4.25 | 5.4859952422297 | 4 | 0.75 |
| Lysosomal thioesterase PPT2 | 4.25 | 5.4859952422297 | 4 | 0.75 |
| Pantothenate kinase 1 | 5.2073897022681 | 5.0164614254804 | 31 | 0.64516129032258 |
| Pantothenate kinase 3 | 5.0947261338679 | 4.9362968907243 | 41 | 0.53658536585366 |
| EZH2/SUZ12/EED/RBBP7/RBBP4 | 7.66 | 5.6524222632749 | 55 | 0.8 |
| Transcription initiation factor TFIID subunit 1 | 4.8055555555556 | 5.0221971276506 | 9 | 0.66666666666667 |
| Inositol phosphorylceramide synthase | 7.3766666666667 | 4.7503729095762 | 12 | 0.58333333333333 |
| Coagulation factor X/antithrombin III | 4.5842886851813 | 5.8520129802265 | 52 | 0.96153846153846 |
| ERO1-like protein alpha | 4.6105480203761 | 4.8882051852797 | 12 | 0.58333333333333 |
| Tyrosine-protein phosphatase non-receptor type 22 | 4.7908545398158 | 5.1878379057839 | 10 | 0.8 |
| Protein VAC14 homolog | 4.94 | 5.1022036726267 | 3 | 0.66666666666667 |
| High affinity cGMP-specific 3'-5'-cyclic phosphodiesterase 9A | 8.1013 | 5.6834014741588 | 100 | 0.8 |
| Receptor-type tyrosine-protein phosphatase S | 5.2605220190448 | 5.0539421045412 | 26 | 0.57692307692308 |
| PI3K p110 beta/p85 alpha | 6.7516678401512 | 5.383817355816 | 44 | 0.72727272727273 |
| Sodium channel protein type 8 subunit alpha | 4.6801394794248 | 5.3381377491302 | 7 | 0.71428571428571 |
| Appetite-regulating hormone | 7.0941068748776 | 5.333369916703 | 74 | 0.67567567567568 |
| Collagenase 3 | 8.1055670103093 | 5.2852699345447 | 97 | 0.69072164948454 |
| Proteasome subunit beta type-9 | 5.4363414634146 | 4.9952336804744 | 41 | 0.53658536585366 |
| Nuclear receptor subfamily 1 group D member 2 | 5.2292307692308 | 4.8656214759825 | 13 | 0.61538461538461 |
| Protein-arginine deiminase type-6 | 5.0863233347787 | 5.0538197371082 | 6 | 0.66666666666667 |
| Ubiquitin carboxyl-terminal hydrolase 4 | 5.2733333333333 | 5.1820674393868 | 3 | 0.66666666666667 |
| Amylin receptor AMY1- CALCR/RAMP1 | 9.19 | 5.4690309706589 | 2 | 1 |
| Amylin receptor AMY3; CALCR/RAMP3 | 5.96 | 5.7512106817086 | 2 | 1 |
| Adrenomedullin receptor- AM2; CALCRL/RAMP3 | 6.23 | 5.6094535984695 | 2 | 1 |
| Proto-oncogene tyrosine-protein kinase receptor Ret | 6.18 | 5.3227622665913 | 6 | 0.66666666666667 |
| Mitogen-activated protein kinase 9 | 5.425 | 5.4293854198784 | 6 | 0.83333333333333 |
| Tyrosine-protein kinase Fgr | 5.314 | 5.6257099129115 | 5 | 1 |
| Cytoplasmic tyrosine-protein kinase BMX | 5.2116666666667 | 5.3674472950486 | 6 | 0.83333333333333 |
| Protein-glutamine gamma-glutamyltransferase 2 | 6.7566666666667 | 5.2830731309472 | 3 | 1 |
| ATP-sensitive inward rectifier potassium channel 10 | 5 | 5.4298809687925 | 5 | 0.6 |
| Inward rectifier potassium channel 13 | 5 | 5.4298809687925 | 5 | 0.6 |
| DNA topoisomerase 4 subunit B | 6.49375 | 5.6573804588162 | 8 | 1 |
| Presenilin 2 | 8.255 | 5.4228864774808 | 8 | 0.625 |
| Transcription initiation factor TFIID subunit 1-like | 5.7633333333333 | 5.687167206664 | 3 | 1 |
| E3 ubiquitin-protein ligase TRIM33 | 4.8 | 5.4650021711324 | 2 | 1 |
| Bromodomain and WD repeat-containing protein 1 | 4.5 | 5.4650021711324 | 2 | 1 |
| Phosphodiesterase | 9.8230599886388 | 5.616643663645 | 31 | 0.80645161290323 |
| Complement factor D | 6.824793814433 | 5.2579000934582 | 776 | 0.63659793814433 |
| Signal transducer and transcription activator 6 | 4.3955555555556 | 5.6551727233026 | 9 | 0.77777777777778 |
| EZH1/SUZ12/EED/AEBP2/RBBP4 complex | 5.305 | 4.8388892371782 | 20 | 0.75 |
| NADH-ubiquinone oxidoreductase chain 3 | 5.0239536889925 | 5.1720915316958 | 9 | 0.55555555555556 |
| NADH-ubiquinone oxidoreductase chain 2 | 5.6401018624329 | 5.6090377036492 | 9 | 0.77777777777778 |
| C-C chemokine receptor-like 2 | 6.8903209086967 | 5.1217548111119 | 176 | 0.68181818181818 |
| Alpha-1-6-mannosyl-glycoprotein 2-beta-N-acetylglucosaminyltransferase | 6.9788521554658 | 4.9719587137755 | 67 | 0.53731343283582 |
| DNMT3A2/3L complex | 4.4171428571429 | 4.9143338037472 | 21 | 0.71428571428571 |
| Beta-1-4-mannosyl-glycoprotein 4-beta-N-acetylglucosaminyltransferase | 6.5891251208155 | 5.6369826414321 | 31 | 0.87096774193548 |
| Alpha-1-3-mannosyl-glycoprotein 2-beta-N-acetylglucosaminyltransferase | 6.173104445408 | 5.212964223201 | 9 | 0.66666666666667 |
| Toll-like receptor 4/MD-2 | 4.9032258064516 | 5.4917151595019 | 62 | 0.98387096774194 |
| Muscle glycogen synthase | 6.3720048371326 | 5.298839983388 | 110 | 0.66363636363636 |
| Nicotinic acetylcholine receptor alpha9/alpha10 | 5.7881395680707 | 6.0122787882111 | 10 | 0.8 |
| TAK1/TAB1 | 5.9889230967912 | 5.2209226285008 | 174 | 0.62068965517241 |
| CDK2/CDK4 | 5 | 7.2719444444444 | 12 | 1 |
| AMPK alpha1/beta2/gamma1 | 5 | 5.377626183921 | 3 | 1 |
| AMPK alpha1/beta1/gamma3 | 5 | 5.377626183921 | 3 | 1 |
| AMPK alpha1/beta1/gamma2 | 5 | 5.377626183921 | 3 | 1 |
| G protein-activated inward rectifier potassium channel 2 | 2 | 4.8297566943692 | 12 | 0.66666666666667 |
| AMPK alpha1/alpha2 | 4.7515333198674 | 5.4774045809888 | 24 | 0.91666666666667 |
| PI4KA/PI4KAP2 | 4.7897388884781 | 5.4959031485647 | 24 | 0.91666666666667 |
| p38 delta/gamma | 4.7790575417823 | 5.7891620007593 | 24 | 0.91666666666667 |
| Casein kinase I delta/epsilon | 4.9397194536922 | 5.4699049781188 | 24 | 0.83333333333333 |
| IKK epsilon/TBK1 | 4.7369126712735 | 5.4774045809888 | 24 | 0.91666666666667 |
| MAST1/MAST2 | 5.386775435553 | 5.6415962242618 | 8 | 1 |
| Ionotropic glutamate receptor NMDA 1/2C | 4.4851669158417 | 5.3079061900535 | 4 | 1 |
| Nucleosome-remodeling factor subunit BPTF | 5.5931836928739 | 4.8117905197446 | 6 | 0.66666666666667 |
| Bromodomain-containing protein 7 | 5.4515546541783 | 4.944925360041 | 6 | 0.66666666666667 |
| BirA bifunctional protein | 9.6795880017344 | 4.8768172051304 | 5 | 0.6 |
| Nicotinic acetylcholine receptor alpha6/alpha3/beta4 | 7.3425 | 6.6690655273722 | 12 | 1 |
| Glucokinase | 5.6894542819977 | 5.6239404707639 | 70 | 0.88571428571429 |
| Carboxylesterase 1D | 6.3566666666667 | 5.0270078560001 | 6 | 0.66666666666667 |
| c-Myc/Max | 4.4066666666667 | 5.3055357816933 | 6 | 0.66666666666667 |
| Glutamyl-tRNA(Gln) amidotransferase subunit A- mitochondrial | 5 | 5.9522529155655 | 3 | 1 |
| Dipeptidyl peptidase 2 | 5 | 5.9522529155655 | 3 | 1 |
| Rhomboid-related protein 4 | 5 | 5.9522529155655 | 3 | 1 |
| Marginal zone B- and B1-cell-specific protein | 5 | 5.7886144989147 | 3 | 1 |
| Phospholipase DDHD2 | 5 | 5.9522529155655 | 3 | 1 |
| Patatin-like phospholipase domain-containing protein 7 | 5 | 5.9522529155655 | 3 | 1 |
| Serine hydrolase-like protein | 5 | 5.9522529155655 | 3 | 1 |
| Presenilins-associated rhomboid-like protein- mitochondrial | 5 | 5.9522529155655 | 3 | 1 |
| Platelet-activating factor acetylhydrolase IB subunit beta | 5 | 5.9522529155655 | 3 | 1 |
| Dipeptidyl peptidase 9 | 5 | 5.9522529155655 | 3 | 1 |
| Lon protease homolog- mitochondrial | 5 | 5.9522529155655 | 3 | 1 |
| Alpha/beta hydrolase domain-containing protein 13 | 5 | 5.9522529155655 | 3 | 1 |
| Serine beta-lactamase-like protein LACTB- mitochondrial | 5 | 5.9522529155655 | 3 | 1 |
| 85/88 kDa calcium-independent phospholipase A2 | 5 | 5.9522529155655 | 3 | 1 |
| GPI inositol-deacylase | 5 | 5.9522529155655 | 3 | 1 |
| Phospholipase DDHD1 | 5 | 5.9522529155655 | 3 | 1 |
| Serine protease HTRA2- mitochondrial | 5 | 5.9522529155655 | 3 | 1 |
| 1-acylglycerol-3-phosphate O-acyltransferase ABHD5 | 5 | 5.9522529155655 | 3 | 1 |
| Platelet-activating factor acetylhydrolase IB subunit gamma | 5 | 5.9522529155655 | 3 | 1 |
| Group XV phospholipase A2 | 5 | 5.9522529155655 | 3 | 1 |
| Ribosomal protein S6 kinase alpha-2 | 4.9224670391247 | 4.9275307978076 | 27 | 0.62962962962963 |
| Polymerase basic protein 2 | 7.1588626672448 | 4.9450762547357 | 30 | 0.53333333333333 |
| Peptidase 1 | 7.7658146534022 | 5.1734844810096 | 51 | 0.58823529411765 |
| Neurogenic locus notch homolog protein 3 | 8.0295 | 4.8169490448885 | 20 | 0.55 |
| Glycerol-3-phosphate acyltransferase 1- mitochondrial | 4.6157894736842 | 4.715636422339 | 38 | 0.52631578947368 |
| ATPase family AAA domain-containing protein 2B | 6.4666666666667 | 5.7963014848849 | 3 | 0.66666666666667 |
| Amiloride-sensitive sodium channel subunit alpha | 7.8716666666667 | 4.8309867601618 | 6 | 0.66666666666667 |
| Sterol regulatory element-binding protein 1 | 5 | 5.37730587827 | 3 | 1 |
| 5-hydroxytryptamine receptor | 9.0969811320755 | 5.1250045417466 | 53 | 0.60377358490566 |
| Kininogen-1 | 8.0662903225807 | 6.0013280808748 | 124 | 0.83064516129032 |
| Acetyl-coenzyme A transporter 1 | 8.7094701986755 | 5.2463583945705 | 151 | 0.68874172185431 |
| Serine/threonine-protein kinase pim-3 | 7.7677941176471 | 5.1351240408917 | 136 | 0.57352941176471 |
| Aurora kinase B/Inner centromere protein | 8.0409090909091 | 5.1820640577436 | 22 | 0.54545454545454 |
| PI3-kinase class I | 6.3521212121212 | 5.3757416305446 | 3432 | 0.69755244755245 |
| DGAT1 protein | 6.6553333333333 | 5.1888065776827 | 15 | 0.66666666666667 |
| Aurora kinase B-B | 8.395 | 6.0166068343889 | 6 | 1 |
| Gamma-secretase-activating protein | 8.96 | 5.8791077107816 | 2 | 1 |