 Target Selection Process

The focus of this section is set on the molecular targets where the active molecules against BrCa models in the ChEMBL database have significant impact. We will tackle the question from the empirical point of view (i.e the ChEMBL recorded impact) and the predictive analysis, where predictions from machine learning algorithms will be used for target ID. Results will be further compared to determine whether the predictive analysis in the whole dataset affords any novelty upon the empirical annotations. Targets involved in killing particular BrCa cell lines will also be determined by hyerarchical clustering.
BRCA2 protein. By Filip em – self created from PDB entry with KiNG tool http://www.rcsb.org/pdb/cgi/explore.cgi?pdbId=1n0w, CC BY 2.0, https://commons.wikimedia.org/w/index.php?curid=3237307
Global Identification Process
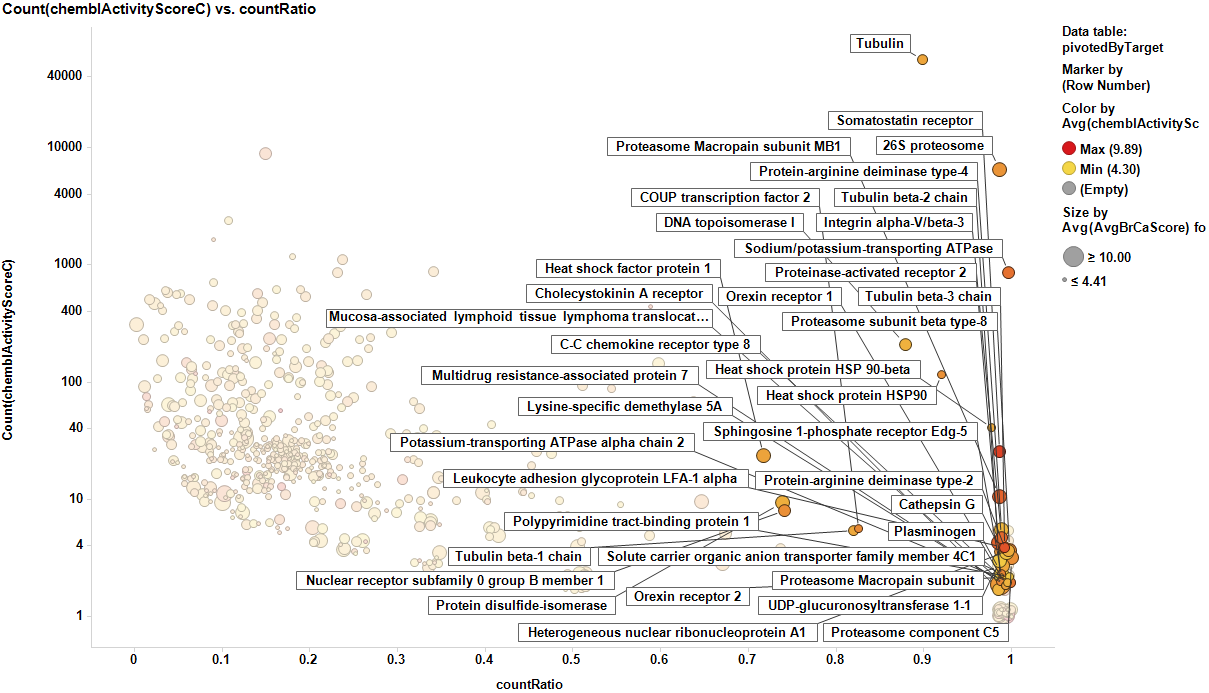
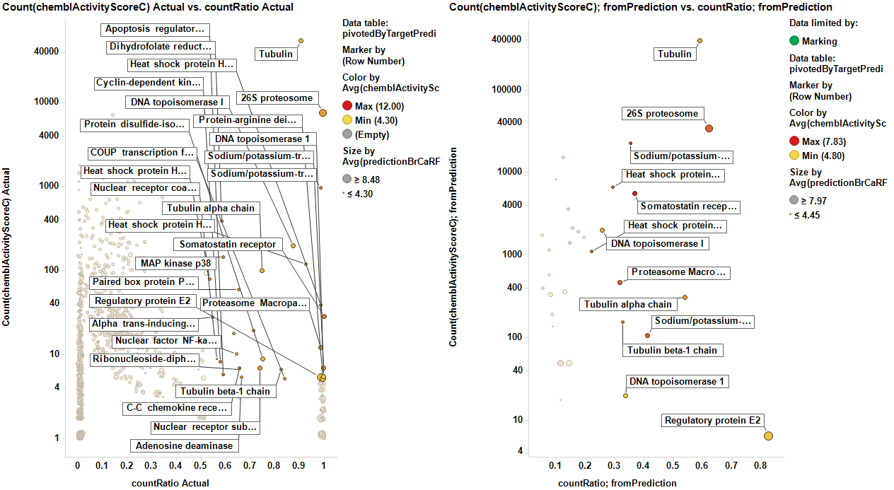
The target identification process is initiated with compounds screened in breast cancer phenotypic assays. The results from such compounds in molecular target based assays are identified, and those with an active ChEMBL score are selected and pivoted to yield unique raw data by target. Each row, will contain, the actual ratio between the number of events per active target in all BrCa assays and the total count of events per target (countRatio). CountRatio is equivalent to the proportion of times that molecules with a positive hit on a particular protein activates BrCa as well. If always = 1, if never =0. This parameter is associated in the chart below with the total number of events per target (count(chemblActivityScore)) as a measure of confidence. Average potencies per target in Non BrCa molecular assays (Avg(chemblActivityScore)), and BrCa assays (Avg(BrCaScore)) are depicted as color and size gradients, respectively. As an example, targets with countRatio >0.65 and total events >1 are marked in the chart. This is: targets where >65% of molecular events with a positive chemblActivityScore also have active events in BrCa phenotypic assays, and results in the identification of 61 putative BrCa targets.
This selection is carried out on database with 170k events on molecular assays, but given that there are predictions from BrCa prediction of activity section, these could be used to look at potential targets among 13M events, the entire database content. In this particular case, the random forest regression output will be used as an indicator of BrCaScore. With this target dataset, by using predictions, we increment the chances of identifying unforeseen targets.
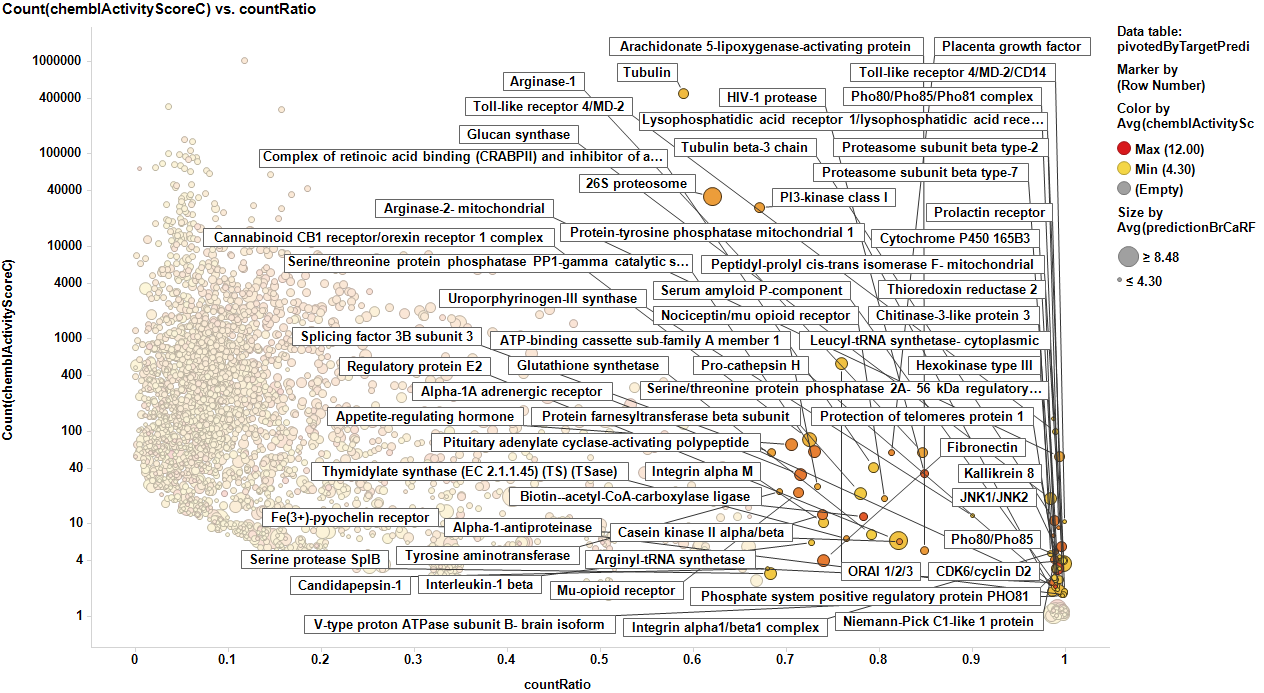
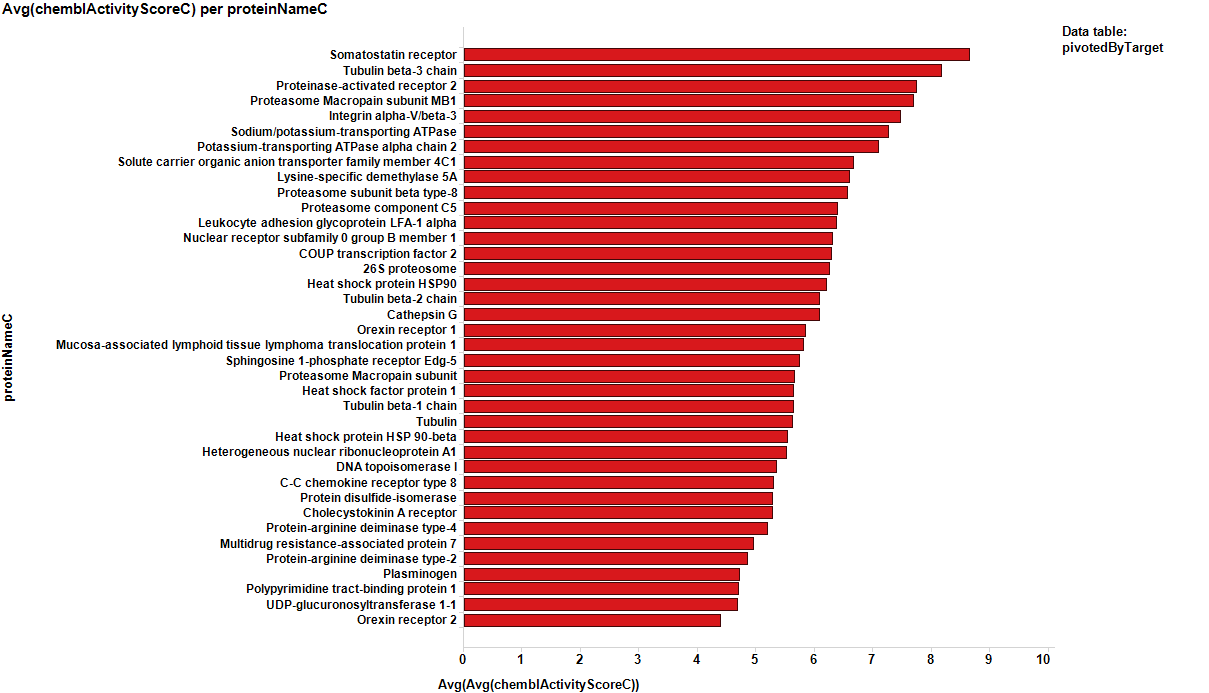
It appears that some of the targets identified from the actual data are present in the plot from predicted data, but few of the targets from the prediction are in the BrCa compound dataset. Below results are plotted in bar charts, sorted by potency.
From actual data…
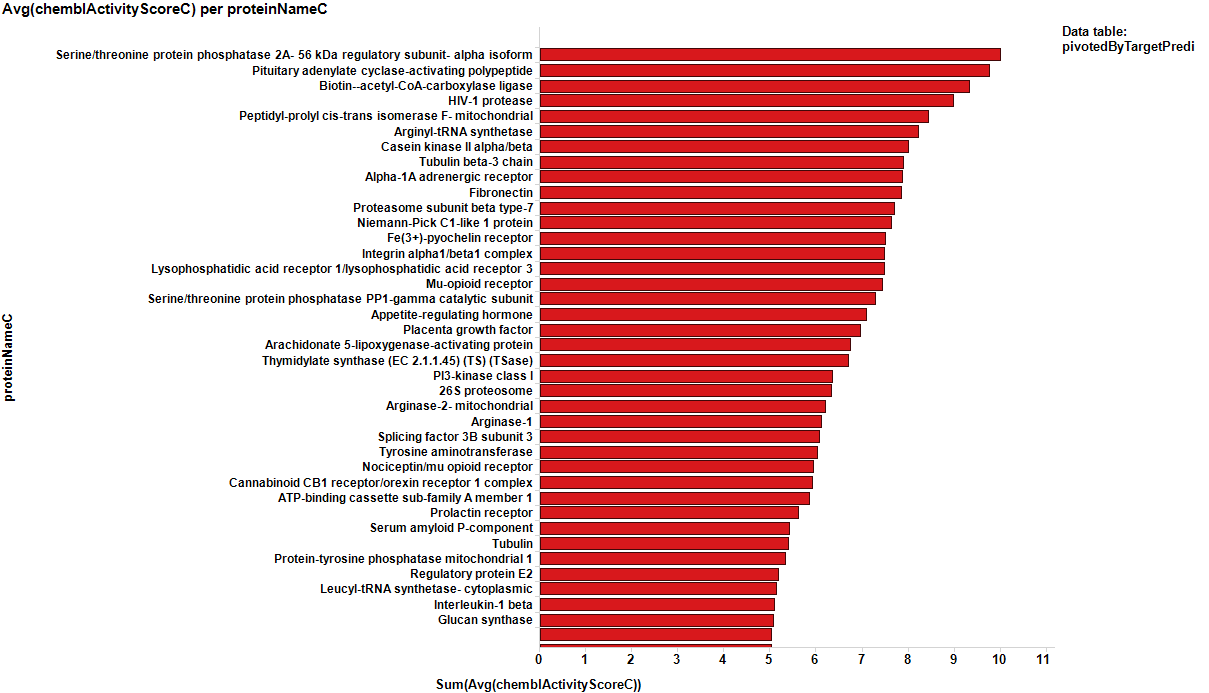
From predicted data…
Little dashboard where targets marked on the left graph (actual) are displayed on the right one (prediction). Although most of the targets are also identified in in the right chart, there is an evident shift to lower countRatio values.
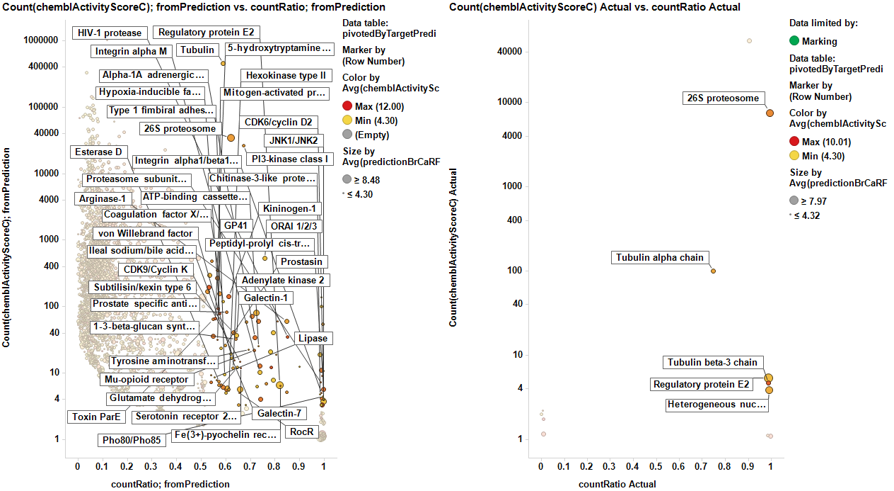
In this second dashboard, targets identified from predicted BrCa score are in the left, and marking them we make them to be displayed in the right plot. Just the two more frequent appear in the plot of actual targets. Should we trust on the value of prediction?
| proteinName | Avg(chemblScore) | countRatio | Organism(s) | Events | Ref |
|---|---|---|---|---|---|
| Serine/threonine protein phosphatase 2A- 56 kDa regulatory subunit- alpha isoform | 10.013333 | 1 | Homo sapiens | 3 | https://www.ncbi.nlm.nih.gov/pubmed/14534748 |
| Pituitary adenylate cyclase-activating polypeptide | 9.76 | 1 | Homo sapiens | 2 | http://cancerres.aacrjournals.org/content/canres/56/15/3486.full.pdf |
| Biotin--acetyl-CoA-carboxylase ligase | 9.329 | 0.76923076923077 | Mycobacterium tuberculosis (strain ATCC 25618 / H37Rv) | 13 | https://www.nature.com/articles/1205915.pdf?origin=ppub |
| HIV-1 protease | 8.975 | 0.86363636363636 | Human immunodeficiency virus | 44 | https://www.ncbi.nlm.nih.gov/pmc/articles/PMC2682221/ |
| Peptidyl-prolyl cis-trans isomerase F- mitochondrial | 8.43 | 1 | Homo sapiens | 5 | https://www.ncbi.nlm.nih.gov/pmc/articles/PMC2912272/ |
| Serotonin receptor 2a and 2b (5HT2A and 5HT2B) | 8.29 | 0.66666666666667 | Rattus norvegicus | 12 | http://ar.iiarjournals.org/content/33/2/363.full |
| Arginyl-tRNA synthetase | 8.235 | 1 | Homo sapiens | 2 | http://journals.plos.org/plosone/article?id=10.1371/journal.pone.0040960 |
| Hypoxia-inducible factor prolyl hydroxylase 1 | 8.07 | 0.56626506024096 | Homo sapiens | 83 | https://www.ncbi.nlm.nih.gov/pubmed/28038470 |
| Kininogen-1 | 8.06 | 0.62096774193548 | Homo sapiens | 124 | https://www.ncbi.nlm.nih.gov/pubmed/27324523 |
| Casein kinase II alpha/beta | 8 | 0.75 | Homo sapiens | 16 | https://www.ncbi.nlm.nih.gov/pmc/articles/PMC2916697/ |
| Tubulin beta-3 chain | 7.90 | 1 | Homo sapiens | 9 | https://www.ncbi.nlm.nih.gov/pubmed/17285590 |
| Alpha-1A adrenergic receptor | 7.87 | 0.71428571428571 | Cavia porcellus, Sus scrofa | 28 | https://www.nature.com/articles/4500561 |
| Fibronectin | 7.8 | 0.75 | Homo sapiens | 4 | https://www.ncbi.nlm.nih.gov/pubmed/24117661 |
| Ileal sodium/bile acid cotransporter | 7.85 | 0.64285714285714 | Mus musculus, Rattus norvegicus | 14 | http://cebp.aacrjournals.org/content/10/9/931 |
| Proteasome subunit beta type-7 | 7.69 | 1 | Homo sapiens | 8 | https://www.ncbi.nlm.nih.gov/pmc/articles/PMC2816652/ |
| Niemann-Pick C1-like 1 protein | 7.6 | 1 | Canis lupus familiaris, Macaca mulatta | 4 | http://www.sciencedirect.com/science/article/pii/S0002944010609601 |
| Cytochrome b-245 light chain | 7.568 | 0.6 | Bos taurus | 5 | |
| Fe(3+)-pyochelin receptor | 7.498 | 0.83333333333333 | Pseudomonas aeruginosa (strain ATCC 15692 / PAO1 / 1C / PRS 101 / LMG12228) | 6 | |
| Integrin alpha1/beta1 complex | 7.48 | 1 | Homo sapiens | 4 | https://www.nature.com/articles/1204554 |
| Lysophosphatidic acid receptor 1/lysophosphatidic acid receptor 3 | 7.48 | 1 | Rattus norvegicus | 8 | http://cancerres.aacrjournals.org/content/69/13/5441.short |
| Bis(5'-adenosyl)-triphosphatase (FHIT) | 7.46 | 0.6 | Homo sapiens | 5 | http://cancerres.aacrjournals.org/content/63/6/1183.short |
| Mu-opioid receptor | 7.44 | 0.7 | Cavia porcellus | 20 | http://onlinelibrary.wiley.com/doi/10.1002/(SICI)1097-4644(19990501)73:2%3C204::AID-JCB6%3E3.0.CO;2-V/full |
| Serine/threonine protein phosphatase PP1-gamma catalytic subunit | 7.296 | 0.74 | Homo sapiens | 50 | http://cancerres.aacrjournals.org/content/63/22/7777.short |
| Subtilisin/kexin type 6 | 7.28 | 0.62790697674419 | Homo sapiens | 43 | https://link.springer.com/article/10.1007/s13277-012-0630-x |
| CDK9/Cyclin K | 7.127 | 0.66666666666667 | Homo sapiens | 12 | https://www.ncbi.nlm.nih.gov/pmc/articles/PMC5636177/ |
| Appetite-regulating hormone | 7.094 | 0.7027027027027 | Homo sapiens | 74 | https://www.ncbi.nlm.nih.gov/pmc/articles/PMC5220482/ |
| Prostate specific antigen | 7.050 | 0.59493670886076 | Homo sapiens | 79 | https://www.ncbi.nlm.nih.gov/pmc/articles/PMC2033864/ |
| Toxin ParE | 7.041 | 0.56140350877193 | Escherichia coli | 57 | |
| Placenta growth factor | 6.95 | 0.82539682539683 | Homo sapiens, Mus musculus | 63 | http://www.sciencedirect.com/science/article/pii/S0959804905007938 |
| Glucose-6-phosphate translocase | 6.75 | 0.57142857142857 | Homo sapiens | 7 | https://www.ncbi.nlm.nih.gov/pubmed/19894109/ |
| Arachidonate 5-lipoxygenase-activating protein | 6.748 | 0.83333333333333 | Mus musculus, Rattus norvegicus | 6 | https://academic.oup.com/abbs/article/45/9/709/1146 |
| Prostasin | 6.70782 | 0.60869565217391 | Homo sapiens | 23 | http://onlinelibrary.wiley.com/doi/10.1002/ijc.1601/full |
| Thymidylate synthase (EC 2.1.1.45) (TS) (TSase) | 6.701 | 0.75 | Escherichia coli | 8 | https://www.researchgate.net/publication/313662677_TYMS_Dysregulation_is_a_Molecular_Switch_and_Tumorigenic_Driver_in_Early_Breast_Cancer |
| Secreted frizzled-related protein 1 | 6.64 | 0.59162303664922 | Homo sapiens, Mus musculus, Rattus norvegicus | 191 | https://www.ncbi.nlm.nih.gov/pmc/articles/PMC5316967/ |
| 1-3-beta-glucan synthase component GLS2 | 6.635 | 0.6551724137931 | Saccharomyces cerevisiae S288c | 29 | https://www.ncbi.nlm.nih.gov/pmc/articles/PMC3977804/ |
| GP41 | 6.562 | 0.575 | Human immunodeficiency virus 1 | 40 | |
| Plasmepsin IV | 6.36 | 0.66666666666667 | Plasmodium falciparum 3D7 | 3 | |
| PI3-kinase class I | 6.3 | 0.65675990675991 | Homo sapiens | 27456 | https://www.ncbi.nlm.nih.gov/pmc/articles/PMC5237710/ |
| Esterase D | 6.332 | 0.57142857142857 | Sus scrofa | 7 | https://www.ncbi.nlm.nih.gov/pmc/articles/PMC386498/ |
| 26S proteosome | 6.32 | 0.61596298438404 | Homo sapiens | 32851 | https://www.ncbi.nlm.nih.gov/pmc/articles/PMC3242858/ |
| Myelin transcription factor 1 | 6.28 | 0.57142857142857 | Homo sapiens | 7 | https://academic.oup.com/jnen/article/56/7/772/2610765 |
| Arginase-2- mitochondrial | 6.210 | 1 | Homo sapiens | 49 | https://www.ncbi.nlm.nih.gov/pmc/articles/PMC3818427/ |
| Arginase-1 | 6.1 | 0.84375 | Bos taurus, Homo sapiens, Rattus norvegicus | 64 | http://www.fasebj.org/content/31/1_Supplement/lb529.short |
| RocR | 6.121 | 0.66666666666667 | Pseudomonas aeruginosa (strain ATCC 15692 / PAO1 / 1C / PRS 101 / LMG12228) | 6 | Arginine utilization protein , as human arginases |
| Adenylate kinase 3 alpha like 1 | 6.083 | 0.6 | Rattus norvegicus | 5 | https://www.nature.com/articles/ncomms15308 |
| Splicing factor 3B subunit 3 | 6.0 | 0.691811320754717 | Homo sapiens | 53 | https://www.ncbi.nlm.nih.gov/pubmed/25431237 |
| Tyrosine aminotransferase | 6.03 | 0.7037037037037 | Homo sapiens, Rattus norvegicus | 27 | http://onlinelibrary.wiley.com/doi/10.1002/hep.23540/pdf |
| S-adenosylmethionine synthetase alpha and beta forms | 6.018 | 0.54545454545454 | Rattus norvegicus | 11 | https://link.springer.com/article/10.1007/BF01806157 |
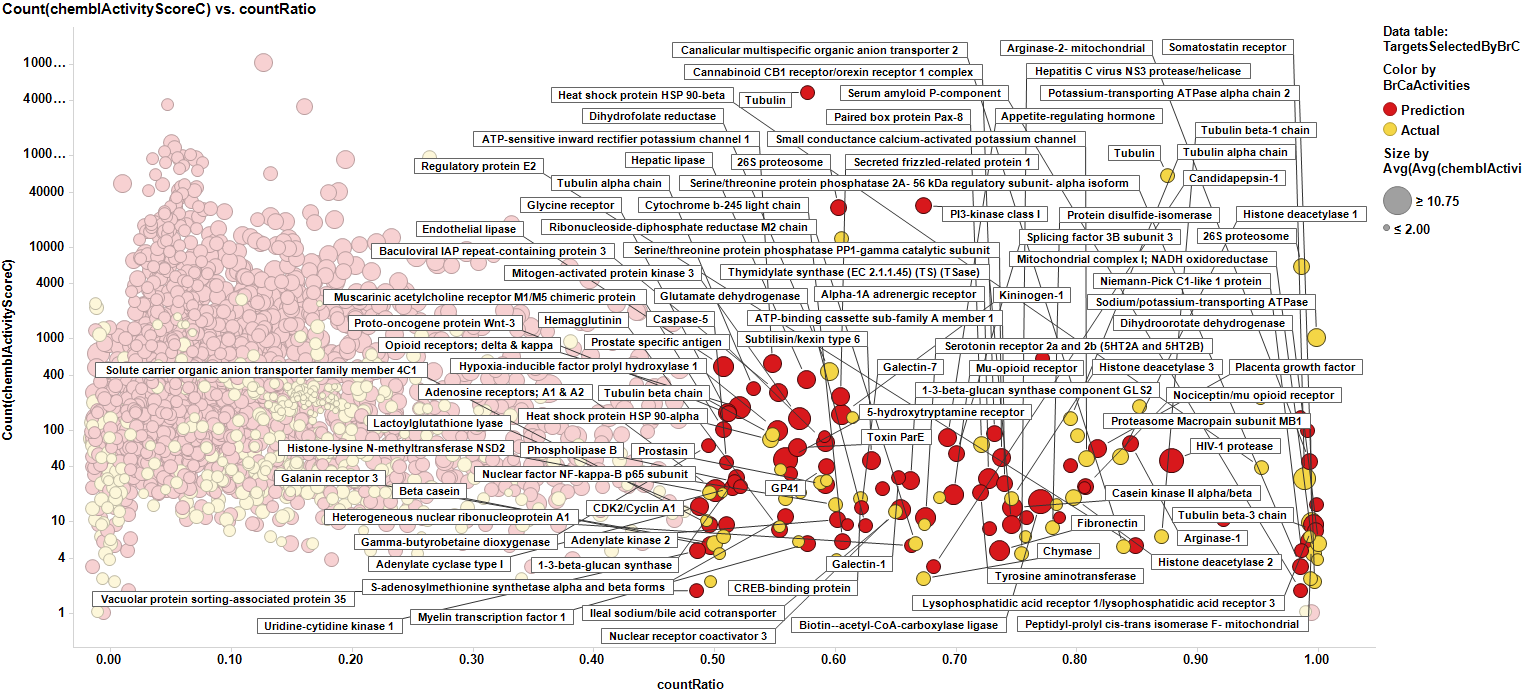
We can see how most of the predicted targets have a link to a literature reference that relates them to breast cancer biomarkers or therapies. Those that don’t, pertain to species other than human, i.e: E. coli, Pseudomonas, HIV virus or plasmodium. So the final target selection will include proteins selected by their actual and predicted scores of activity. The plot below shows the selection criterion for targets (>0.5 count ratio & > event of activity, predicted or actual).
Here, the corresponding bar charts for the average potencies and countRatios with the best values:
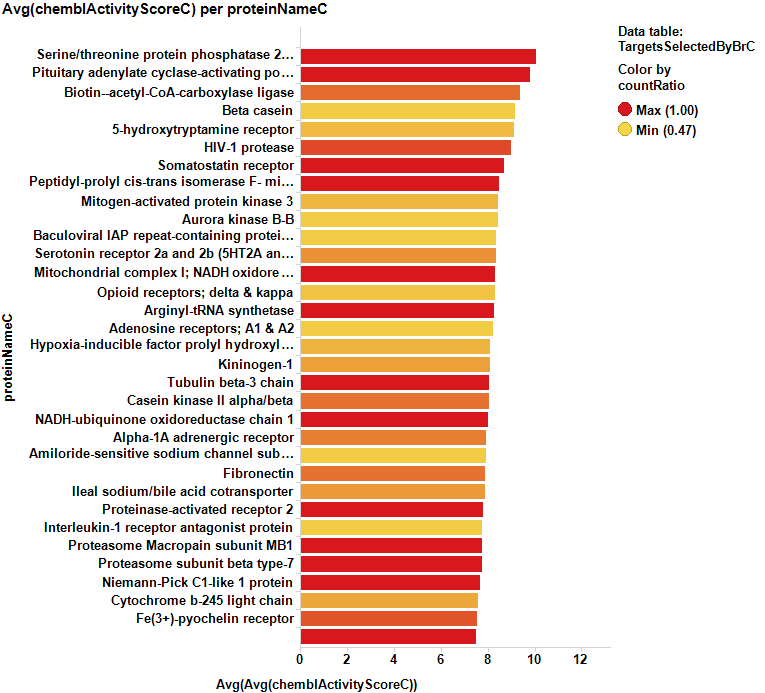
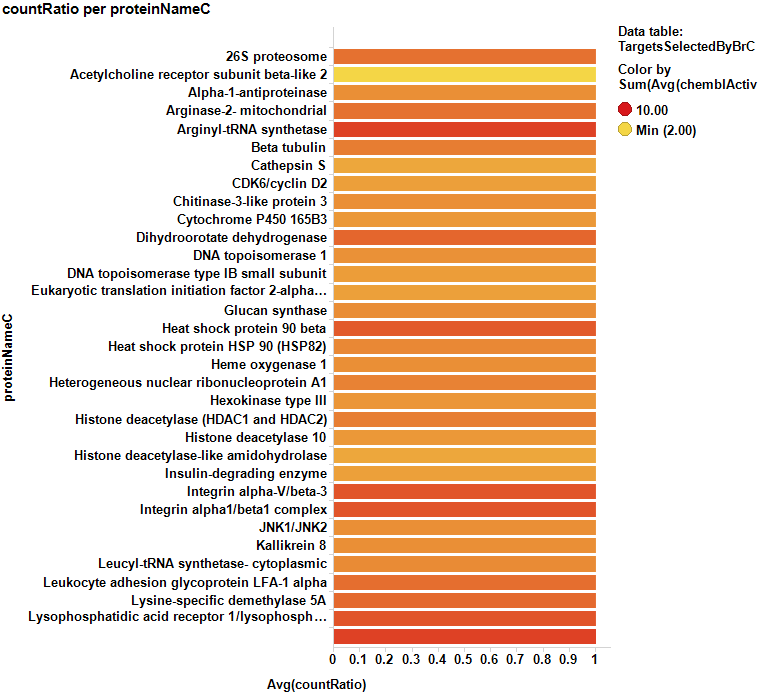
And here, the table with the corresponding values:
Targets identified from predicted and actual BrCa scores.
| proteinName | Avg(chemblScoreC) | Count(chemblScoreC) | countRatio | Organisms(s) | proteinClassDescription | BrCaActivities |
|---|---|---|---|---|---|---|
| CDK6/cyclin D2 | 4.301029995664 | 4 | 1 | Homo sapiens | cytosolic other, enzyme kinase protein kinase cmgc | Prediction |
| DNA topoisomerase type IB small subunit | 4.39 | 3 | 1 | Leishmania major | enzyme | Actual |
| DNA topoisomerase | 4.3948239965312 | 5 | 0.6 | Bos taurus, Yersinia pestis | enzyme | Actual |
| Orexin receptor 2 | 4.397940008672 | 2 | 1 | Homo sapiens | membrane receptor 7tm1 peptide short peptide orexin receptor | Actual |
| Histone deacetylase 5 | 4.4098528577623 | 7 | 0.57142857142857 | Homo sapiens | epigenetic regulator eraser hdac hdac class iia | Actual |
| Heat shock protein HSP90 | 4.4317861297169 | 208 | 0.94230769230769 | Homo sapiens | cytosolic other | Actual |
| Folylpoly-gamma-glutamate synthetase | 4.5006826451167 | 19 | 0.68421052631579 | Homo sapiens, Mus musculus | enzyme | Actual |
| MAP kinase p38 | 4.5705908707523 | 160 | 0.6 | Homo sapiens | enzyme kinase protein kinase cmgc mapk p38 | Actual |
| Type 1 fimbiral adhesin FimH | 4.613 | 10 | 0.6 | Escherichia coli (strain UTI89 / UPEC) | unclassified | Prediction |
| Cytochrome P450 165B3 | 4.615 | 2 | 1 | Amycolatopsis orientalis | enzyme | Prediction |
| Histone deacetylase 10 | 4.625 | 2 | 1 | Homo sapiens | epigenetic regulator eraser hdac hdac class iib | Actual |
| Phosphate system positive regulatory protein PHO81 | 4.665 | 4 | 1 | Saccharomyces cerevisiae S288c | unclassified | Prediction |
| Hexokinase type III | 4.6794003780613 | 3 | 1 | Rattus norvegicus | enzyme | Prediction |
| Hexokinase type II | 4.6853916994214 | 5 | 0.6 | Rattus norvegicus | enzyme | Prediction |
| Protection of telomeres protein 1 | 4.6933333333333 | 3 | 1 | Homo sapiens | unclassified | Prediction |
| Polypyrimidine tract-binding protein 1 | 4.7 | 2 | 1 | Homo sapiens | unclassified | Actual |
| Glutathione synthetase | 4.7170036145666 | 9 | 0.77777777777778 | Loa loa | unclassified | Prediction |
| Plasminogen | 4.7251640390659 | 2 | 1 | Homo sapiens | enzyme protease serine pas s1a | Actual |
| Protein farnesyltransferase beta subunit | 4.7415593203602 | 24 | 0.79166666666667 | Homo sapiens | enzyme | Prediction |
| Coagulation factor X/antithrombin III | 4.7996460756131 | 96 | 0.58333333333333 | Homo sapiens | enzyme protease serine pas s1a, secreted | Prediction |
| Alpha trans-inducing protein (VP16) | 4.8371659980844 | 34 | 0.58823529411765 | Herpes simplex virus (type 1 / strain 17) | nuclear other | Actual |
| Protein-arginine deiminase type-2 | 4.86 | 3 | 1 | Homo sapiens | enzyme | Actual |
| DNA topoisomerase 1 | 4.894481304126 | 5 | 1 | Chlorocebus aethiops, Saccharomyces cerevisiae S288c | enzyme | Actual |
| Histone deacetylase 8 | 4.9265463679975 | 13 | 0.76923076923077 | Homo sapiens | epigenetic regulator eraser hdac hdac class i | Actual |
| Pho80/Pho85/Pho81 complex | 4.9417647058824 | 153 | 1 | Saccharomyces cerevisiae S288c | enzyme kinase protein kinase cmgc cdk cdk5, unclassified | Prediction |
| Multidrug resistance-associated protein 7 | 4.9535565938864 | 2 | 1 | Homo sapiens | transporter ntpase atp binding cassette mrp | Actual |
| Adenosine deaminase | 4.9826503431423 | 7 | 0.57142857142857 | Bos taurus, Homo sapiens | enzyme, enzyme hydrolase | Actual |
| DNA topoisomerase I | 4.9861420070915 | 226 | 0.85398230088496 | Homo sapiens, Leishmania donovani donovani, Mus musculus | enzyme, enzyme isomerase, unclassified | Actual |
| DNA topoisomerase II | 4.9903630390779 | 101 | 0.8019801980198 | Drosophila melanogaster, Homo sapiens | enzyme, enzyme isomerase | Actual |
| Uroporphyrinogen-III synthase | 5 | 11 | 0.90909090909091 | Homo sapiens | enzyme | Prediction |
| Candidapepsin-1 | 5 | 3 | 0.66666666666667 | Candida albicans | enzyme protease aspartic aa a1a | Prediction |
| V-type proton ATPase subunit B- brain isoform | 5 | 2 | 1 | Homo sapiens | enzyme hydrolase, transporter ntpase f-type and v-type v-type atpase | Prediction |
| Complex of retinoic acid binding (CRABPII) and inhibitor of apoptosis (cIAP1) proteins | 5 | 36 | 0.77777777777778 | Homo sapiens | auxiliary transport protein fabp, enzyme | Prediction |
| Kallikrein 8 | 5 | 2 | 1 | Homo sapiens | enzyme protease serine pas s1a | Prediction |
| Thioredoxin reductase 2 | 5 | 2 | 1 | Homo sapiens | enzyme | Prediction |
| Pho80/Pho85 | 5 | 4 | 1 | Saccharomyces cerevisiae S288c | enzyme kinase protein kinase cmgc cdk cdk5, unclassified | Prediction |
| Chitinase-3-like protein 3 | 5 | 4 | 1 | Mus musculus | unclassified | Prediction |
| Alpha-1-antiproteinase | 5 | 2 | 1 | Mus caroli | unclassified | Prediction |
| Pro-cathepsin H | 5 | 2 | 1 | Mus musculus | enzyme | Prediction |
| Lipase | 5 | 9 | 0.55555555555556 | Thermomyces lanuginosus | enzyme | Prediction |
| Toll-like receptor 4/MD-2 | 5 | 120 | 1 | Homo sapiens | membrane receptor, surface antigen | Prediction |
| Toll-like receptor 4/MD-2/CD14 | 5 | 9 | 1 | Homo sapiens | membrane receptor, surface antigen | Prediction |
| Proteasome subunit beta type-2 | 5 | 2 | 1 | Mus musculus | enzyme | Prediction |
| JNK1/JNK2 | 5 | 4 | 1 | Mus musculus | enzyme | Prediction |
| Heme oxygenase 1 | 5 | 3 | 1 | Mus musculus | enzyme | Actual |
| Mitogen-activated protein kinase; ERK1/ERK2 | 5 | 8 | 0.5 | Homo sapiens | enzyme kinase protein kinase cmgc mapk erk | Actual |
| ORAI 1/2/3 | 5.0076190476191 | 567 | 0.76190476190476 | Homo sapiens | ion channel other misc crac-c | Prediction |
| Latent membrane protein 1 | 5.0106697555004 | 16 | 0.5625 | Human herpesvirus 4 (strain B95-8) | unclassified | Actual |
| Histone deacetylase | 5.0258640869132 | 10364 | 0.59108452335006 | Homo sapiens, Plasmodium falciparum, Rattus norvegicus | enzyme, epigenetic regulator eraser hdac hdac class i, epigenetic regulator eraser hdac hdac class iia, epigenetic regulator eraser hdac hdac class iib, epigenetic regulator eraser hdac hdac class iv | Actual |
| Serine protease SplB | 5.0333333333333 | 3 | 0.66666666666667 | Staphylococcus aureus | enzyme | Prediction |
| von Willebrand factor | 5.039188911175 | 22 | 0.63636363636364 | Homo sapiens | unclassified | Prediction |
| Integrin alpha M | 5.0441385047014 | 12 | 0.75 | Homo sapiens, Mus musculus | membrane receptor | Prediction |
| Heat shock factor protein 1 | 5.0550526765924 | 30 | 0.6 | Homo sapiens, Mus musculus | unclassified | Actual |
| Glyceraldehyde-3-phosphate dehydrogenase cytosolic | 5.0567857142857 | 28 | 0.57142857142857 | Leishmania mexicana | enzyme | Prediction |
| Scavenger receptor type A | 5.0694024163614 | 25 | 0.52 | Mus musculus | membrane receptor | Prediction |
| Glucan synthase | 5.0835447546725 | 19 | 1 | Candida albicans | enzyme | Prediction |
| Nuclear receptor subfamily 0 group B member 1 | 5.1003520615228 | 16 | 0.625 | Homo sapiens | transcription factor nuclear receptor nr0 nr0b nr0b1 | Actual |
| Uridine-cytidine kinase 1 | 5.1062460662311 | 5 | 0.6 | Mus musculus | enzyme | Actual |
| Interleukin-1 beta | 5.1071428571429 | 7 | 0.71428571428571 | Homo sapiens | secreted | Prediction |
| 3-beta-hydroxysteroid dehydrogenase/delta 5-->4-isomerase type II | 5.11 | 3 | 0.66666666666667 | Homo sapiens | enzyme reductase | Prediction |
| Glutamate dehydrogenase | 5.1192896051331 | 11 | 0.63636363636364 | Bos taurus | enzyme | Prediction |
| Leucyl-tRNA synthetase- cytoplasmic | 5.1475 | 4 | 1 | Saccharomyces cerevisiae S288c | enzyme | Prediction |
| Protein disulfide-isomerase | 5.1641638200317 | 9 | 0.77777777777778 | Homo sapiens | enzyme | Actual |
| Galectin-7 | 5.1875 | 16 | 0.625 | Homo sapiens | unclassified | Prediction |
| Hepatitis C virus NS3 protease/helicase | 5.1891675879833 | 4 | 0.75 | Hepatitis C virus | enzyme protease serine pas s29 | Actual |
| Mucosa-associated lymphoid tissue lymphoma translocation protein 1 | 5.2133333333333 | 3 | 0.66666666666667 | Homo sapiens | enzyme hydrolase | Actual |
| Tubulin beta chain | 5.2260369641905 | 103 | 0.55339805825243 | Bos taurus, Sus scrofa | structural | Actual |
| Protein Wnt-3a | 5.2666954896036 | 9 | 0.55555555555556 | Mus musculus | unclassified | Actual |
| Galectin-1 | 5.2686148439979 | 37 | 0.64864864864865 | Homo sapiens | cytosolic other | Prediction |
| Heat shock protein HSP 90 (HSP82) | 5.280686663776 | 3 | 1 | Saccharomyces cerevisiae S288c | cytosolic other | Actual |
| Hypoxanthine-guanine phosphoribosyltransferase | 5.320709495095 | 5 | 0.6 | Homo sapiens | enzyme | Actual |
| Ribonucleoside-diphosphate reductase M2 chain | 5.3751640971713 | 6 | 0.66666666666667 | Homo sapiens, Mus musculus | enzyme | Actual |
| Serum amyloid P-component | 5.4146456373043 | 2 | 1 | Homo sapiens | secreted | Prediction |
| Caspase-5 | 5.4219904501308 | 46 | 0.5 | Homo sapiens | enzyme protease cysteine cd c14 | Prediction |
| Tubulin beta-1 chain | 5.4485714285714 | 7 | 0.85714285714286 | Homo sapiens | structural | Actual |
| Nuclear factor NF-kappa-B p65 subunit | 5.4488205633045 | 12 | 0.58333333333333 | Homo sapiens | transcription factor | Actual |
| Tubulin | 5.4564145465435 | 61409 | 0.88350241821231 | Bos taurus, Homo sapiens, Sus scrofa | structural | Actual |
| Heat shock protein HSP 90-beta | 5.4607941389923 | 38 | 0.94736842105263 | Homo sapiens, Oryctolagus cuniculus | cytosolic other, unclassified | Actual |
| NADP-dependent leukotriene B4 12-hydroxydehydrogenase | 5.4658101982806 | 2 | 1 | Rattus norvegicus | enzyme | Actual |
| Heterogeneous nuclear ribonucleoprotein A1 | 5.52 | 4 | 1 | Homo sapiens | unclassified | Actual |
| Tubulin polymerization-promoting protein | 5.56 | 2 | 1 | Bos taurus | unclassified | Actual |
| Tubulin alpha chain | 5.5806842844431 | 115 | 0.80869565217391 | Sus scrofa | structural | Actual |
| Prolactin receptor | 5.61 | 2 | 1 | Homo sapiens | unclassified | Prediction |
| Proteasome Macropain subunit | 5.6533333333333 | 3 | 1 | Homo sapiens | enzyme protease threonine pbt t1a | Actual |
| Histone deacetylase (HDAC1 and HDAC2) | 5.7 | 4 | 1 | Homo sapiens | epigenetic regulator eraser hdac hdac class i | Actual |
| Sphingosine 1-phosphate receptor Edg-5 | 5.74 | 2 | 1 | Homo sapiens | membrane receptor 7tm1 smallmol lipid-like ligand receptor edg receptor | Actual |
| Histone deacetylase 3 | 5.7411602165932 | 16 | 0.75 | Homo sapiens | epigenetic regulator eraser hdac hdac class i | Actual |
| Beta tubulin | 5.755514997832 | 4 | 1 | Leishmania donovani | structural | Actual |
| G-protein coupled receptor 55 | 5.7833333333333 | 3 | 0.66666666666667 | Homo sapiens | membrane receptor 7tm1 smallmol lipid-like ligand receptor lysophosphatidylinositol receptor | Actual |
| Ras-related protein Rap-1A | 5.79 | 5 | 0.6 | Homo sapiens | unclassified | Prediction |
| Solute carrier organic anion transporter family member 1A3 | 5.8075027333876 | 3 | 1 | Rattus norvegicus | unclassified | Actual |
| CREB-binding protein | 5.81875 | 16 | 0.625 | Homo sapiens | epigenetic regulator reader brd, epigenetic regulator writer hat p300 cbp | Actual |
| Small conductance calcium-activated potassium channel protein 3 | 5.8366666666667 | 6 | 0.66666666666667 | Homo sapiens, Rattus norvegicus | ion channel vgc k ca act k | Actual |
| Orexin receptor 1 | 5.845 | 2 | 1 | Homo sapiens | membrane receptor 7tm1 peptide short peptide orexin receptor | Actual |
| Histone deacetylase 2 | 5.8451682435651 | 19 | 0.78947368421053 | Homo sapiens | epigenetic regulator eraser hdac hdac class i | Actual |
| ATP-binding cassette sub-family A member 1 | 5.8495454545455 | 22 | 0.72727272727273 | Mus musculus | unclassified | Prediction |
| Major capsid protein L1 | 5.8928571428571 | 7 | 0.57142857142857 | Human papillomavirus type 16, Human papillomavirus type 58 | unclassified | Prediction |
| Chymase | 5.8929178669843 | 3 | 0.66666666666667 | Homo sapiens | enzyme protease serine pas s1a | Actual |
| Small conductance calcium-activated potassium channel | 5.898 | 45 | 0.8 | Rattus norvegicus | ion channel vgc k ca act k | Actual |
| Adenylate kinase 2 | 5.9039390478148 | 13 | 0.61538461538461 | Rattus norvegicus | enzyme | Prediction |
| Heat shock protein HSP 90-alpha | 5.9333613952336 | 80 | 0.5625 | Homo sapiens | cytosolic other | Actual |
| Cannabinoid CB1 receptor/orexin receptor 1 complex | 5.9335384862971 | 72 | 0.72222222222222 | Homo sapiens | membrane receptor 7tm1 peptide short peptide orexin receptor, membrane receptor 7tm1 smallmol lipid-like ligand receptor cannabinoid receptor | Prediction |
| Muscarinic acetylcholine receptor M1/M5 chimeric protein | 5.9378755987636 | 104 | 0.5 | Homo sapiens | membrane receptor 7tm1 smallmol monoamine receptor acetylcholine receptor | Prediction |
| Nociceptin/mu opioid receptor | 5.95 | 20 | 0.8 | Rattus norvegicus | membrane receptor 7tm1 peptide short peptide opioid receptor | Prediction |
| Nuclear receptor coactivator 3 | 5.9765180062302 | 11 | 0.63636363636364 | Homo sapiens | epigenetic regulator writer hat src | Actual |
| Tyrosine aminotransferase | 6.0339980979378 | 27 | 0.7037037037037 | Homo sapiens, Rattus norvegicus | enzyme | Prediction |
| Paired box protein Pax-8 | 6.0378473568484 | 67 | 0.71641791044776 | Homo sapiens | unclassified | Actual |
| Splicing factor 3B subunit 3 | 6.0816268533896 | 53 | 0.69811320754717 | Homo sapiens | unclassified | Prediction |
| Adenylate kinase 3 alpha like 1 | 6.0830570290747 | 5 | 0.6 | Rattus norvegicus | enzyme | Prediction |
| Proto-oncogene protein Wnt-3 | 6.0884641394831 | 142 | 0.51408450704225 | Homo sapiens | unclassified | Prediction |
| Tubulin beta-2 chain | 6.0953992152989 | 2 | 1 | Homo sapiens | structural | Actual |
| RocR | 6.1216666666667 | 6 | 0.66666666666667 | Pseudomonas aeruginosa (strain ATCC 15692 / PAO1 / 1C / PRS 101 / LMG12228) | unclassified | Prediction |
| Arginase-1 | 6.126875 | 64 | 0.84375 | Bos taurus, Homo sapiens, Rattus norvegicus | enzyme | Prediction |
| Histone deacetylase 1 | 6.1430918371049 | 47 | 0.85106382978723 | Homo sapiens, Mus musculus, Rattus norvegicus | enzyme, epigenetic regulator eraser hdac hdac class i | Actual |
| Lactoylglutathione lyase | 6.166 | 10 | 0.5 | Saccharomyces cerevisiae S288c | enzyme | Prediction |
| Arginase-2- mitochondrial | 6.2108163265306 | 49 | 1 | Homo sapiens | enzyme | Prediction |
| 26S proteosome | 6.251 | 7220 | 1 | Homo sapiens | enzyme, enzyme protease threonine pbt t1a, unclassified | Actual |
| COUP transcription factor 2 | 6.2899520382677 | 6 | 0.83333333333333 | Homo sapiens | transcription factor nuclear receptor nr2 nr2f nr2f2 | Actual |
| Esterase D | 6.3326944535162 | 7 | 0.57142857142857 | Sus scrofa | enzyme | Prediction |
| PI3-kinase class I | 6.3521212121211 | 27456 | 0.65675990675991 | Homo sapiens | enzyme, unclassified | Prediction |
| Plasmepsin IV | 6.36 | 3 | 0.66666666666667 | Plasmodium falciparum 3D7 | unclassified | Prediction |
| CDK2/Cyclin A1 | 6.3750775913315 | 24 | 0.5 | Homo sapiens | cytosolic other, enzyme kinase protein kinase cmgc cdk cdc2 | Prediction |
| Leukocyte adhesion glycoprotein LFA-1 alpha | 6.38 | 4 | 1 | Homo sapiens | adhesion, membrane receptor | Actual |
| Proteasome component C5 | 6.39 | 3 | 1 | Homo sapiens | enzyme protease threonine pbt t1a | Actual |
| 1-3-beta-glucan synthase | 6.5116666666667 | 30 | 0.53333333333333 | Aspergillus, Candida, Candida glabrata | enzyme, enzyme transferase | Prediction |
| Proteasome subunit beta type-8 | 6.5736053031511 | 4 | 1 | Homo sapiens | enzyme protease threonine pbt t1a | Actual |
| Lysine-specific demethylase 5A | 6.6 | 2 | 1 | Homo sapiens | epigenetic regulator eraser kdm jumonji, epigenetic regulator reader phd | Actual |
| 1-3-beta-glucan synthase component GLS2 | 6.6358975860574 | 29 | 0.6551724137931 | Saccharomyces cerevisiae S288c | enzyme | Prediction |
| Secreted frizzled-related protein 1 | 6.6435264209437 | 191 | 0.59162303664922 | Homo sapiens, Mus musculus, Rattus norvegicus | unclassified | Prediction |
| Solute carrier organic anion transporter family member 4C1 | 6.6701082016916 | 2 | 1 | Homo sapiens | transporter electrochemical slc slc21 | Actual |
| ATP-sensitive inward rectifier potassium channel 1 | 6.6750850350628 | 454 | 0.53303964757709 | Homo sapiens, Rattus norvegicus | ion channel vgc k kir, unclassified | Prediction |
| Hemagglutinin | 6.6844444444444 | 9 | 0.55555555555556 | Influenza A virus (A/Puerto Rico/8/1934(H1N1)), Influenza A virus (strain A/Aichi/2/1968 H3N2) | unclassified | Prediction |
| Dihydroorotate dehydrogenase | 6.7025164854197 | 6 | 1 | Homo sapiens, Plasmodium falciparum, Saccharomyces cerevisiae S288c | enzyme, enzyme reductase | Actual |
| Prostasin | 6.7078260869565 | 23 | 0.60869565217391 | Homo sapiens | enzyme protease serine pas s1a | Prediction |
| Arachidonate 5-lipoxygenase-activating protein | 6.7483333333333 | 6 | 0.83333333333333 | Mus musculus, Rattus norvegicus | unclassified | Prediction |
| Glucose-6-phosphate translocase | 6.75 | 7 | 0.57142857142857 | Homo sapiens | transporter electrochemical slc slc37 | Prediction |
| Inositol phosphorylceramide synthase catalytic subunit AUR1 | 6.839 | 10 | 0.5 | Saccharomyces cerevisiae S288c | enzyme | Prediction |
| Sodium/potassium-transporting ATPase alpha-1 chain | 6.9 | 6 | 1 | Canis lupus familiaris | enzyme hydrolase, transporter ntpase p-type atpase na k atpase | Actual |
| Placenta growth factor | 6.9579365079365 | 63 | 0.82539682539683 | Homo sapiens, Mus musculus | unclassified | Prediction |
| Hepatic lipase | 6.9874946647681 | 358 | 0.5586592178771 | Homo sapiens | enzyme | Prediction |
| Toxin ParE | 7.0414035087719 | 57 | 0.56140350877193 | Escherichia coli | unclassified | Prediction |
| Dihydrofolate reductase | 7.0432602701642 | 488 | 0.5922131147541 | Bacillus anthracis, Bos taurus, Candida albicans, Enterococcus faecium, Escherichia coli, Gallus gallus, Homo sapiens, Lactobacillus casei, Leishmania major, Mus musculus, Plasmodium falciparum K1, Pneumocystis carinii, Rattus norvegicus, Staphylococcus aureus, Toxoplasma gondii | enzyme, enzyme reductase, unclassified | Actual |
| Prostate specific antigen | 7.0506517627305 | 79 | 0.59493670886076 | Homo sapiens | enzyme protease serine pas s1a | Prediction |
| Appetite-regulating hormone | 7.0941068748776 | 74 | 0.7027027027027 | Homo sapiens | unclassified | Prediction |
| Potassium-transporting ATPase alpha chain 2 | 7.1 | 2 | 1 | Homo sapiens | enzyme hydrolase, transporter ntpase p-type atpase h k atpase | Actual |
| CDK9/Cyclin K | 7.1273533304427 | 12 | 0.66666666666667 | Homo sapiens | enzyme kinase protein kinase cmgc cdk cdk9, unclassified | Prediction |
| Heat shock protein 90 beta | 7.21 | 2 | 1 | Canis lupus familiaris | membrane other | Actual |
| Baculoviral IAP repeat-containing protein 3 | 7.2205118171421 | 227 | 0.55066079295154 | Homo sapiens | enzyme | Prediction |
| Sodium/potassium-transporting ATPase | 7.265 | 960 | 1 | Homo sapiens | enzyme hydrolase, ion channel other plm, transporter ntpase p-type atpase na k atpase | Actual |
| Subtilisin/kexin type 6 | 7.2809302325581 | 43 | 0.62790697674419 | Homo sapiens | enzyme protease serine sb s8b | Prediction |
| Mu-opioid receptor | 7.44 | 20 | 0.7 | Cavia porcellus | membrane receptor 7tm1 peptide short peptide opioid receptor | Prediction |
| Bis(5'-adenosyl)-triphosphatase | 7.46 | 5 | 0.6 | Homo sapiens | enzyme | Prediction |
| Integrin alpha-V/beta-3 | 7.47 | 4 | 1 | Homo sapiens | membrane receptor | Actual |
| Endothelial lipase | 7.4705385855749 | 577 | 0.49046793760832 | Homo sapiens, Mus musculus, Rattus norvegicus | enzyme, enzyme hydrolase | Prediction |
| Integrin alpha1/beta1 complex | 7.48 | 4 | 1 | Homo sapiens | membrane receptor | Prediction |
| Lysophosphatidic acid receptor 1/lysophosphatidic acid receptor 3 | 7.48 | 8 | 1 | Rattus norvegicus | membrane receptor 7tm1 smallmol lipid-like ligand receptor edg receptor | Prediction |
| Fe(3+)-pyochelin receptor | 7.4983333333333 | 6 | 0.83333333333333 | Pseudomonas aeruginosa (strain ATCC 15692 / PAO1 / 1C / PRS 101 / LMG12228) | unclassified | Prediction |
| Niemann-Pick C1-like 1 protein | 7.635 | 4 | 1 | Canis lupus familiaris, Macaca mulatta | unclassified | Prediction |
| Proteasome subunit beta type-7 | 7.698970004336 | 8 | 1 | Homo sapiens | unclassified | Prediction |
| Proteasome Macropain subunit MB1 | 7.7030826128131 | 11 | 1 | Homo sapiens | enzyme protease threonine pbt t1a | Actual |
| Proteinase-activated receptor 2 | 7.745 | 4 | 1 | Homo sapiens | membrane receptor 7tm1 peptide protease-activated receptor, membrane receptor 7tm1 peptide protease-activated receptor protease-activated receptor | Actual |
| Ileal sodium/bile acid cotransporter | 7.8514732027989 | 14 | 0.64285714285714 | Mus musculus, Rattus norvegicus | unclassified | Prediction |
| Fibronectin | 7.8625 | 4 | 0.75 | Homo sapiens | adhesion | Prediction |
| Alpha-1A adrenergic receptor | 7.8765613696552 | 28 | 0.71428571428571 | Cavia porcellus, Sus scrofa | membrane receptor 7tm1 smallmol monoamine receptor adrenergic receptor | Prediction |
| NADH-ubiquinone oxidoreductase chain 1 | 7.975 | 2 | 1 | Bos taurus | enzyme | Actual |
| Casein kinase II alpha/beta | 8 | 16 | 0.75 | Homo sapiens | enzyme kinase protein kinase other ck2, enzyme kinase reg | Prediction |
| Kininogen-1 | 8.0662903225807 | 124 | 0.62096774193548 | Homo sapiens | unclassified | Prediction |
| Tubulin beta-3 chain | 8.1675 | 4 | 1 | Homo sapiens | structural | Actual |
| Arginyl-tRNA synthetase | 8.235 | 2 | 1 | Homo sapiens | enzyme | Prediction |
| Opioid receptors; delta & kappa | 8.2635661366593 | 176 | 0.52272727272727 | Homo sapiens | membrane receptor 7tm1 peptide short peptide opioid receptor | Prediction |
| Mitochondrial complex I; NADH oxidoreductase | 8.29 | 4 | 1 | Bos taurus | enzyme, unclassified | Actual |
| Serotonin receptor 2a and 2b (5HT2A and 5HT2B) | 8.2966666666667 | 12 | 0.66666666666667 | Rattus norvegicus | membrane receptor 7tm1 smallmol monoamine receptor serotonin receptor | Prediction |
| Peptidyl-prolyl cis-trans isomerase F- mitochondrial | 8.4323697499233 | 5 | 1 | Homo sapiens | unclassified | Prediction |
| Somatostatin receptor | 8.66 | 25 | 1 | Homo sapiens | membrane receptor 7tm1 peptide short peptide somatostatin receptor | Actual |
| HIV-1 protease | 8.975 | 44 | 0.86363636363636 | Human immunodeficiency virus | unclassified | Prediction |
| 5-hydroxytryptamine receptor | 9.0969811320755 | 53 | 0.54716981132076 | Cricetulus griseus | membrane receptor 7tm1 smallmol monoamine receptor serotonin receptor | Prediction |
| Biotin--acetyl-CoA-carboxylase ligase | 9.3292307692308 | 13 | 0.76923076923077 | Mycobacterium tuberculosis (strain ATCC 25618 / H37Rv) | unclassified | Prediction |
| Pituitary adenylate cyclase-activating polypeptide | 9.76 | 2 | 1 | Homo sapiens | unclassified | Prediction |
| Serine/threonine protein phosphatase 2A- 56 kDa regulatory subunit- alpha isoform | 10.013333333333 | 3 | 1 | Homo sapiens | enzyme phosphatase protein phosphatase reg | Prediction |
Target Selection Upon Specific Cell Lines.
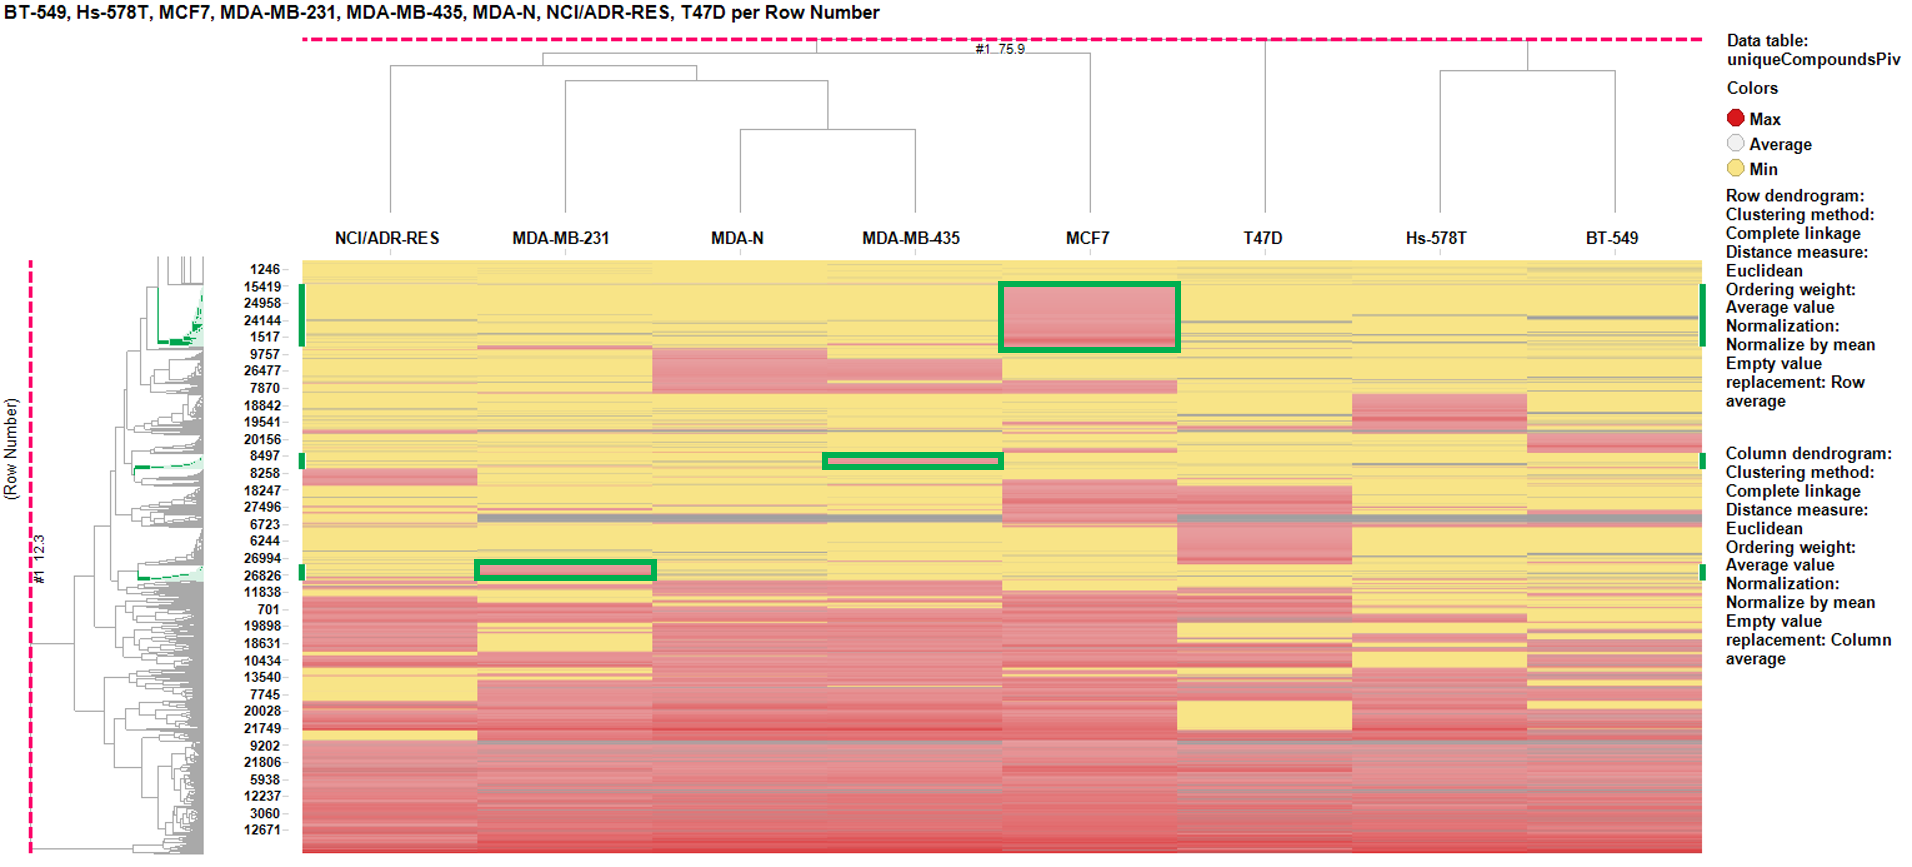
So far we have been using the average BrCa scores from experiments carried out with 8 BrCa cell lines, but it is well known that there are genotypic and phenotypic differences among them that translate to differences in pharmacology. This may be relevant for discriminative treatments of tumors, for which the cell lines are representative, and the procedure is applicable on clinical databases with extensive and updated tumor treatment outcomes.
For this purpose, let’s do a simple classification of the tumors via hierarchical clustering performed on the global results of the BrCa compounds in the whole ChEMBL database, having removed all relatived to tumors or phenotypic (non molecular target) assays. The chart below shows the results of the clustering with a focus on three cell lines (MCF7, MDA-MB-435, and MDA-MB-231). The cell line specific clusters are areas where the activity on the cell line is the greatest (red) and minimal for the rest (yellow). Experiments with specific areas of activity are marked in red on the chart.
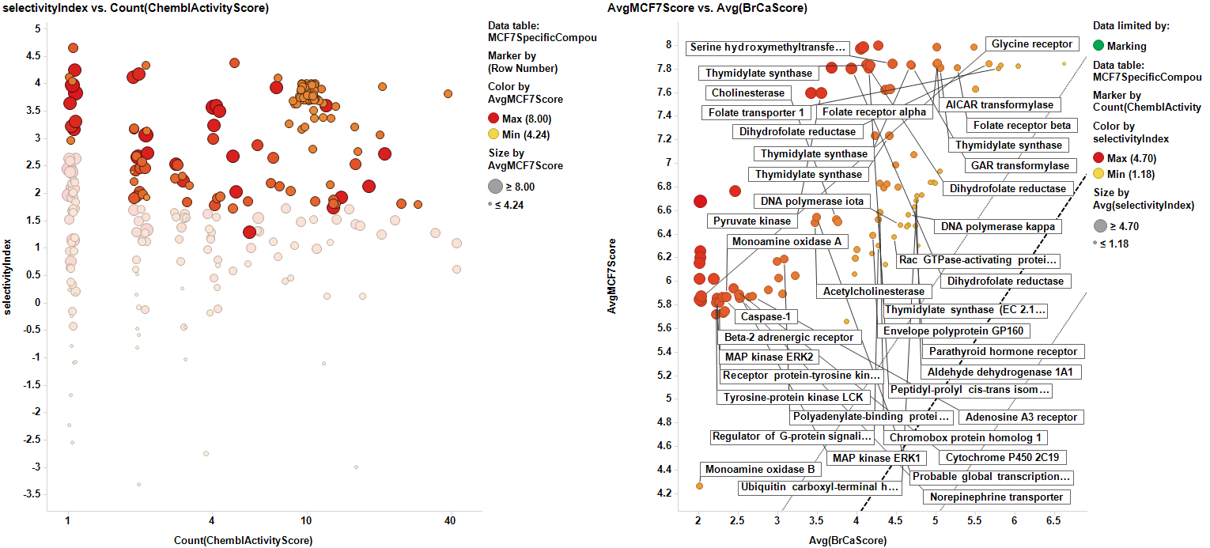
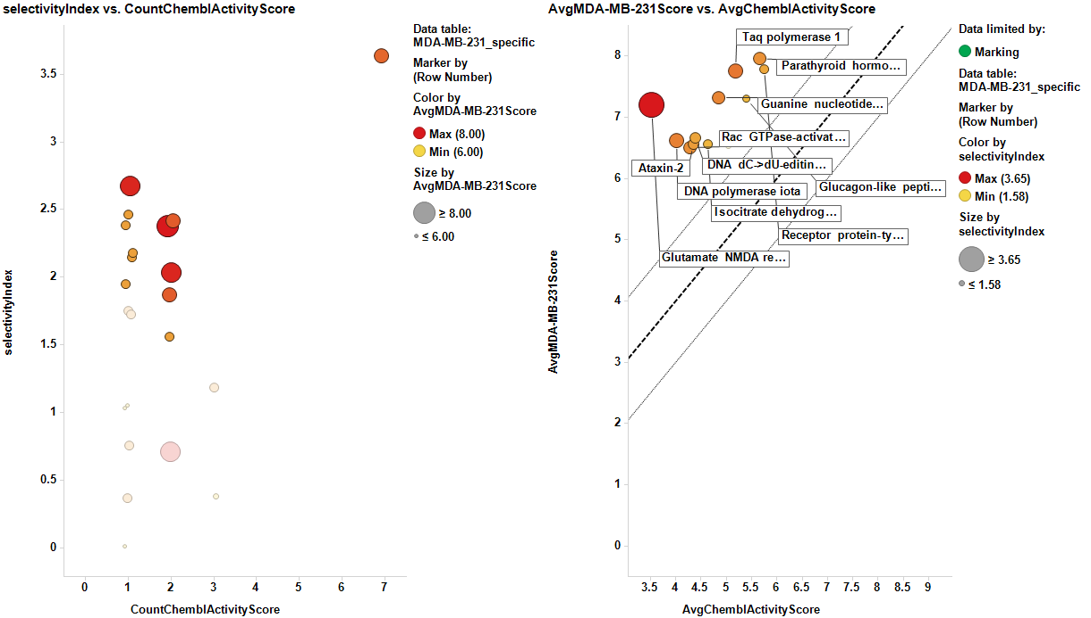
Once the results are collected, we proceed with the cell line specific results similar to the global target identification procedure. Results are pivoted by target, and the average potency in the specific cell line is calculated alongside the number of experimental data (countChemblScore). This is compared to the average potency of such experimental events at the average BrCaScore calculated from all BrCa cell lines. To facilitate selection views and interpretation, a selectivity index between the specific cell line and the averageBrCaScore is added to the plots.
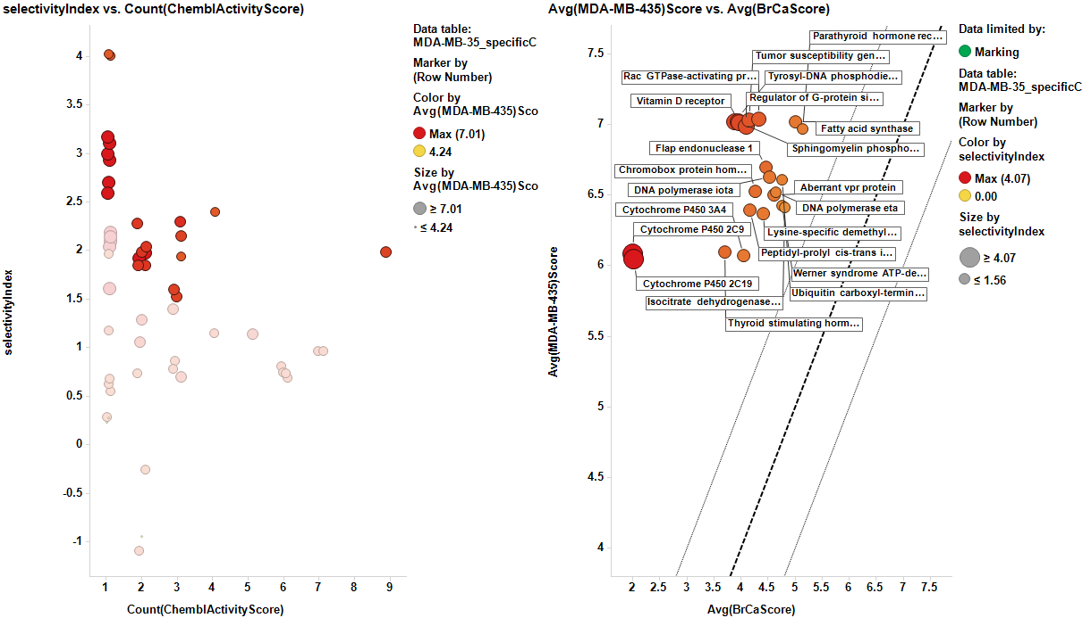
Charts below represent the dashboards used for selection. On the left, the selectivity index is compared to the number of events in the DB. Compounds with the highest indexes are then marked, which makes them to be plotted in the right chart, that compares the potency in each particular cell line to the average BrCaAverageScore with the y=x, y=x+1 and y=x-1 lines.
And the corresponding tables containing the selected targets:
| PROTEIN_NAME | Avg(BrCaScore) | Count(ChemblActivityScore) | AvgMCF7Score | selectivityIndex |
|---|---|---|---|---|
| Dihydrofolate reductase | 3.9242332834135 | 7 | 7.833 | 3.9087667165865 |
| Dihydrofolate reductase | 5.8513333333333 | 15 | 7.833 | 1.9816666666667 |
| Dihydrofolate reductase | 5.6658823529412 | 17 | 7.833 | 2.1671176470588 |
| Thymidylate synthase | 4.2058770028771 | 13 | 7.833 | 3.6271229971229 |
| Thymidylate synthase | 5.0226639688564 | 22 | 7.833 | 2.8103360311436 |
| Thymidylate synthase | 4.4166666666667 | 6 | 7.2349166666667 | 2.81825 |
| GAR transformylase | 4.6822333069284 | 4 | 7.833 | 3.1507666930716 |
| Dihydrofolate reductase | 4.1387041229868 | 4 | 7.833 | 3.6942958770132 |
| 6-O-methylguanine-DNA methyltransferase | 3 | 1 | 6.019 | 3.019 |
| Thymidylate synthase | 4.7 | 1 | 7.833 | 3.133 |
| Dihydrofolate reductase | 3.6382721639824 | 1 | 7.833 | 4.1947278360176 |
| Acetylcholinesterase | 3.09087893653 | 11 | 5.8754615384615 | 2.7845826019316 |
| GAR transformylase | 6.6521464575467 | 6 | 7.833 | 1.1808535424533 |
| Folate transporter 1 | 5.7792182518111 | 5 | 7.833 | 2.0537817481889 |
| Arachidonate 5-lipoxygenase | 3.9958037874723 | 2 | 6.251 | 2.2551962125276 |
| Monoamine oxidase A | 2 | 1 | 6.146 | 4.146 |
| Monoamine oxidase B | 2 | 2 | 4.2445 | 2.2445 |
| Cytochrome P450 3A4 | 2.978947368421 | 19 | 6.14765 | 3.168702631579 |
| DNA topoisomerase II alpha | 4.61 | 2 | 6.436 | 1.826 |
| Indoleamine 2,3-dioxygenase | 3.8624693683042 | 2 | 5.6645 | 1.8020306316959 |
| Proton-coupled folate transporter | 6.0120986299462 | 12 | 7.833 | 1.8209013700538 |
| Folate receptor alpha | 5.034 | 5 | 7.833 | 2.799 |
| Folate receptor beta | 5.2733333333333 | 3 | 7.833 | 2.5596666666667 |
| Cytochrome P450 1A2 | 3.9766666666667 | 12 | 6.04671875 | 2.0700520833333 |
| Quinone reductase 2 | 3.77 | 2 | 6.48 | 2.71 |
| Menin/Histone-lysine N-methyltransferase MLL | 4.3625 | 16 | 6.85 | 2.4875 |
| Thyroid hormone receptor beta-1 | 4.2374999514771 | 4 | 7.2075 | 2.9700000485229 |
| Endoplasmic reticulum-associated amyloid beta-peptide-binding protein | 4.95 | 2 | 6.8235 | 1.8735 |
| Lysine-specific demethylase 4D-like | 4.5 | 2 | 6.8235 | 2.3235 |
| Signal transducer and activator of transcription 6 | 5.4666666666667 | 3 | 7.617 | 2.1503333333333 |
| Ras-related protein Rab-9A | 4.25 | 2 | 6.8185 | 2.5685 |
| Survival motor neuron protein | 2 | 8 | 5.997 | 3.997 |
| Pyruvate kinase | 3.525 | 2 | 7.617 | 4.092 |
| Pyruvate kinase isozymes M1/M2 | 3.425 | 2 | 7.617 | 4.192 |
| Aldehyde dehydrogenase 1A1 | 4.75 | 4 | 6.65875 | 1.90875 |
| Nonstructural protein 1 | 2.4664795276306 | 5 | 6.7508 | 4.2843204723694 |
| MAP kinase ERK2 | 2.2181818181818 | 11 | 5.8644545454546 | 3.6462727272727 |
| Caspase-1 | 2.3181818181818 | 11 | 5.8600909090909 | 3.5419090909091 |
| Neuropeptide S receptor | 5 | 2 | 6.8185 | 1.8185 |
| Cytochrome P450 2D6 | 2.8666666666667 | 15 | 5.9415666666667 | 3.0749 |
| Cytochrome P450 2C9 | 3.2 | 16 | 6.04628125 | 2.84628125 |
| Nitric oxide synthase, inducible | 2.1763001963315 | 11 | 5.7262727272727 | 3.5499725309412 |
| Matrix metalloproteinase 9 | 2.3226974474426 | 11 | 5.7262727272727 | 3.4035752798302 |
| Matrix metalloproteinase-1 | 2.3204329899232 | 11 | 5.7262727272727 | 3.4058397373496 |
| Beta-glucocerebrosidase | 4.4000001860566 | 1 | 7.617 | 3.2169998139434 |
| Lysine-specific demethylase 4A | 4.3549999847922 | 30 | 6.1392 | 1.7842000152078 |
| Beta-2 adrenergic receptor | 2.2227273160387 | 11 | 5.8644545454546 | 3.6417272294159 |
| Putative hexokinase HKDC1 | 5.45 | 2 | 8 | 2.55 |
| Tumor susceptibility gene 101 protein | 4.6933316382564 | 2 | 7.08 | 2.3866683617436 |
| Cytochrome P450 2C19 | 2.4285714285714 | 14 | 5.9393928571429 | 3.5108214285714 |
| Serine hydroxymethyltransferase, cytosolic | 4.4253555070293 | 4 | 7.833 | 3.4076444929707 |
| Thymidylate synthase (EC 2.1.1.45) (TS) (TSase) | 4.12 | 1 | 7.833 | 3.713 |
| Chromobox protein homolog 1 | 4.3000000202531 | 7 | 6.5681428571429 | 2.2681428368898 |
| Delta opioid receptor | 2.1849346390687 | 11 | 6.0444545454545 | 3.8595199063858 |
| DNA polymerase iota | 4.5881903578905 | 26 | 6.4524230769231 | 1.8642327190326 |
| Glucose-6-phosphate 1-dehydrogenase | 2 | 1 | 6.232 | 4.232 |
| mRNA interferase MazF | 4.2882736040518 | 4 | 8 | 3.7117263959482 |
| Thioredoxin reductase 1, cytoplasmic | 4.7692325381619 | 13 | 6.4742307692308 | 1.7049982310688 |
| Regulator of G-protein signaling 4 | 4.3026465986627 | 9 | 6.2887777777778 | 1.9861311791151 |
| Serotonin 5a (5-HT5a) receptor | 4.0342810297558 | 1 | 8 | 3.9657189702442 |
| Opioid receptors; mu & delta | 5.01 | 2 | 8 | 2.99 |
| DNA polymerase kappa | 4.6227151804016 | 13 | 6.5556923076923 | 1.9329771272907 |
| Luciferin 4-monooxygenase | 4.9459800515598 | 2 | 6.818 | 1.8720199484402 |
| Adenosine A1 receptor | 2 | 10 | 5.8489 | 3.8489 |
| Adenosine A2a receptor | 2 | 10 | 5.8489 | 3.8489 |
| Adenosine A3 receptor | 2.676 | 10 | 5.8489 | 3.1729 |
| Alpha-1a adrenergic receptor | 2 | 10 | 5.8489 | 3.8489 |
| Alpha-1b adrenergic receptor | 2 | 10 | 5.8489 | 3.8489 |
| Alpha-1d adrenergic receptor | 2 | 10 | 5.8489 | 3.8489 |
| Alpha-2a adrenergic receptor | 2 | 10 | 5.8489 | 3.8489 |
| Alpha-2b adrenergic receptor | 2 | 10 | 5.8489 | 3.8489 |
| Alpha-2c adrenergic receptor | 2 | 10 | 5.8489 | 3.8489 |
| Beta-1 adrenergic receptor | 2 | 10 | 5.8489 | 3.8489 |
| Beta-3 adrenergic receptor | 2 | 10 | 5.8489 | 3.8489 |
| Norepinephrine transporter | 2.506 | 10 | 5.8489 | 3.3429 |
| Aldose reductase | 2 | 10 | 5.8489 | 3.8489 |
| Angiotensin II type 2 (AT-2) receptor | 2 | 10 | 5.8489 | 3.8489 |
| Bradykinin B2 receptor | 2 | 10 | 5.8489 | 3.8489 |
| Calcitonin receptor | 2 | 10 | 5.8489 | 3.8489 |
| Cannabinoid CB1 receptor | 2 | 10 | 5.8489 | 3.8489 |
| Carbonic anhydrase II | 2 | 10 | 5.8489 | 3.8489 |
| C-C chemokine receptor type 2 | 2 | 10 | 5.8489 | 3.8489 |
| C-C chemokine receptor type 4 | 2 | 10 | 5.8489 | 3.8489 |
| C-C chemokine receptor type 5 | 2 | 10 | 5.8489 | 3.8489 |
| Interleukin-8 receptor A | 2 | 10 | 5.8489 | 3.8489 |
| Interleukin-8 receptor B | 2 | 10 | 5.8489 | 3.8489 |
| Cholecystokinin A receptor | 2 | 10 | 5.8489 | 3.8489 |
| Cyclooxygenase-1 | 2 | 10 | 5.8489 | 3.8489 |
| Cyclooxygenase-2 | 2 | 10 | 5.8489 | 3.8489 |
| Cytochrome P450 2A6 | 2 | 10 | 5.8489 | 3.8489 |
| Cytochrome P450 2E1 | 2 | 10 | 5.8489 | 3.8489 |
| Dopamine D1 receptor | 2 | 10 | 5.8489 | 3.8489 |
| Dopamine D2 receptor | 2 | 10 | 5.8489 | 3.8489 |
| Dopamine D3 receptor | 2 | 10 | 5.8489 | 3.8489 |
| Dopamine D4 receptor | 2 | 10 | 5.8489 | 3.8489 |
| Dopamine transporter | 2 | 10 | 5.8489 | 3.8489 |
| Endothelin receptor ET-A | 2 | 10 | 5.8489 | 3.8489 |
| Estrogen receptor alpha | 2 | 10 | 5.8489 | 3.8489 |
| Estrogen receptor beta | 2 | 10 | 5.8489 | 3.8489 |
| Glucocorticoid receptor | 2 | 10 | 5.8489 | 3.8489 |
| Glycine receptor | 2 | 40 | 5.8489 | 3.8489 |
| Histamine H1 receptor | 2 | 10 | 5.8489 | 3.8489 |
| Histamine H2 receptor | 2 | 10 | 5.8489 | 3.8489 |
| HMG-CoA reductase | 2 | 10 | 5.8489 | 3.8489 |
| Insulin receptor | 2 | 10 | 5.8489 | 3.8489 |
| Leukotriene C4 synthase | 2 | 10 | 5.8489 | 3.8489 |
| Cysteinyl leukotriene receptor 1 | 2 | 10 | 5.8489 | 3.8489 |
| Arachidonate 15-lipoxygenase | 2 | 10 | 5.8489 | 3.8489 |
| Melanocortin receptor 3 | 2 | 10 | 5.8489 | 3.8489 |
| Melanocortin receptor 4 | 2 | 10 | 5.8489 | 3.8489 |
| Melanocortin receptor 5 | 2 | 10 | 5.8489 | 3.8489 |
| Monoamine oxidase A | 2.3577777777778 | 9 | 5.8489 | 3.4911222222222 |
| Muscarinic acetylcholine receptor M1 | 2 | 10 | 5.8489 | 3.8489 |
| Muscarinic acetylcholine receptor M2 | 2 | 10 | 5.8489 | 3.8489 |
| Muscarinic acetylcholine receptor M3 | 2 | 10 | 5.8489 | 3.8489 |
| Muscarinic acetylcholine receptor M4 | 2 | 10 | 5.8489 | 3.8489 |
| Muscarinic acetylcholine receptor M5 | 2 | 10 | 5.8489 | 3.8489 |
| Neuropeptide Y receptor type 1 | 2 | 10 | 5.8489 | 3.8489 |
| Neuropeptide Y receptor type 2 | 2 | 10 | 5.8489 | 3.8489 |
| Nitric-oxide synthase, brain | 2 | 10 | 5.8489 | 3.8489 |
| Kappa opioid receptor | 2 | 10 | 5.8489 | 3.8489 |
| Mu opioid receptor | 2.1849346390687 | 11 | 6.0444545454545 | 3.8595199063858 |
| Phosphodiesterase 5A | 2 | 10 | 5.8489 | 3.8489 |
| Platelet activating factor receptor | 2 | 10 | 5.8489 | 3.8489 |
| HERG | 2 | 10 | 5.8489 | 3.8489 |
| Progesterone receptor | 2 | 10 | 5.8489 | 3.8489 |
| Angiotensin-converting enzyme | 2 | 10 | 5.8489 | 3.8489 |
| Cathepsin G | 2 | 10 | 5.8489 | 3.8489 |
| Leukocyte elastase | 2 | 10 | 5.8489 | 3.8489 |
| Protein kinase C alpha | 2 | 10 | 5.8489 | 3.8489 |
| MAP kinase ERK1 | 2.535 | 12 | 5.87725 | 3.34225 |
| MAP kinase p38 alpha | 2 | 10 | 5.8489 | 3.8489 |
| Serine/threonine protein phosphatase 2B catalytic subunit, alpha isoform | 2 | 10 | 5.8489 | 3.8489 |
| Epidermal growth factor receptor erbB1 | 2 | 10 | 5.8489 | 3.8489 |
| Tyrosine-protein kinase FYN | 2.6475 | 8 | 5.8489 | 3.2014 |
| Receptor protein-tyrosine kinase erbB-2 | 2.2644444444444 | 9 | 5.8489 | 3.5844555555556 |
| Tyrosine-protein kinase LCK | 2.2511111111111 | 9 | 5.8489 | 3.5977888888889 |
| Leukocyte common antigen | 2 | 10 | 5.8489 | 3.8489 |
| Serotonin 1a (5-HT1a) receptor | 2 | 10 | 5.8489 | 3.8489 |
| Serotonin 1b (5-HT1b) receptor | 2 | 10 | 5.8489 | 3.8489 |
| Serotonin 2a (5-HT2a) receptor | 2 | 10 | 5.8489 | 3.8489 |
| Serotonin 2b (5-HT2b) receptor | 2 | 10 | 5.8489 | 3.8489 |
| Serotonin 2c (5-HT2c) receptor | 2 | 10 | 5.8489 | 3.8489 |
| Serotonin 4 (5-HT4) receptor | 2 | 10 | 5.8489 | 3.8489 |
| Serotonin 6 (5-HT6) receptor | 2 | 10 | 5.8489 | 3.8489 |
| Serotonin transporter | 2 | 10 | 5.8489 | 3.8489 |
| Sigma opioid receptor | 2 | 10 | 5.8489 | 3.8489 |
| Neurokinin 1 receptor | 2 | 10 | 5.8489 | 3.8489 |
| Neurokinin 2 receptor | 2 | 10 | 5.8489 | 3.8489 |
| Androgen Receptor | 2 | 10 | 5.8489 | 3.8489 |
| Thromboxane-A synthase | 2 | 10 | 5.8489 | 3.8489 |
| Vascular endothelial growth factor receptor 1 | 2 | 10 | 5.8489 | 3.8489 |
| Vasoactive intestinal polypeptide receptor 1 | 2 | 20 | 5.8489 | 3.8489 |
| Vasopressin V1a receptor | 2 | 10 | 5.8489 | 3.8489 |
| Serine/threonine-protein kinase Chk1 | 4 | 3 | 6.226 | 2.226 |
| Serine/threonine-protein kinase Chk2 | 4.18 | 3 | 6.226 | 2.046 |
| DNA topoisomerase I | 2 | 1 | 6.696 | 4.696 |
| Polyadenylate-binding protein 1 | 3.0902280322291 | 2 | 6.177 | 3.0867719677709 |
| Rac GTPase-activating protein 1 | 4.4667722029103 | 4 | 6.36825 | 1.9014777970897 |
| Envelope polyprotein GP160 | 4.1730121946452 | 3 | 6.397 | 2.2239878053548 |
| Sphingomyelin phosphodiesterase | 4.4666664213754 | 3 | 7.0173333333333 | 2.550666911958 |
| Alpha-galactosidase A | 4.3499996034632 | 1 | 7.617 | 3.2670003965368 |
| Werner syndrome ATP-dependent helicase | 4.6208026697196 | 10 | 6.4915 | 1.8706973302804 |
| Peptidyl-prolyl cis-trans isomerase NIMA-interacting 1 | 4.2469870996598 | 8 | 6.51225 | 2.2652629003402 |
| Aberrant vpr protein | 4.7399990978754 | 5 | 6.3124 | 1.5724009021246 |
| Acetylcholinesterase | 3.4751188082446 | 2 | 6.4995 | 3.0243811917555 |
| Cholinesterase | 3.7565778940569 | 2 | 6.4995 | 2.7429221059431 |
| Probable global transcription activator SNF2L2 | 3.4972381536634 | 2 | 6.5155 | 3.0182618463366 |
| Protein skinhead-1 | 2 | 2 | 6.177 | 4.177 |
| AICAR transformylase | 5 | 2 | 7.833 | 2.833 |
| Ubiquitin carboxyl-terminal hydrolase 1 | 4.7416651891198 | 6 | 6.6995 | 1.9578348108802 |
| Rap guanine nucleotide exchange factor 4 | 4.0499999698534 | 1 | 8 | 3.9500000301466 |
| Parathyroid hormone receptor | 4.7214280892991 | 14 | 6.6178571428571 | 1.8964290535581 |
| Rap guanine nucleotide exchange factor 3 | 4.3142858259337 | 7 | 6.8132857142857 | 2.4989998883521 |
| Serine/threonine-protein kinase PLK1 | 5.0363219416878 | 4 | 6.95475 | 1.9184280583122 |
| Bloom syndrome protein | 4.8004372182185 | 3 | 6.7203333333333 | 1.9198961151148 |
| PROTEIN_NAME | Count(ChemblActivityScore) | Avg(BrCaScore) | Avg(MDA-MB-435)Score | selectivityIndex |
|---|---|---|---|---|
| Thyroid stimulating hormone receptor | 4 | 3.75 | 6.07 | 2.32 |
| Cytochrome P450 3A4 | 3 | 4.0666666666667 | 6.07 | 2.0033333333333 |
| Lysine-specific demethylase 4A | 9 | 4.3833330105114 | 6.393 | 2.0096669894886 |
| Tumor susceptibility gene 101 protein | 1 | 4.2500002511436 | 7.012 | 2.7619997488564 |
| Cytochrome P450 2C9 | 1 | 2 | 6.07 | 4.07 |
| Cytochrome P450 2C19 | 1 | 2 | 6.07 | 4.07 |
| Vitamin D receptor | 1 | 4 | 7.012 | 3.012 |
| Chromobox protein homolog 1 | 2 | 4.2750002267945 | 6.541 | 2.2659997732055 |
| DNA polymerase iota | 2 | 4.525000203465 | 6.5705 | 2.045499796535 |
| Flap endonuclease 1 | 3 | 4.4069944795629 | 6.707 | 2.3000055204371 |
| DNA polymerase eta | 2 | 4.7250005478383 | 6.5705 | 1.8454994521617 |
| Regulator of G-protein signaling 4 | 1 | 4.1000001283342 | 7.012 | 2.9119998716658 |
| Rac GTPase-activating protein 1 | 1 | 4.3719177390093 | 7.012 | 2.6400822609907 |
| Sphingomyelin phosphodiesterase | 1 | 3.9000001420576 | 7.012 | 3.1119998579424 |
| Werner syndrome ATP-dependent helicase | 3 | 4.7499998343016 | 6.4036666666667 | 1.6536668323651 |
| Peptidyl-prolyl cis-trans isomerase NIMA-interacting 1 | 3 | 4.2709828777203 | 6.4036666666667 | 2.1326837889463 |
| Fatty acid synthase | 2 | 4.9820490991005 | 7.012 | 2.0299509008995 |
| Aberrant vpr protein | 2 | 4.5249999297245 | 6.5545 | 2.0295000702755 |
| Isocitrate dehydrogenase [NADP] cytoplasmic | 3 | 4.8528810668585 | 6.4126666666667 | 1.5597855998082 |
| Ubiquitin carboxyl-terminal hydrolase 1 | 2 | 4.7000001289134 | 6.5545 | 1.8544998710866 |
| Tyrosyl-DNA phosphodiesterase 2 | 1 | 3.8919561716744 | 7.012 | 3.1200438283256 |
| Parathyroid hormone receptor | 2 | 5.0999990348465 | 7.012 | 1.9120009651535 |
| PROTEIN_NAME | CountChemblActivityScore | AvgMDA-MB-231Score | AvgBreastCancerScore | selectivityIndex |
|---|---|---|---|---|
| Taq polymerase 1 | 1 | 7.853 | 2.9755 | 2.613 |
| Glutamate NMDA receptor | 7 | 7.172 | 2.7388571428571 | 3.6491212547197 |
| Receptor protein-tyrosine kinase erbB-2 | 2 | 7.857 | 3.1714 | 2.087 |
| DNA polymerase iota | 1 | 6.564 | 2.5705 | 2.5140000301466 |
| DNA dC->dU-editing enzyme APOBEC-3F | 1 | 6.564 | 2.5705 | 2.1139995235747 |
| Rac GTPase-activating protein 1 | 1 | 6.564 | 2.5705 | 2.3602967400518 |
| Ataxin-2 | 1 | 6.564 | 2.5705 | 2.2140003965368 |
| Glucagon-like peptide 1 receptor | 2 | 7.282 | 2.7138214285714 | 1.8820045838536 |
| Guanine nucleotide-binding protein G(s), subunit alpha | 2 | 7.282 | 2.7138214285714 | 2.4570002567322 |
| Isocitrate dehydrogenase [NADP] cytoplasmic | 1 | 6.564 | 2.5705 | 1.9277867905357 |
| Parathyroid hormone receptor | 2 | 8 | 2.8571428571429 | 2.3346145711794 |
This sort of analysis is expanded in the BrCa pathways analysis section, to which you can access by clicking in this text.