GLP-1 Receptor Positive Allosteric Modulators

drTarget applies machine learning models on public DBs to perform a virtual screening on 2.3M molecules finding >37k potential positive allosteric modulators with a predicted activation score.

From this virtual screen, drTarget analyzes all activities of selected active PAMs
on relevant ChEMBL phenotypes. 


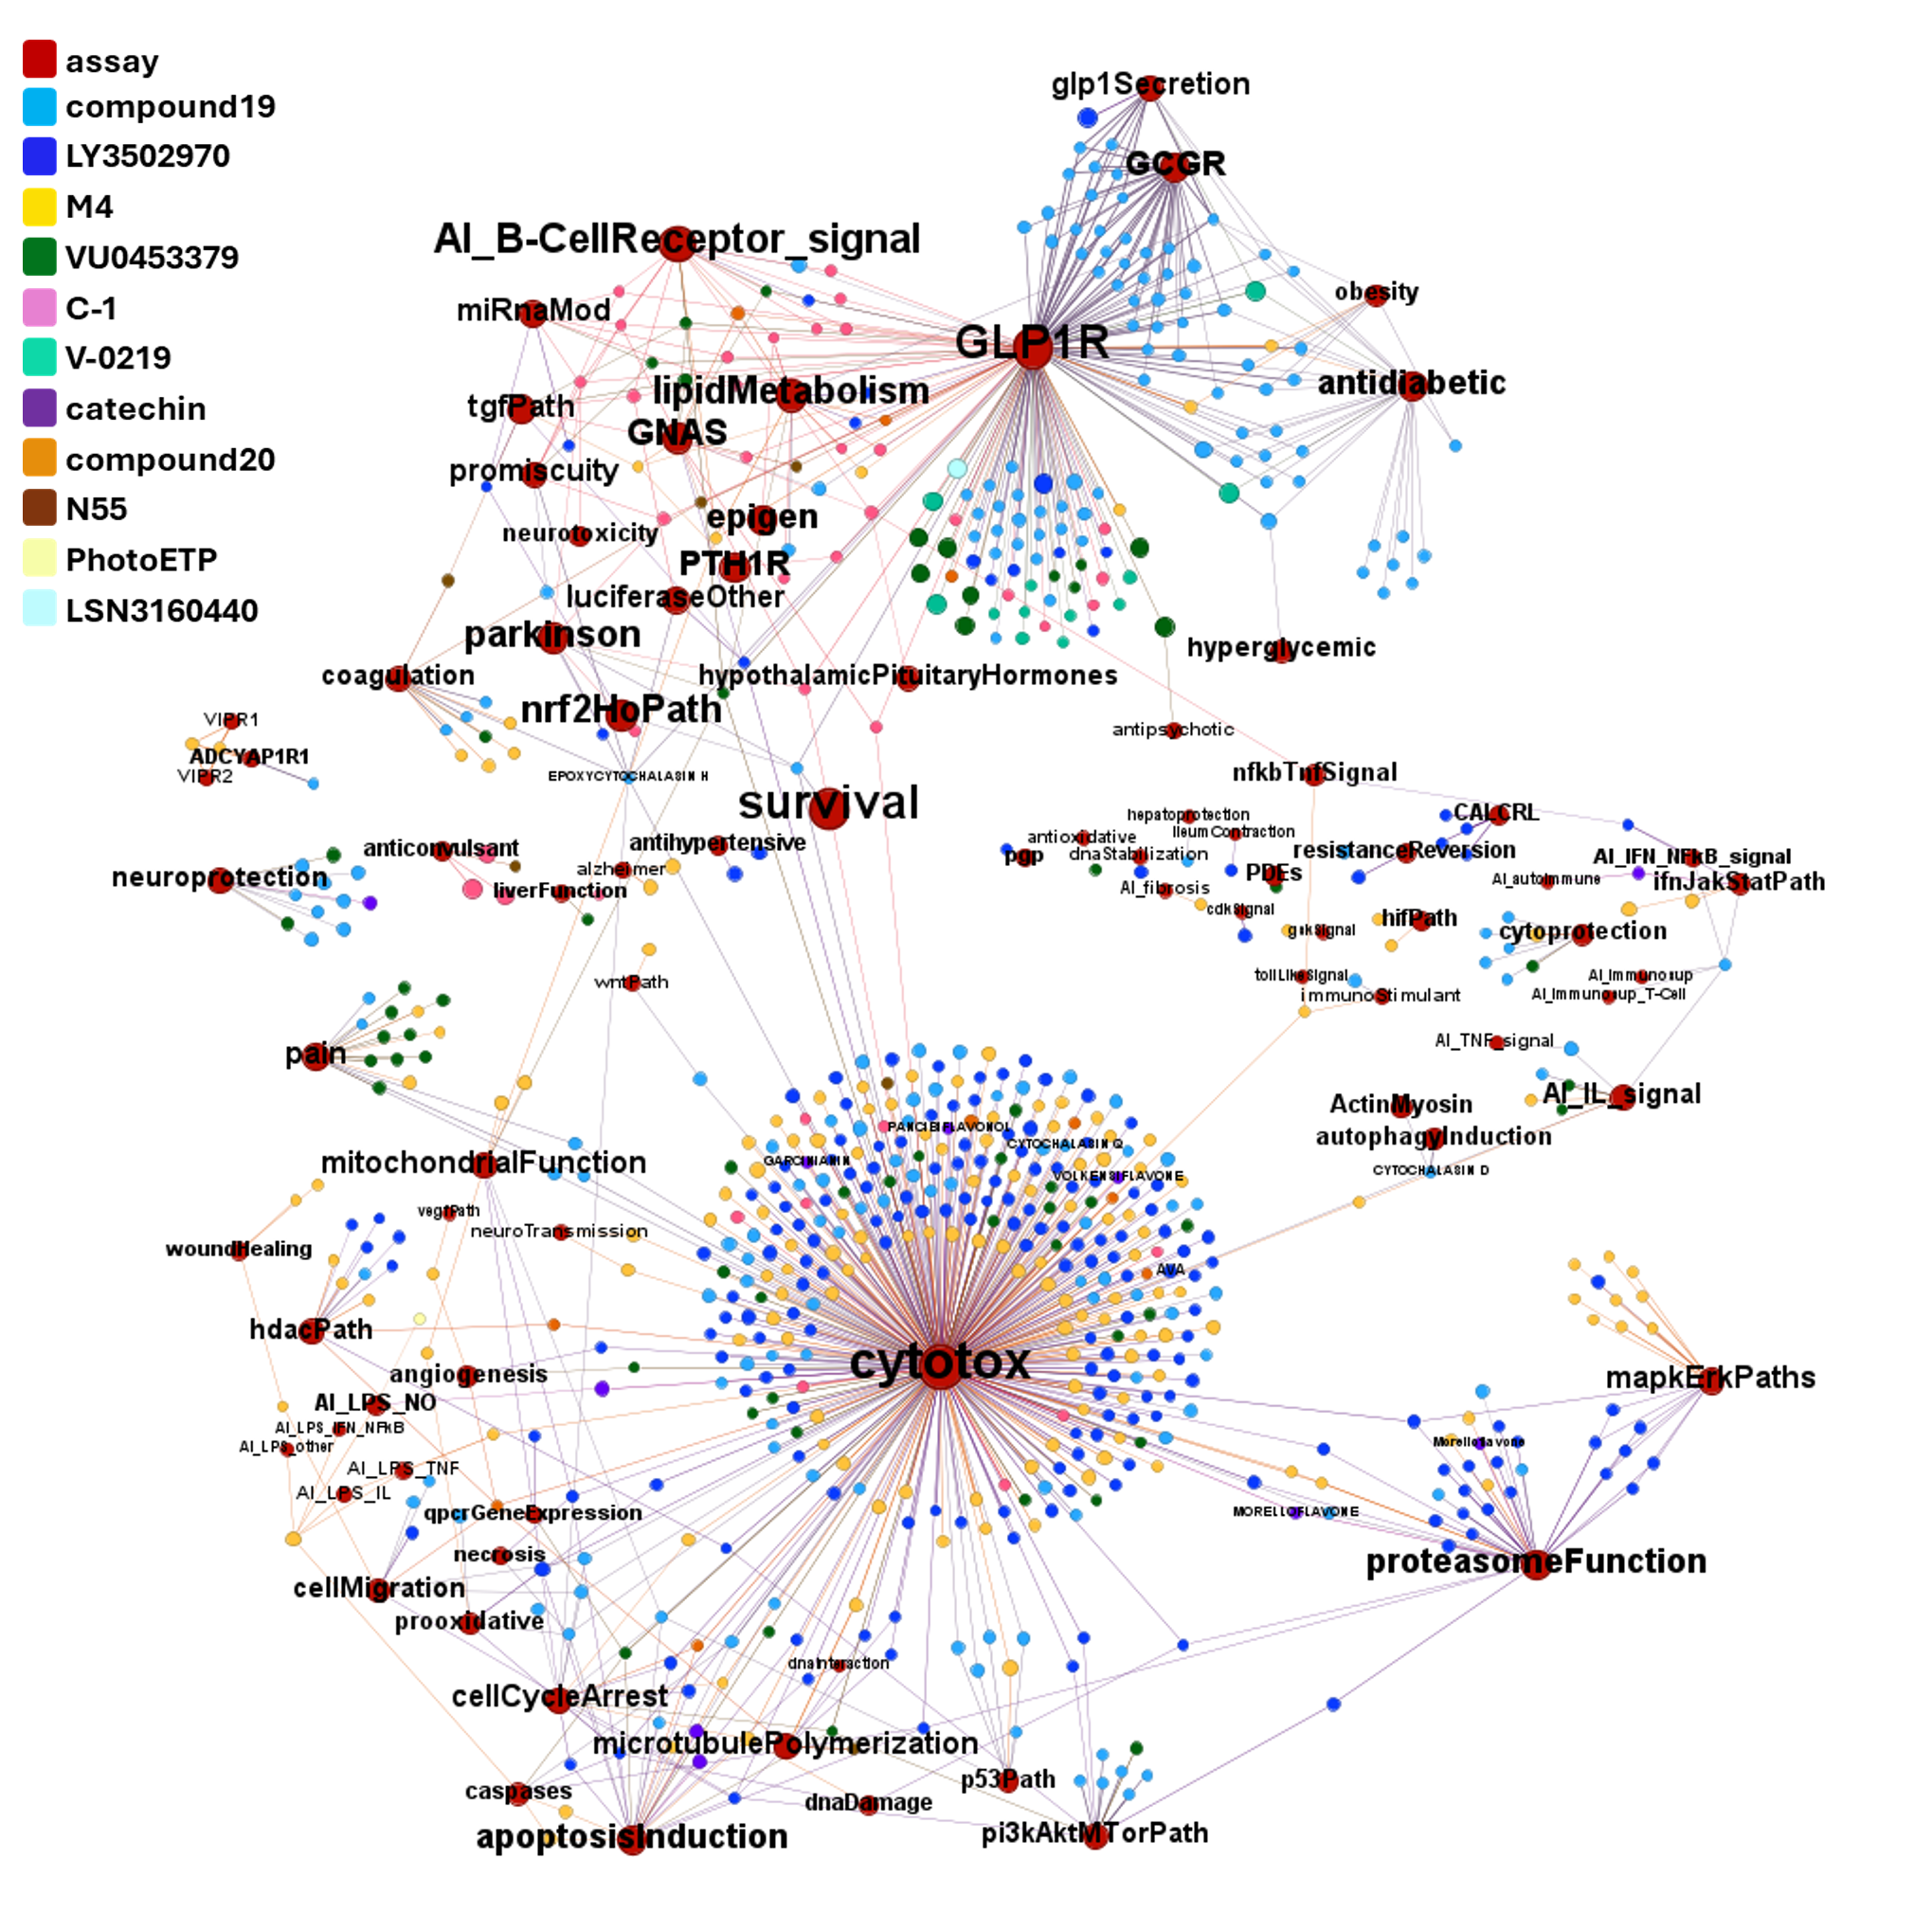
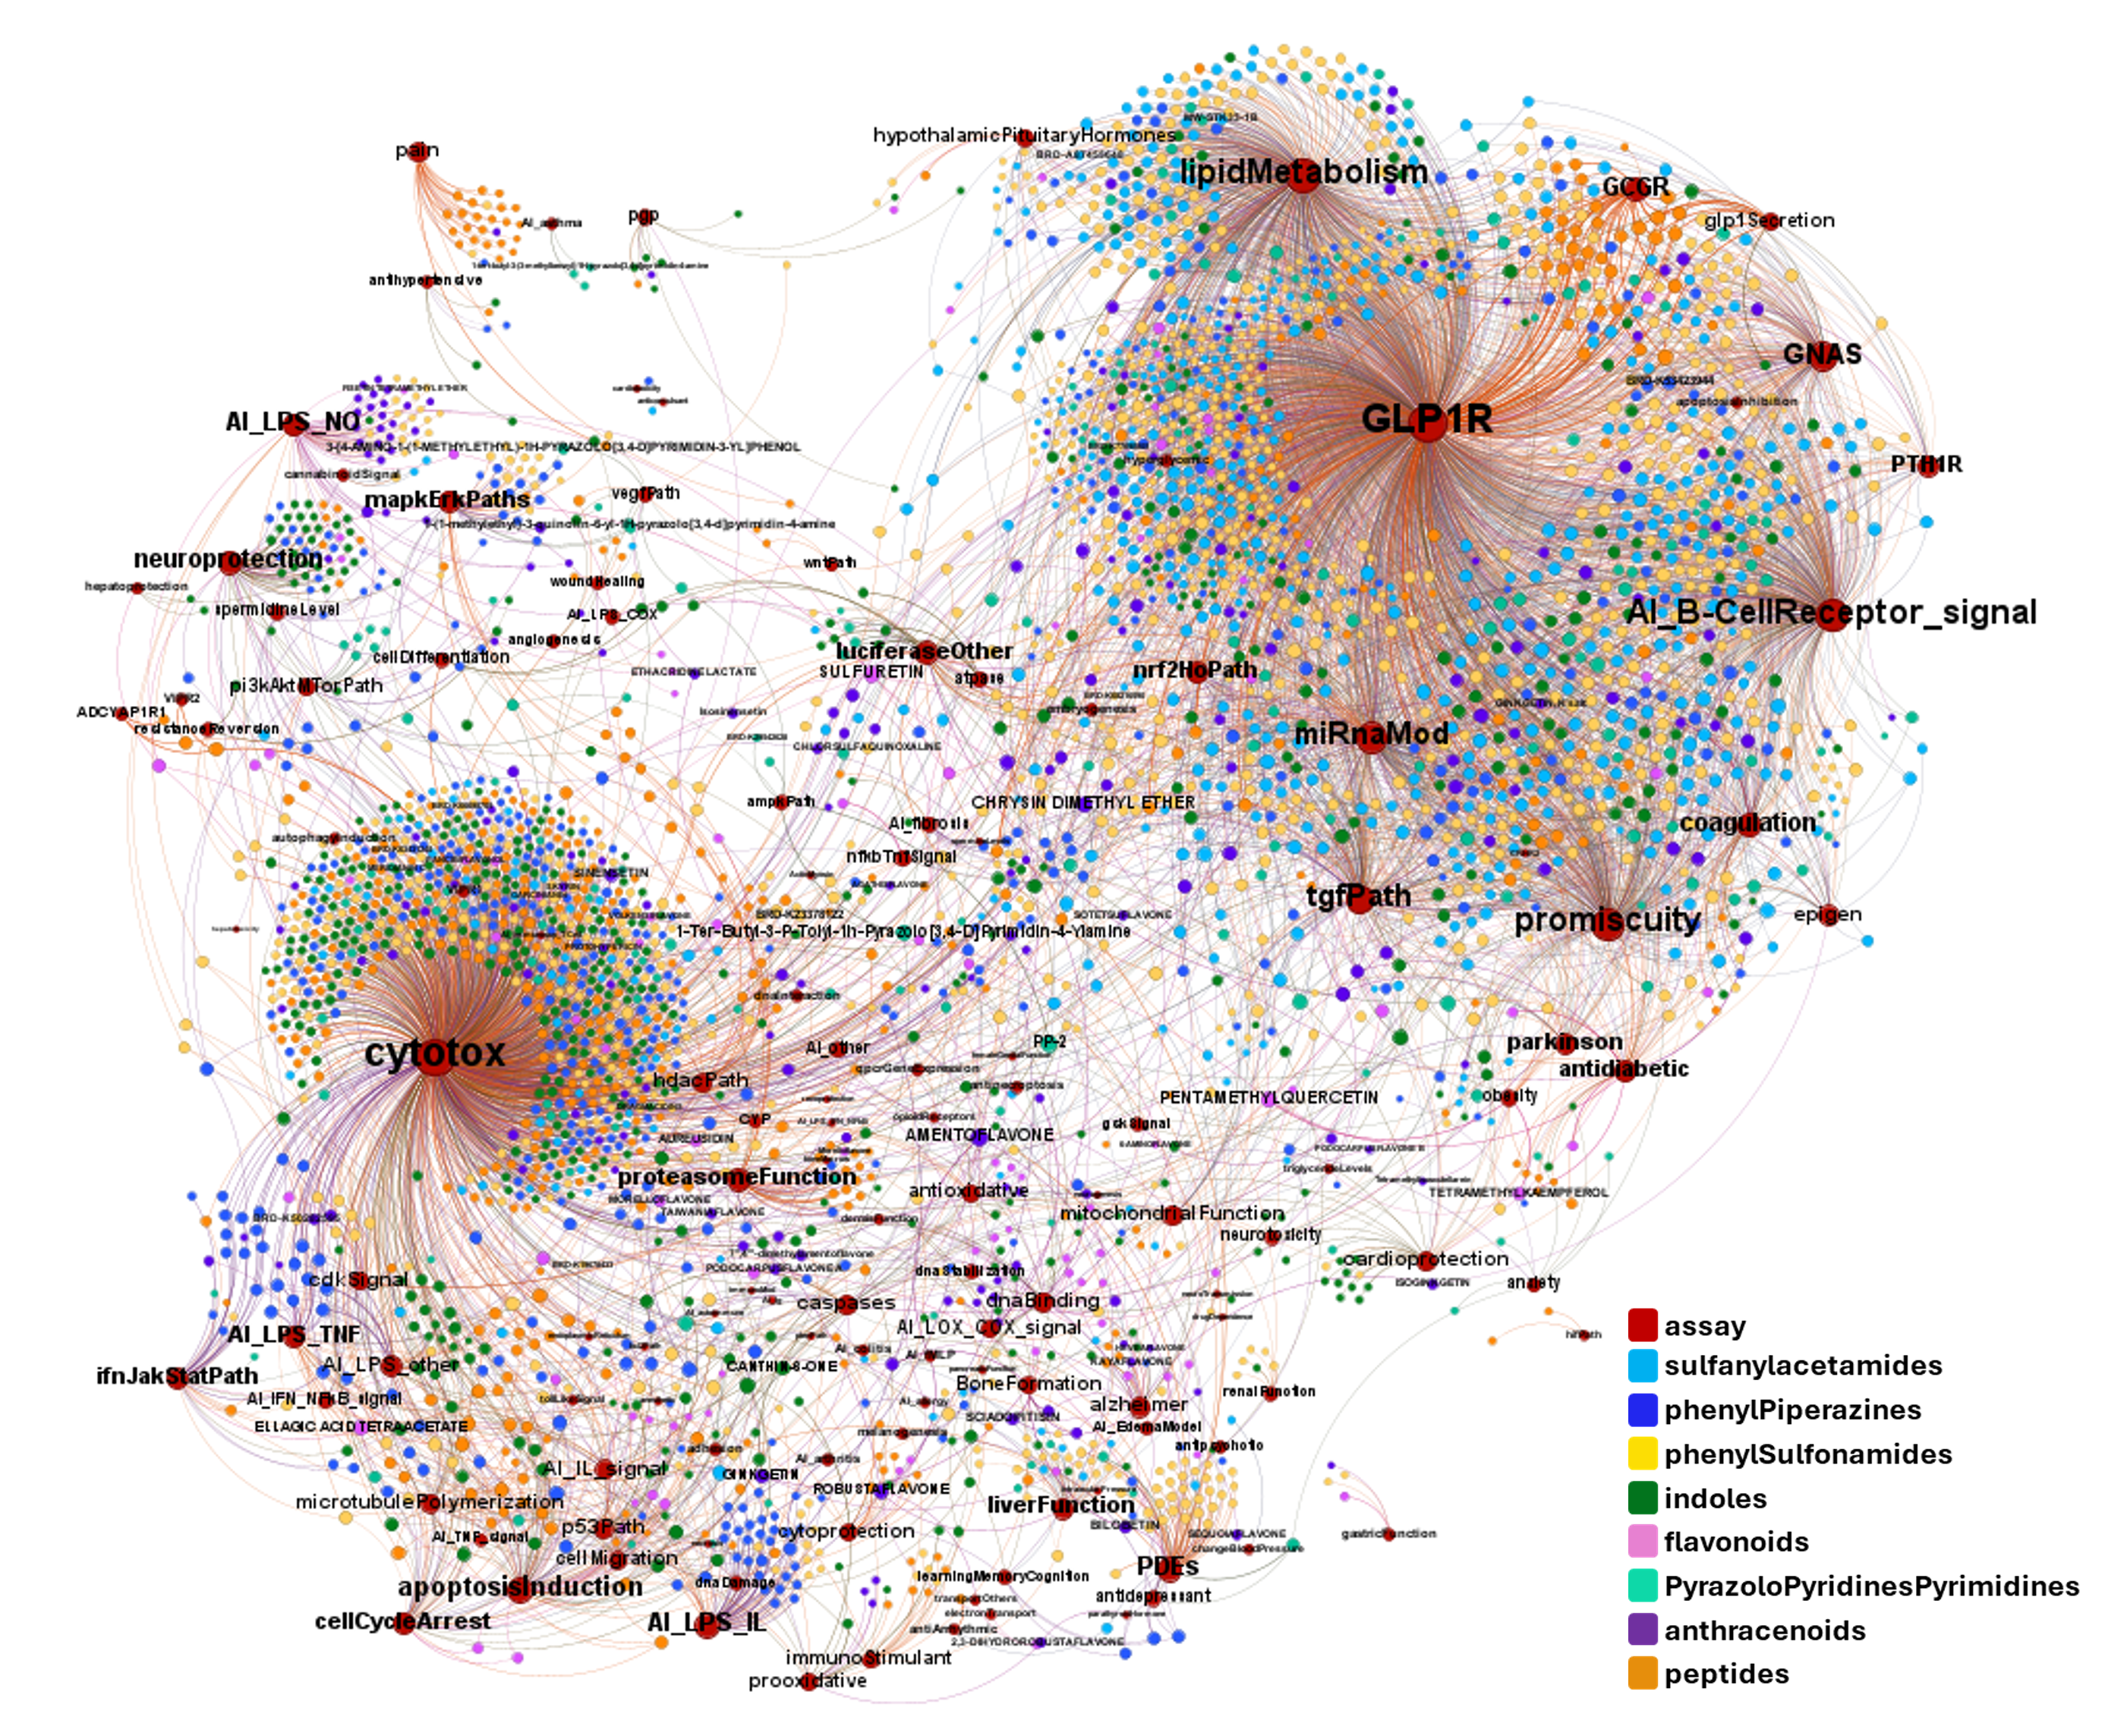
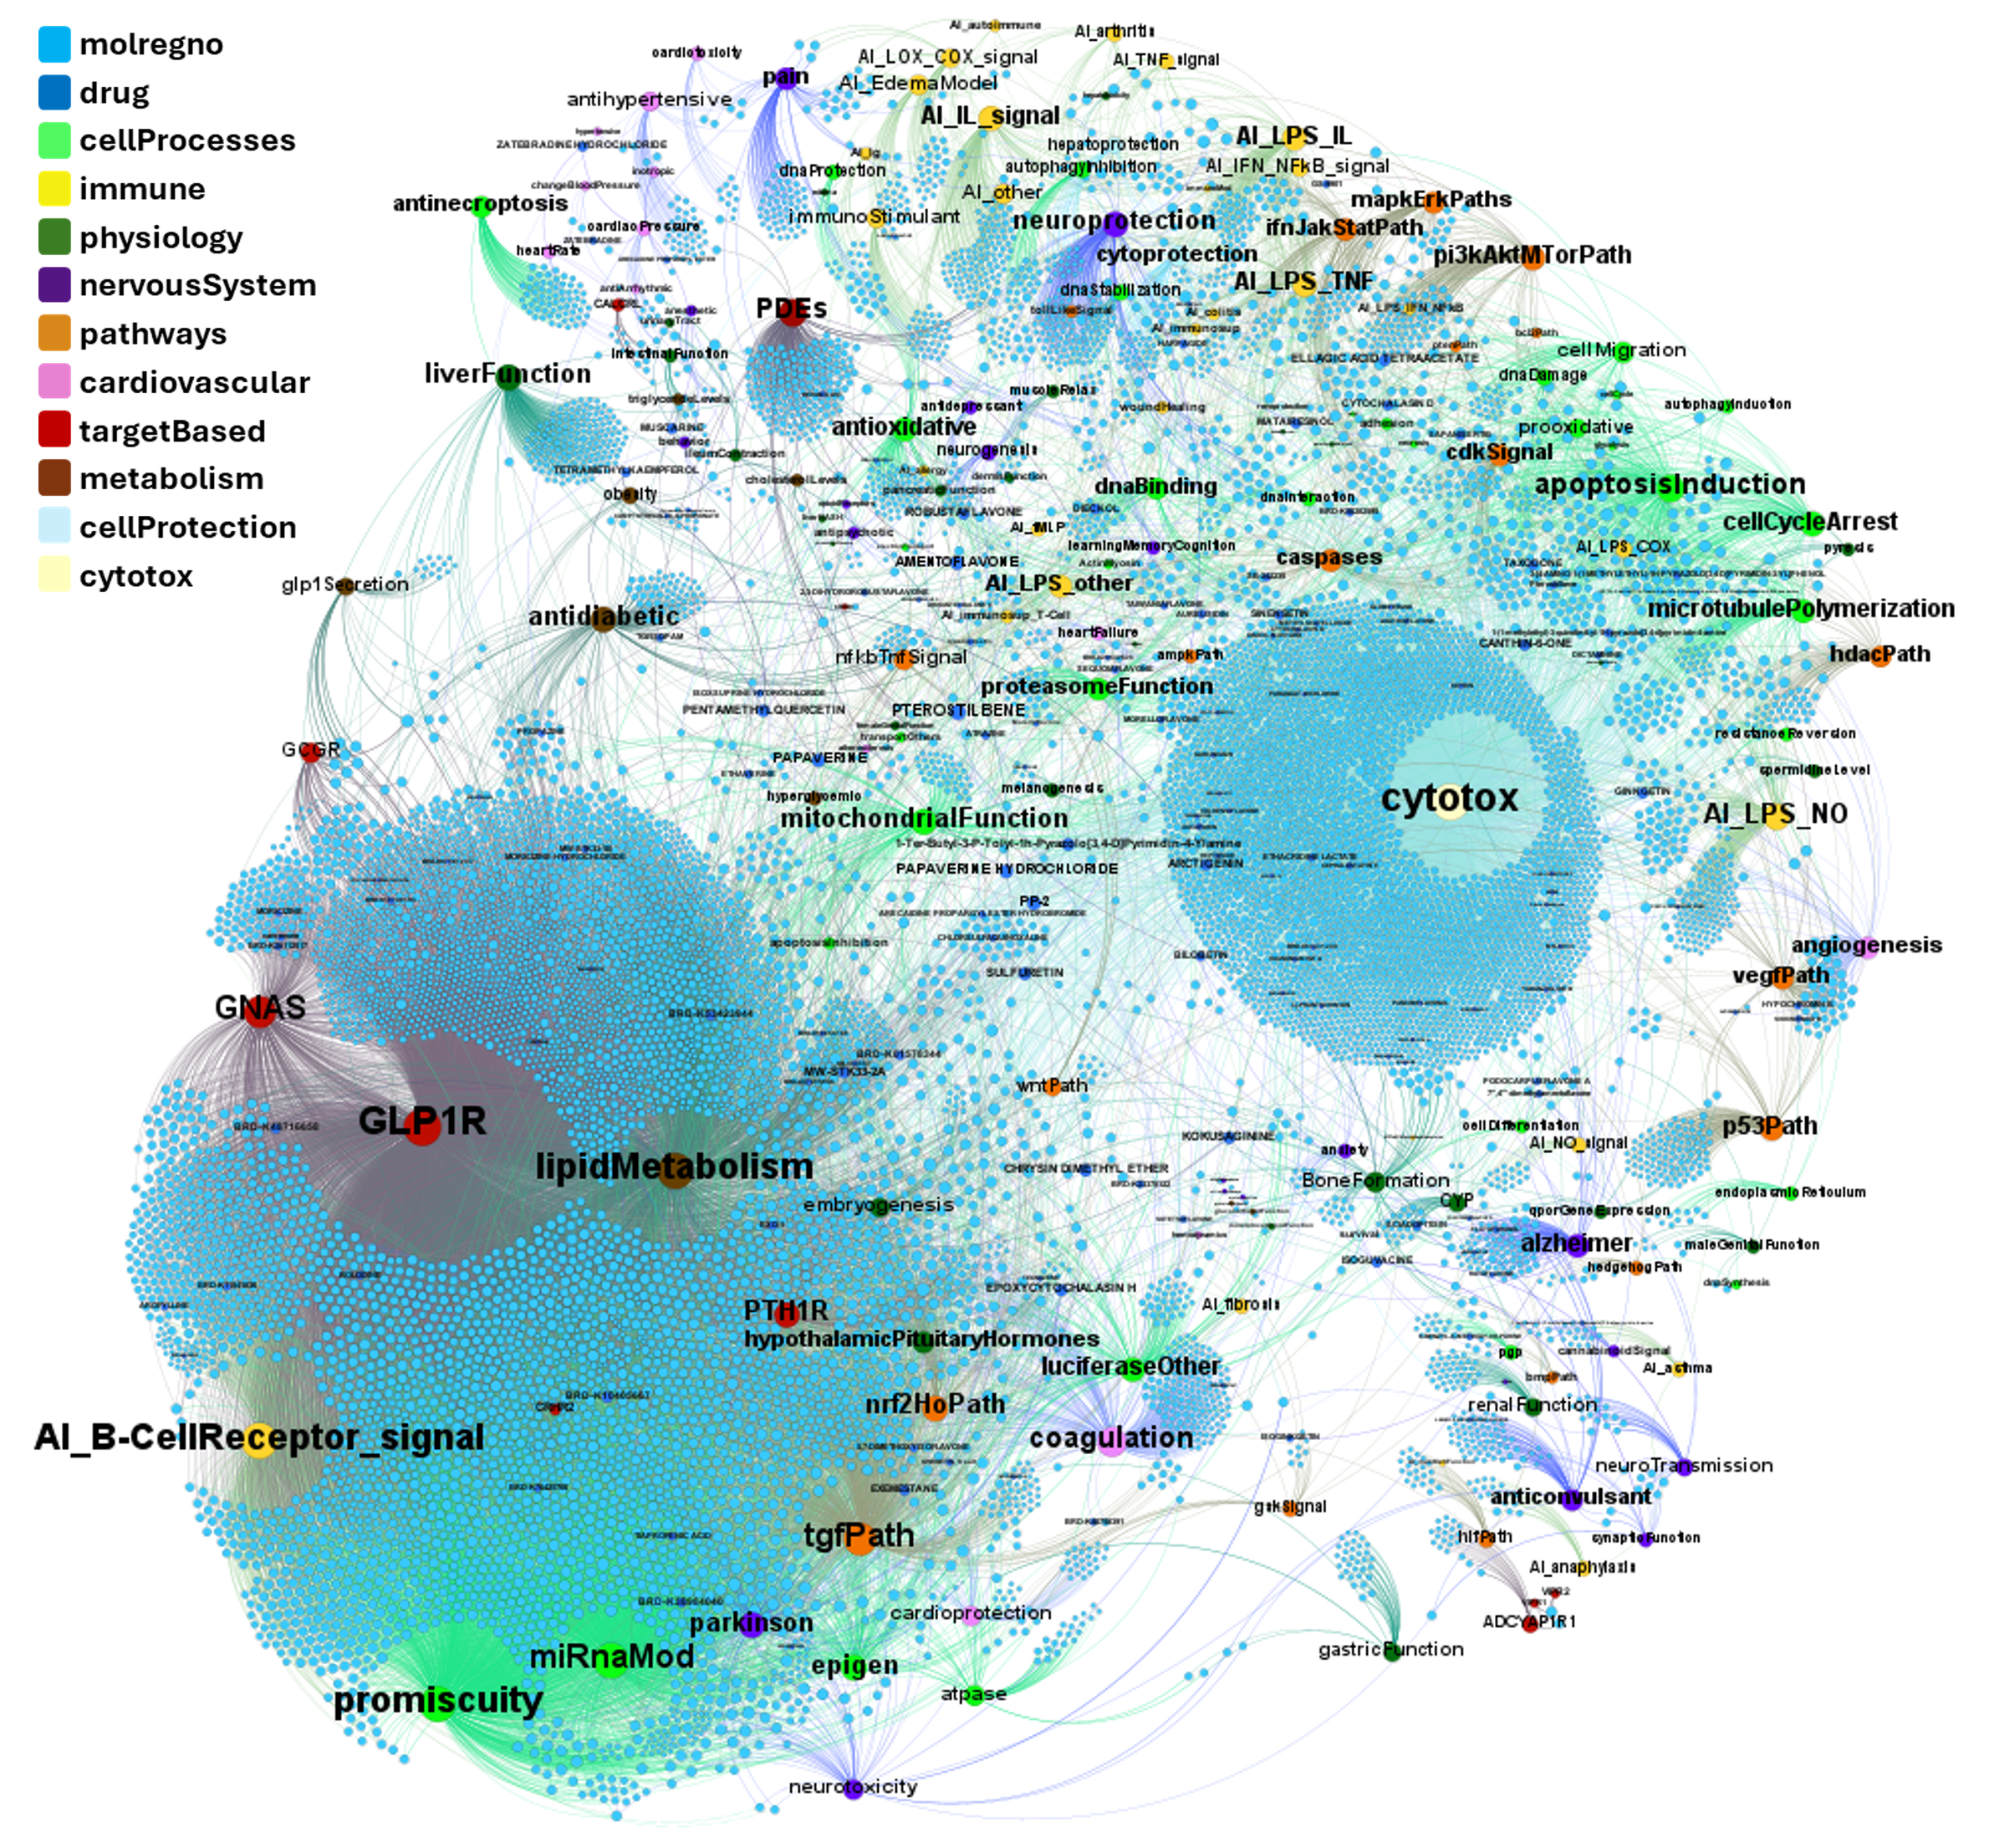
A network graph view here…

Interactions of GLP1R predicted PAMs with relevant targets/phenotypes recorded in ChEMBL

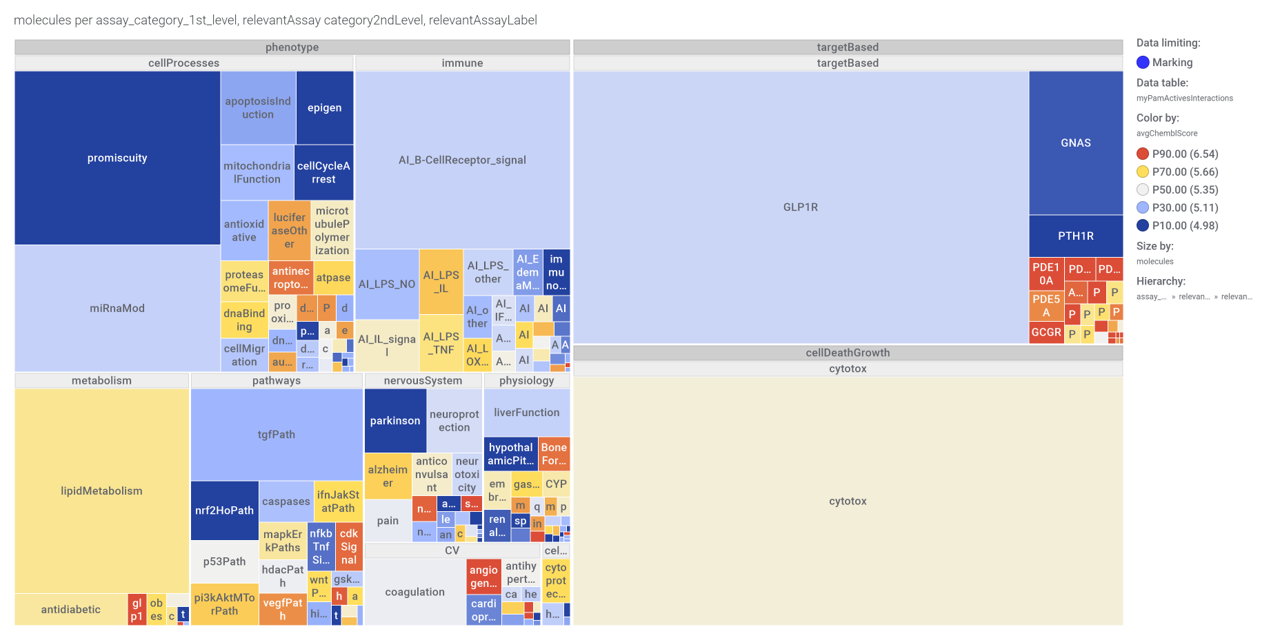
…Or a treeMap

GLP1R interactions treeMap

Find below particular examples of these interactions with some analogues of known GLP1R PAMs or some selected molecular series. 
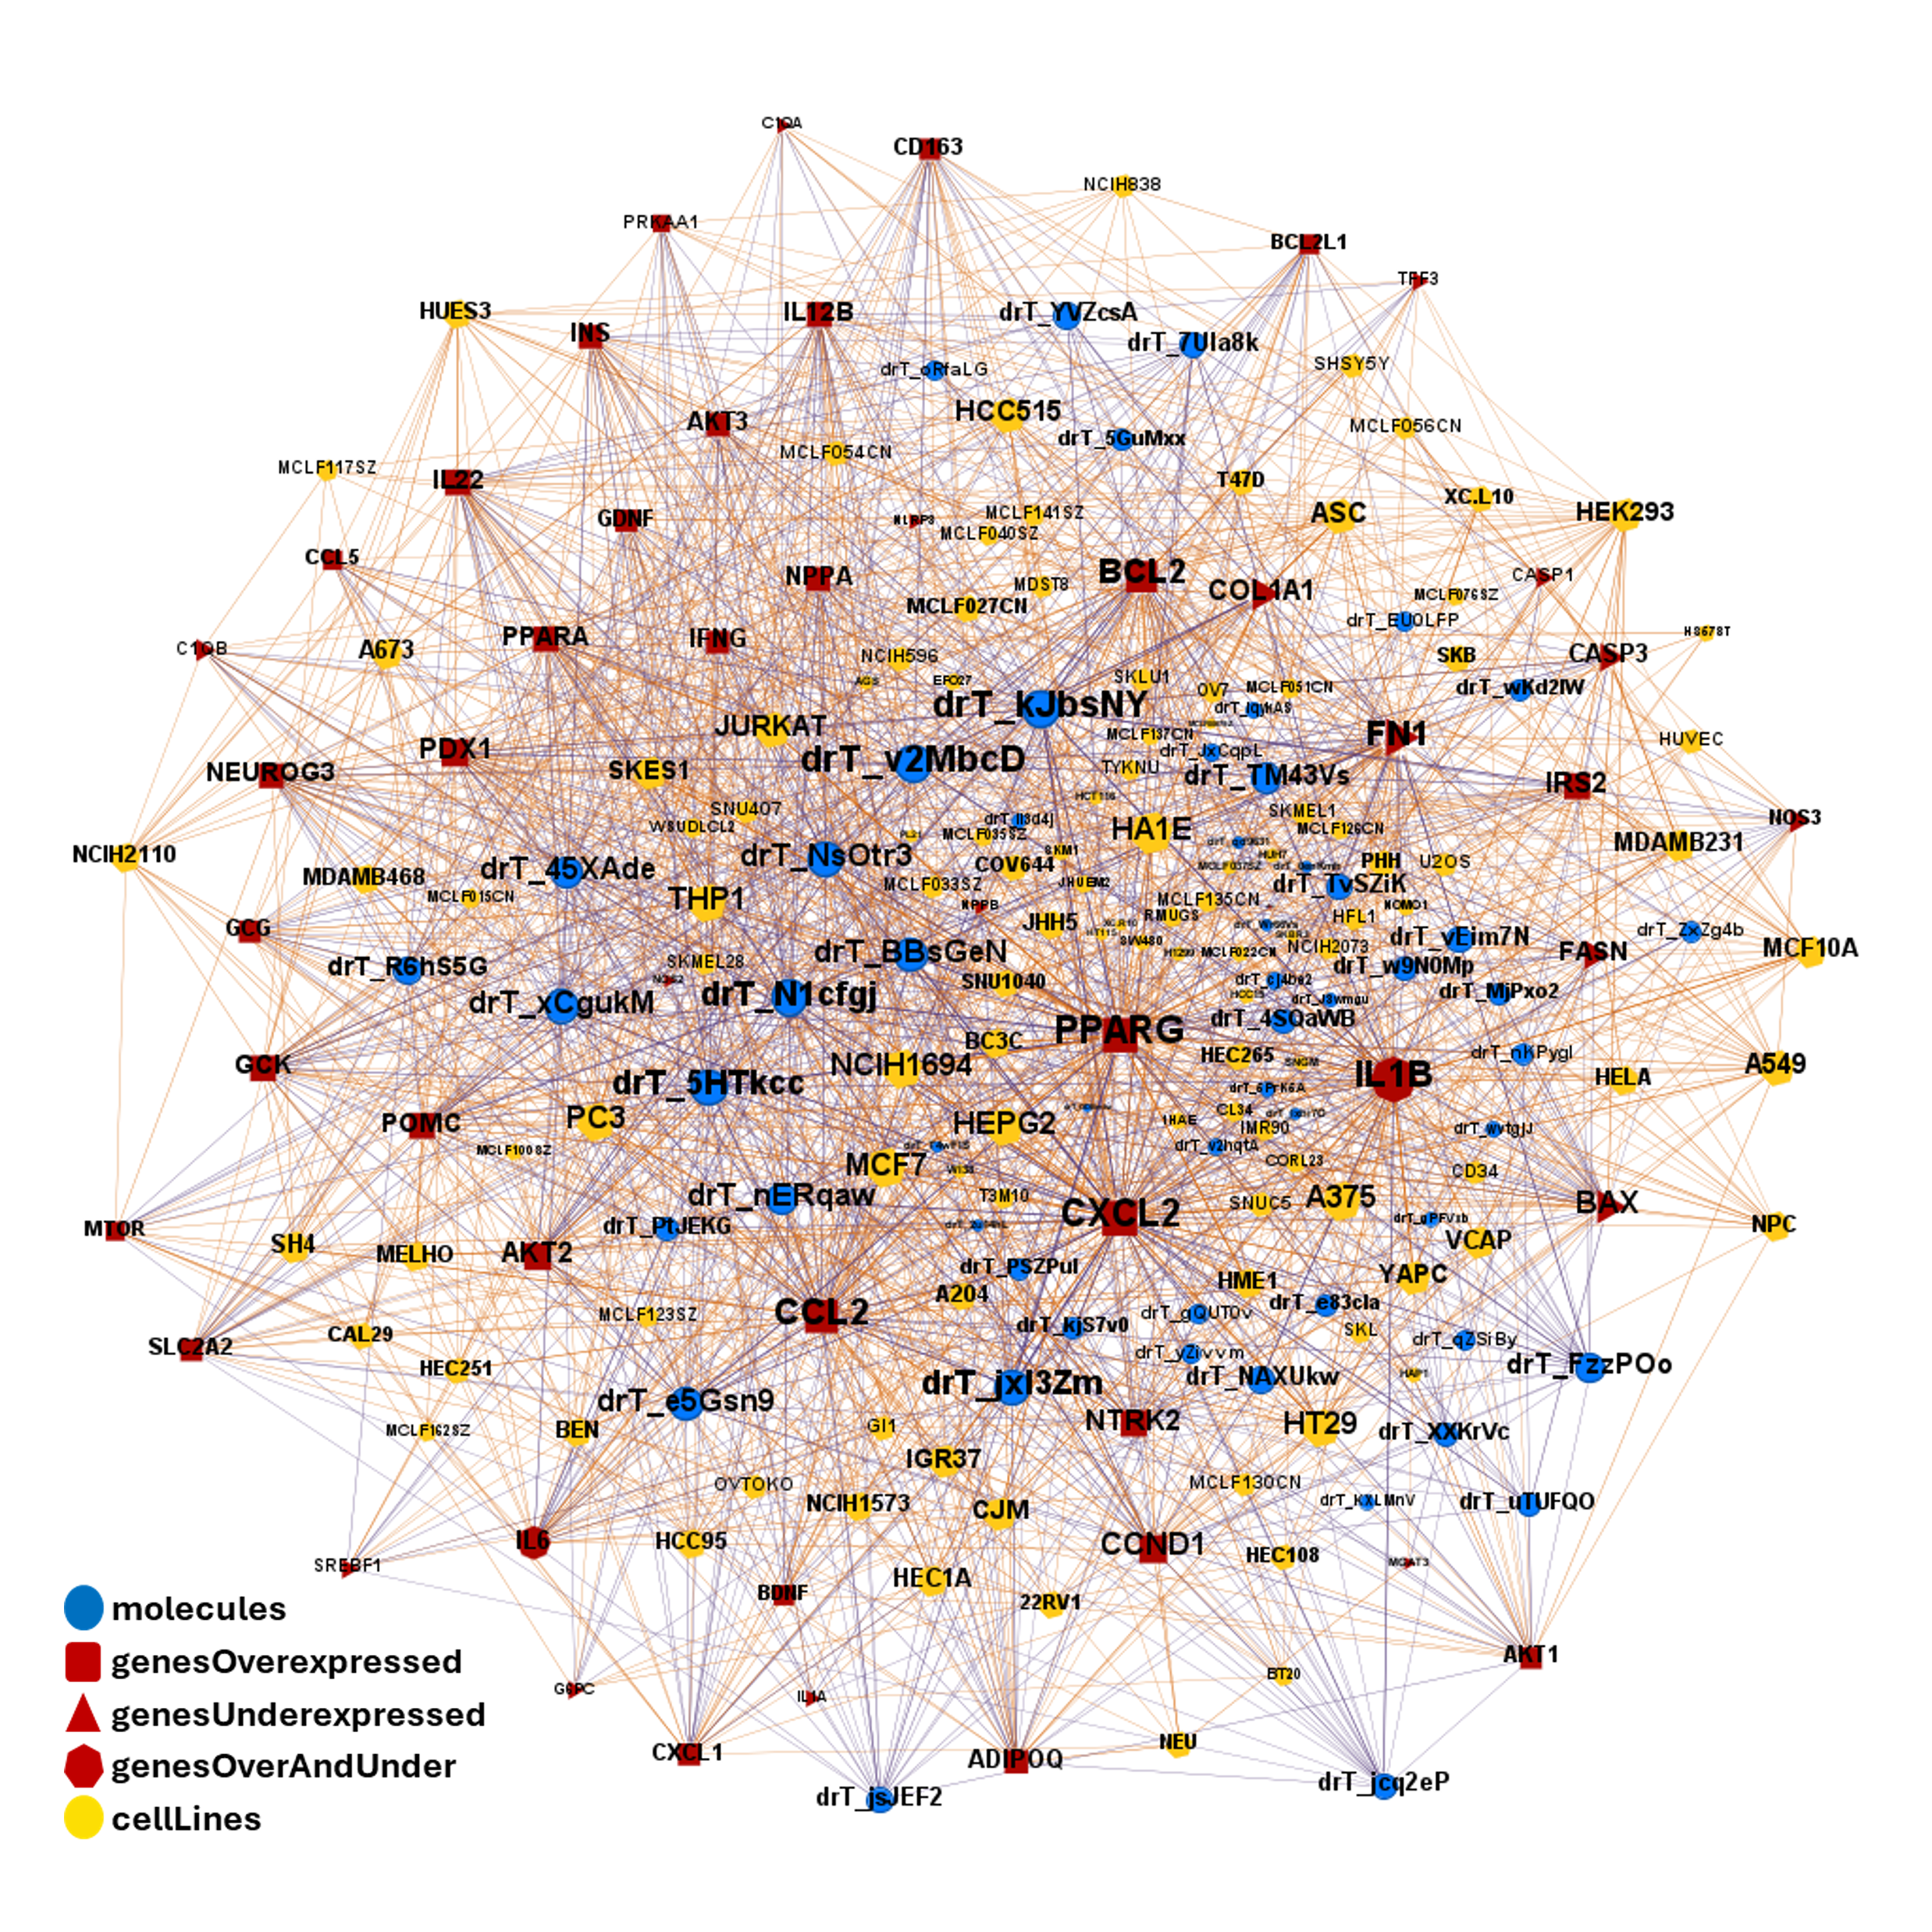
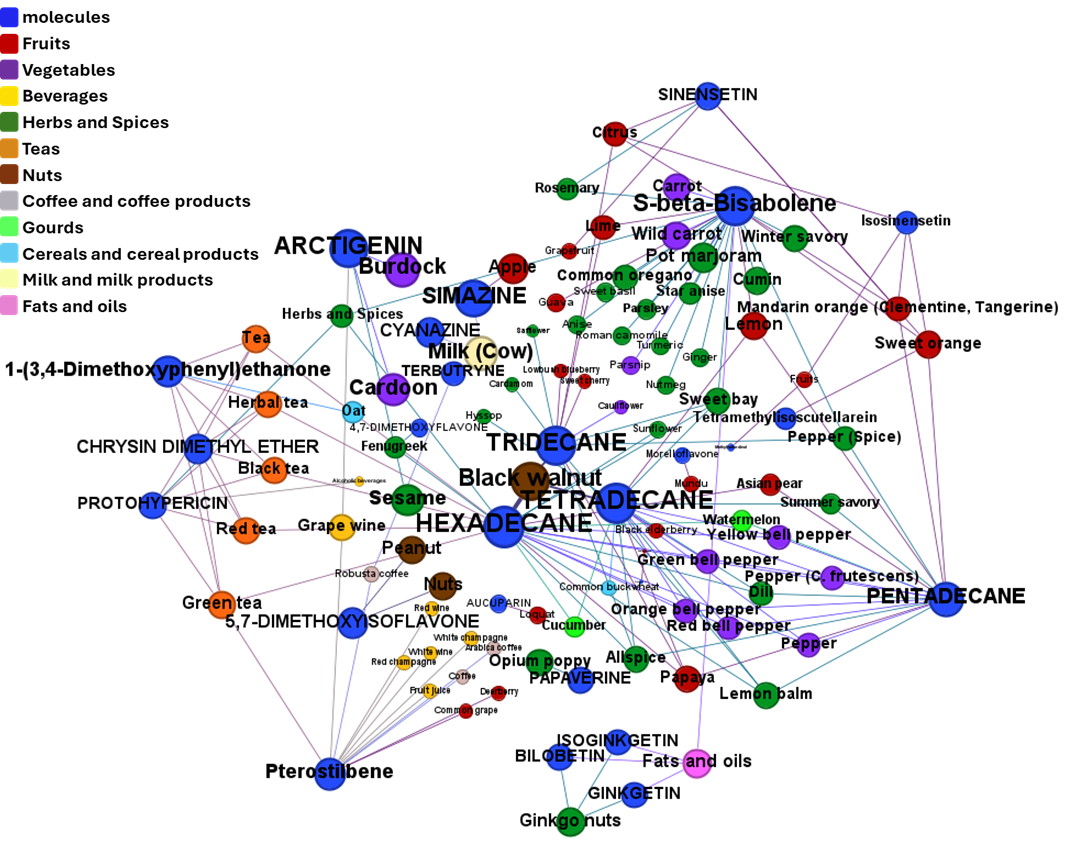
Find out effects of GLP1R predicted active compounds on gene expression and their occurrence in foods. 

GLP1R PAMs gene expression graph

GLP1R PAMs in foods and beverages

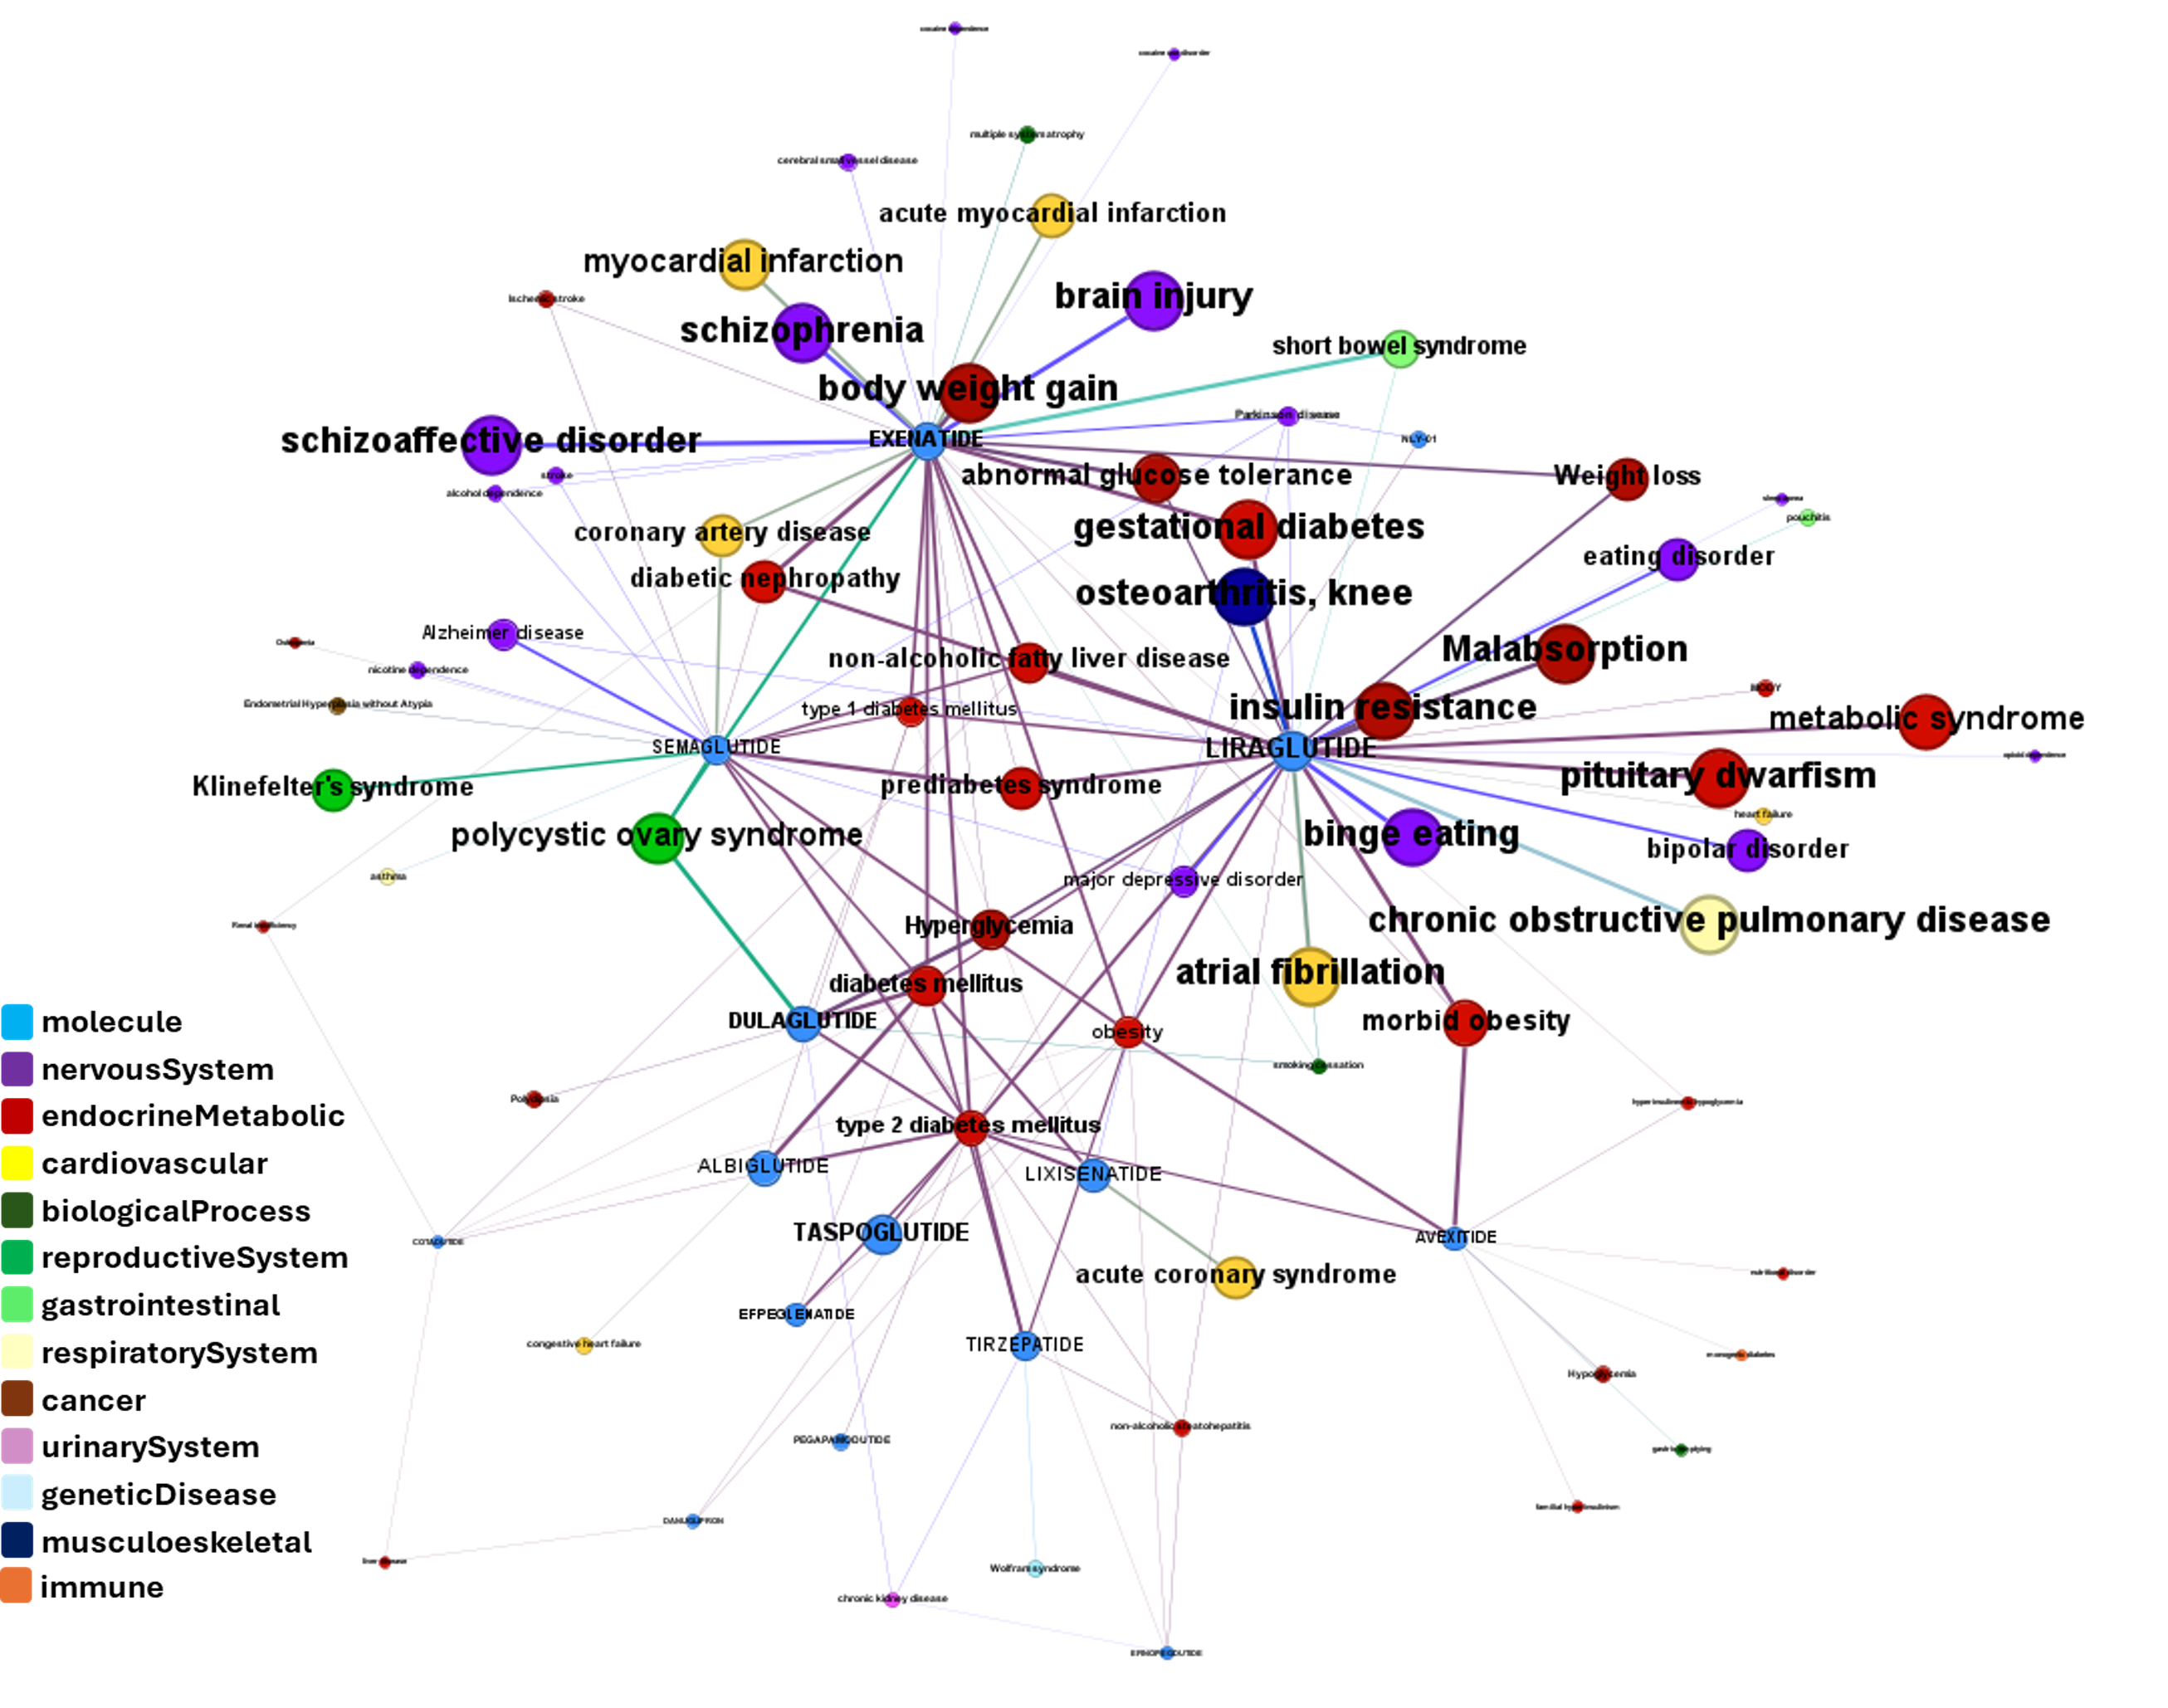
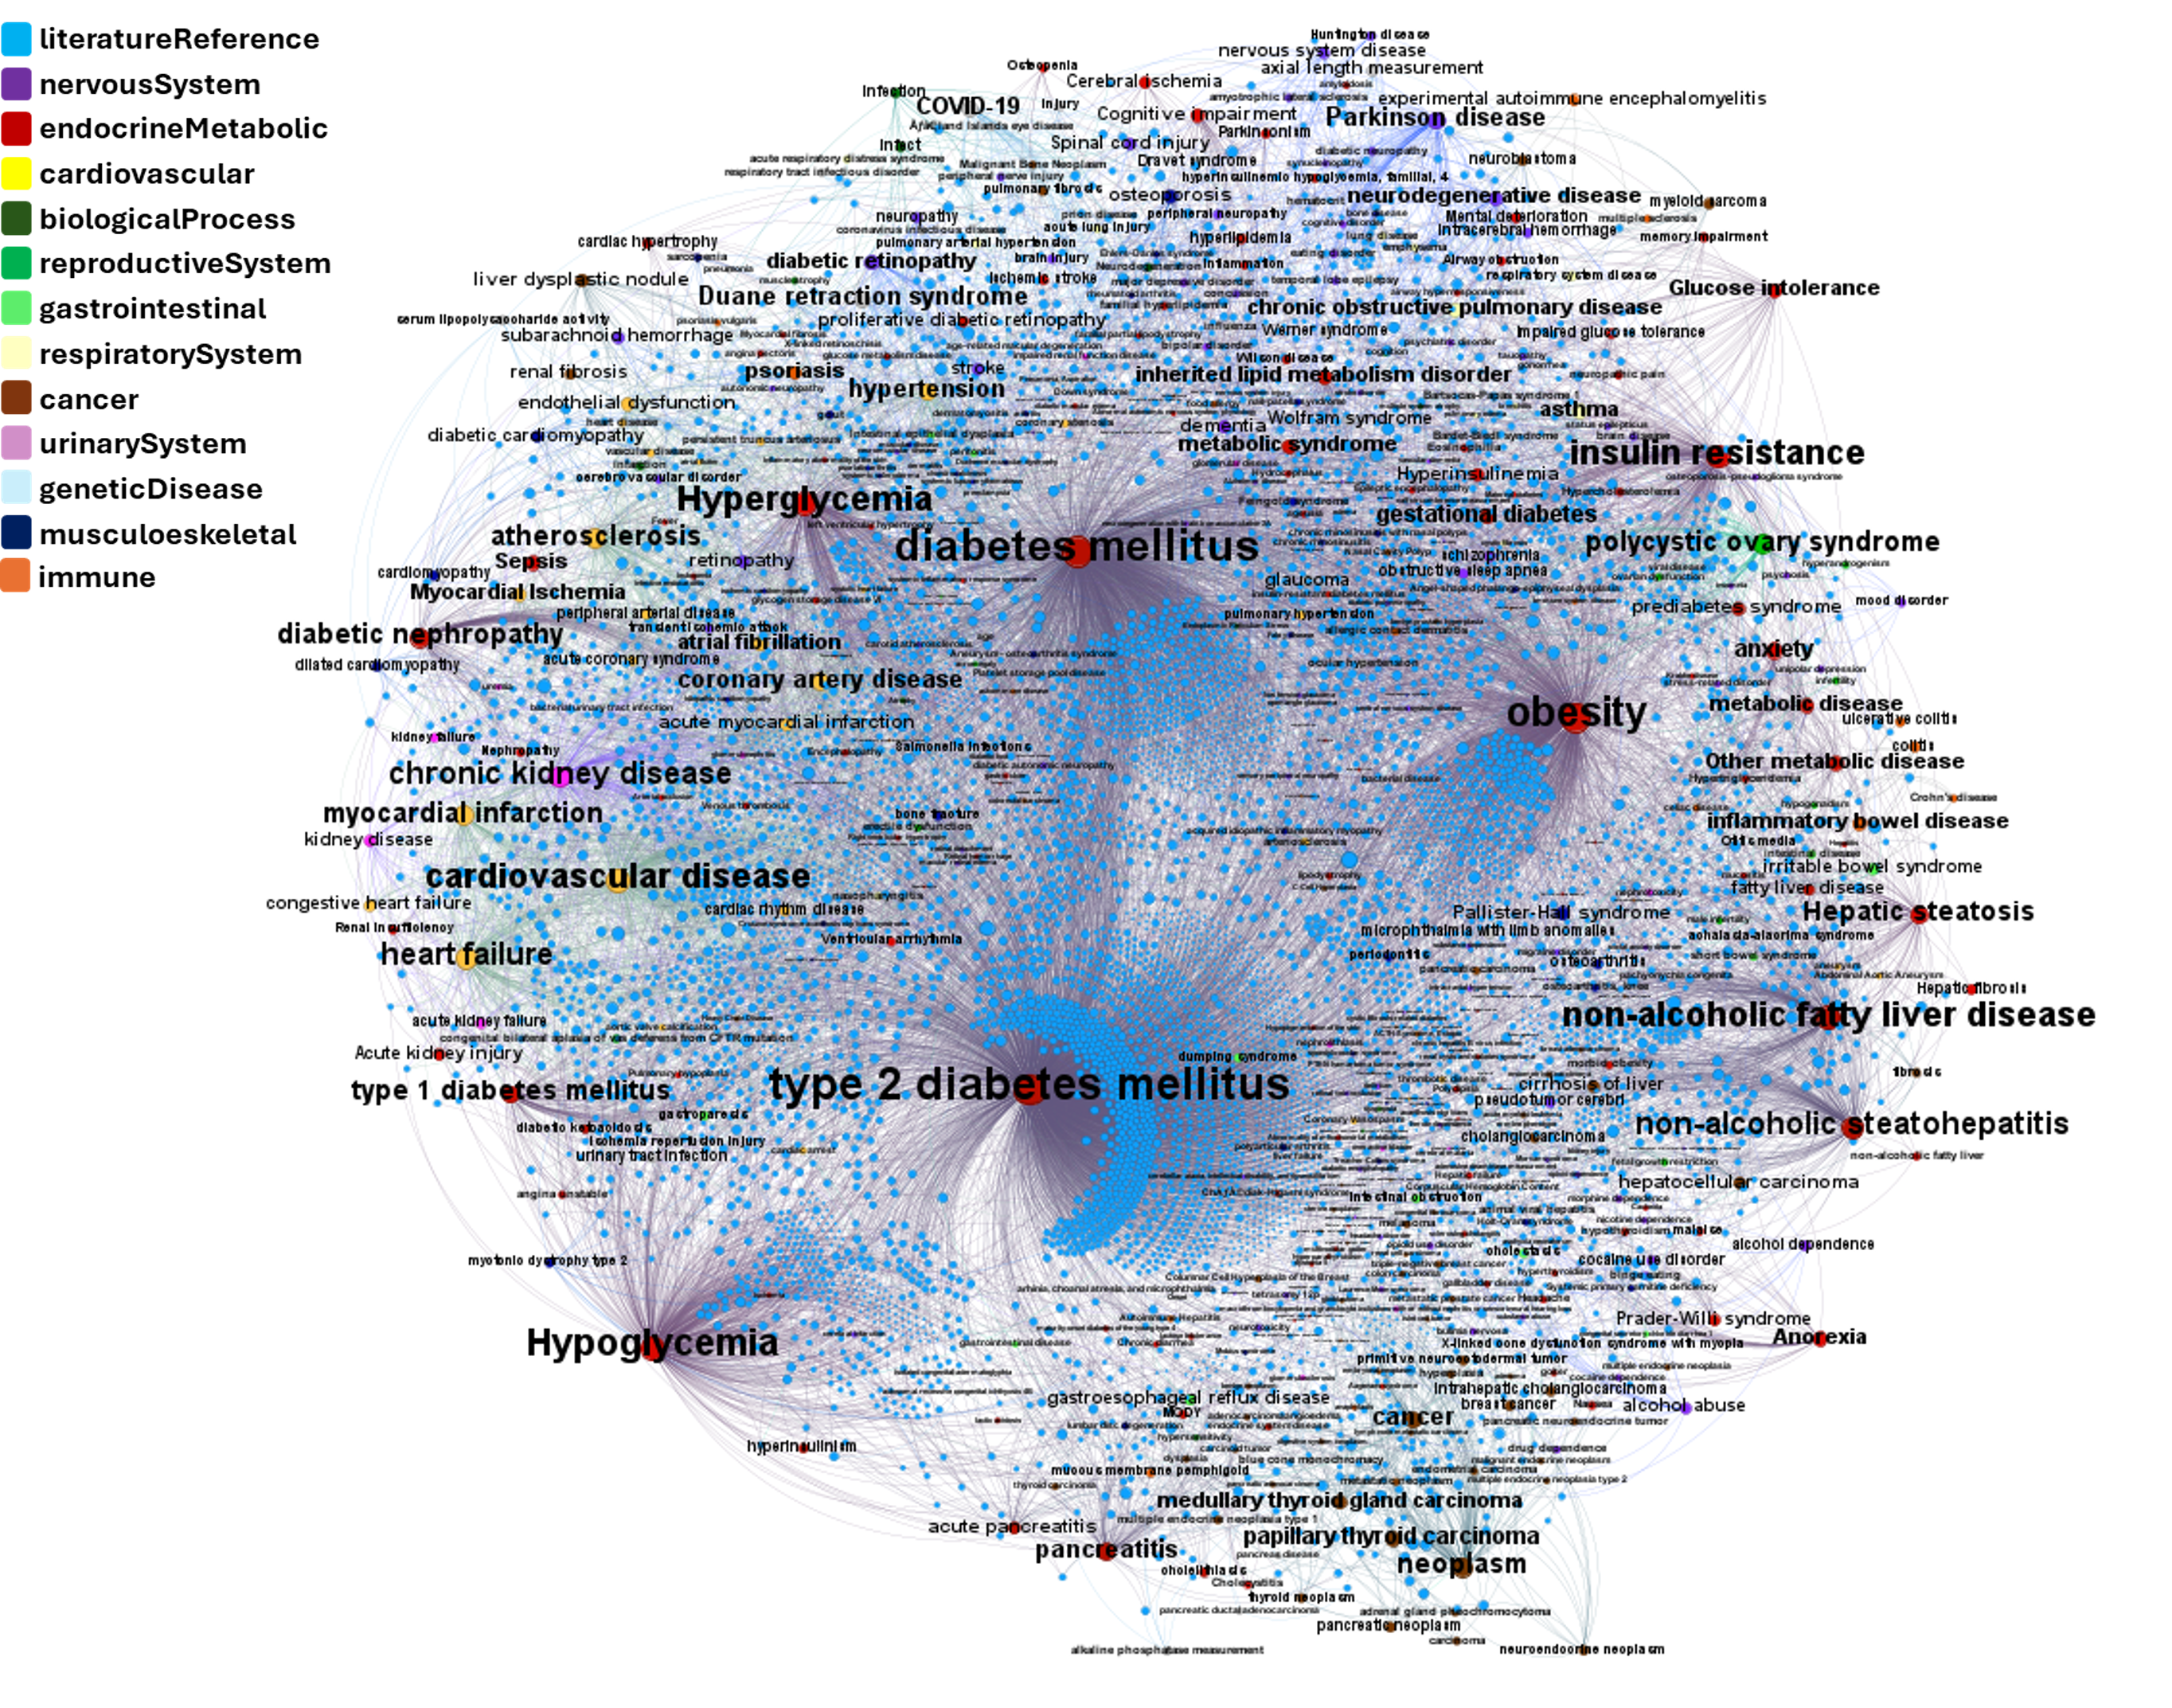
Or explore GLP1R associations with diseases, scored by OpenTargets algorithms. 

GLP1R disease associations as recorded in ChEMBL clinical trials DB and scored in OpenTargets DB

Published articles associating GLP1R with diseases as stored in Europe PMC and scored in OpenTargets DB

See also data sources and machine learning models used. 

drTarget uses 400k values from a full curve GLP1R inverse agonists screens stored in PChem DB plus all ChEMBL GLP1R positive allosteric modulation assays and literature references describing activities of well characterized GLP1R PAMs.

 

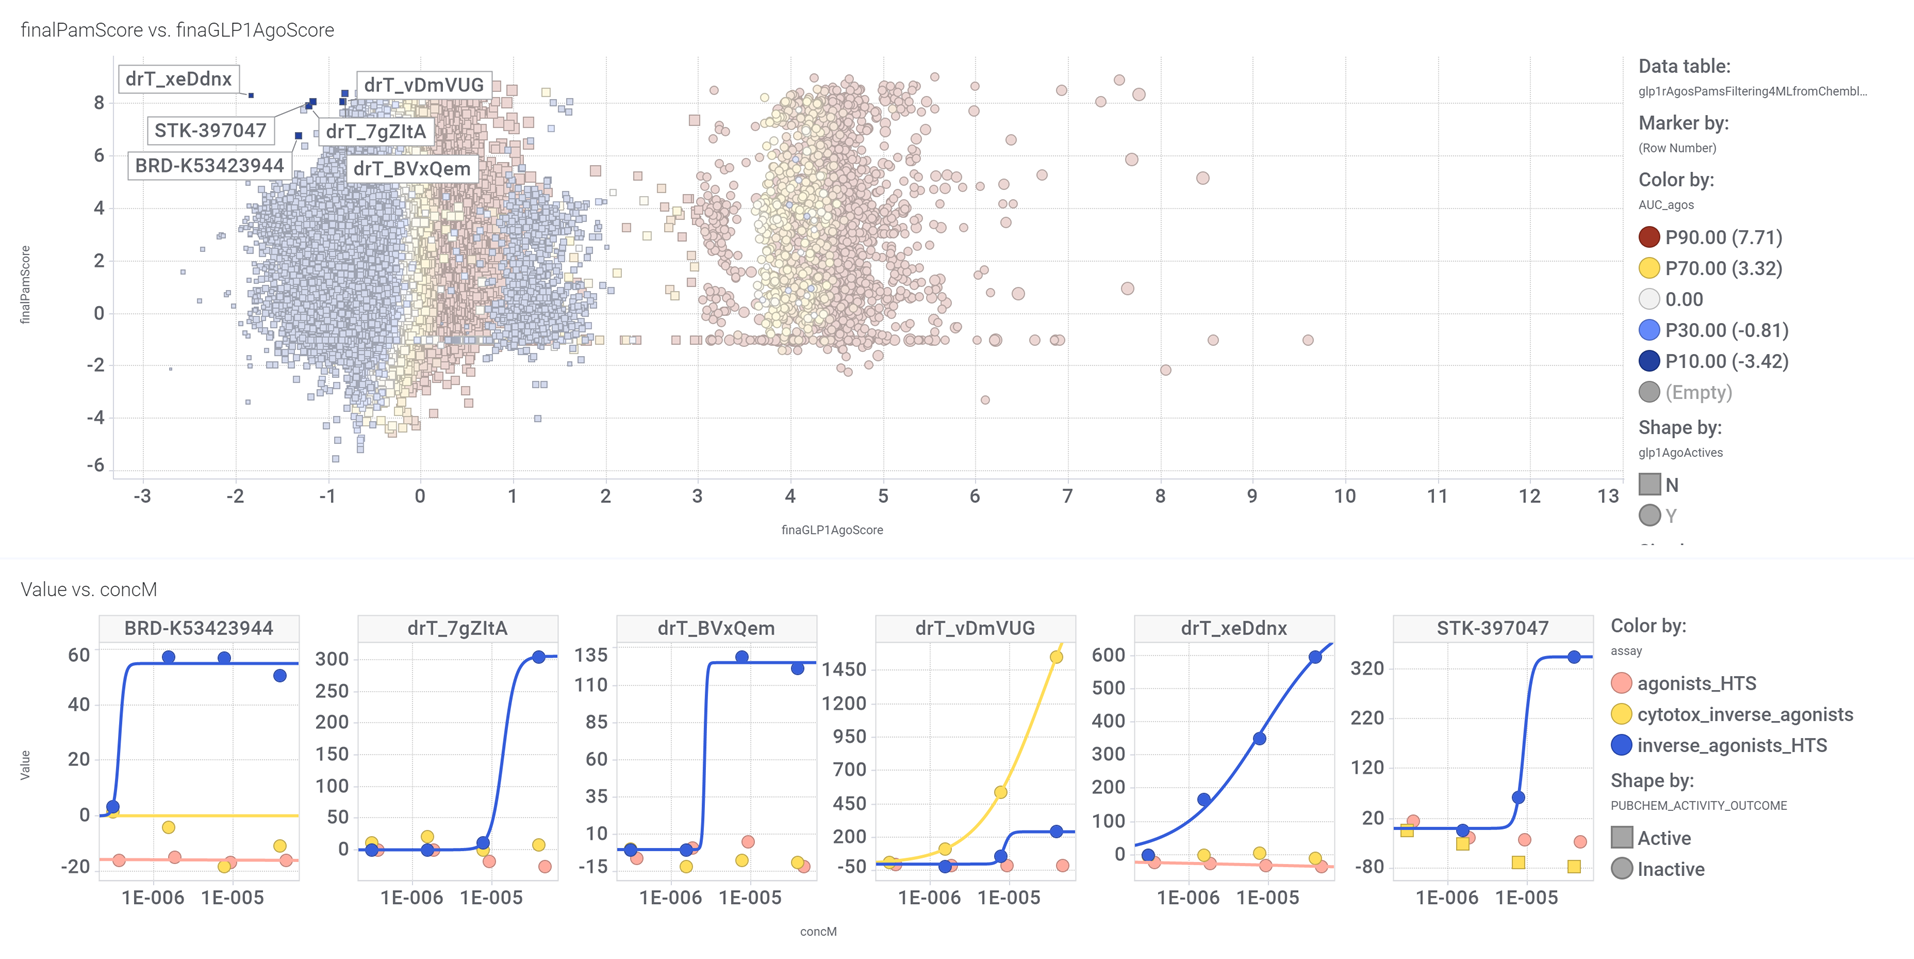
Scatter plot representing a GLP1R PAM vs agonist score selection dashboard. Dots selected in the upper graph are shown as full curves representing PAM, agonist and cytotox activity in the inverse agonists, agonists and cytotoxicity PChem screens.

A set of  random forest regression and classification ensembles is applied to produce a unique GLP1R PAM score and submitted to cross validation.


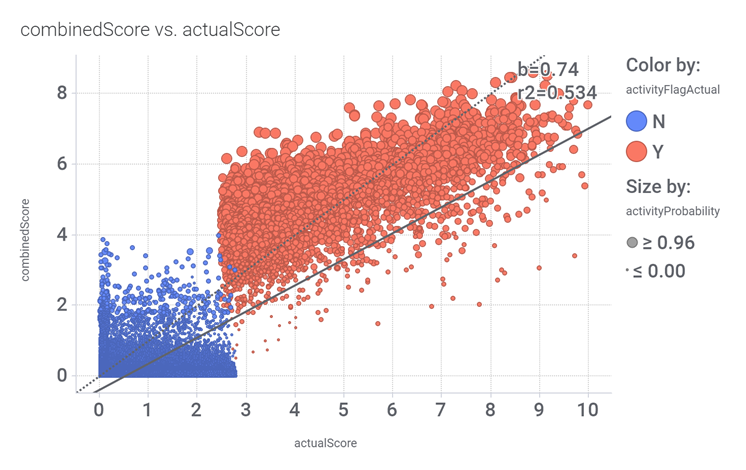
Comparison between actual and predicted activity scores for the resulting combined model.

ML models are applied to the whole ChEMBL DB content and aggregated to the molecule level to calculate a predicted GLP1R activation score. 

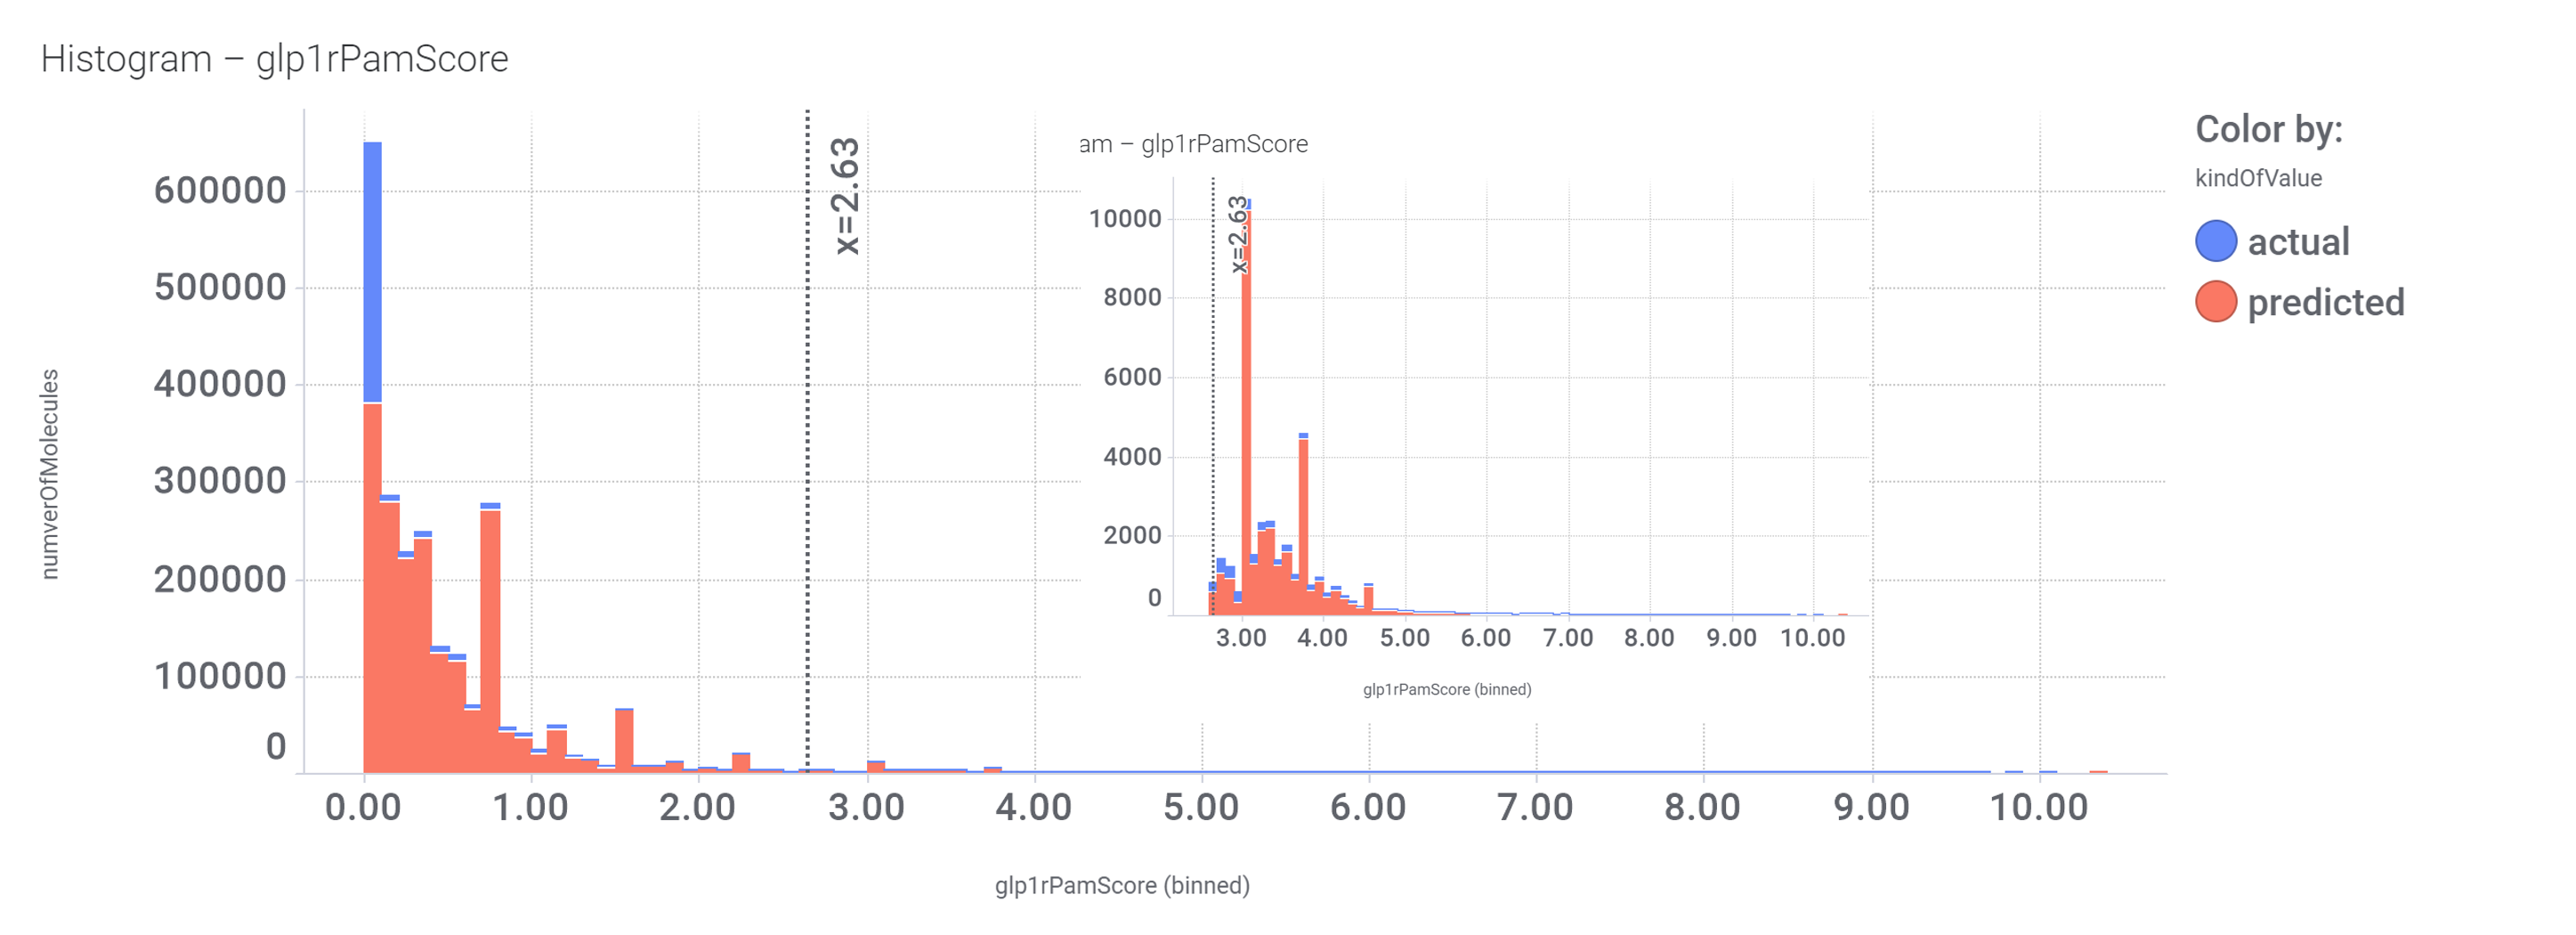
GLP1R PAM activity predictions upon 2.3M molecules. Activity distribution histogram.